Wyoming Normalizeda Unemployment Insurance Statistics: Initial Claims
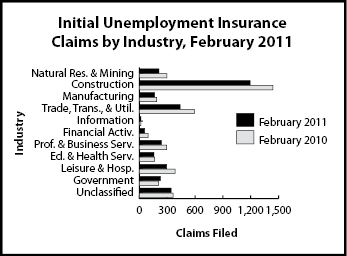
February's statewide initial claims total of 3,422 was 17.4% less than in February 2010 and 39.8% less than January 2011.
| Percent Change Claims Filed | |||||
| Claims Filed | Feb_11 | Feb_11 | |||
| Feb_11 | Jan_11 | Feb_10 | Jan_11 | Feb_10 | |
| Wyoming Statewide | |||||
| Total Claims Filed | 3,422 | 5,687 | 4,144 | -39.8 | -17.4 |
| Goods-Producing | 1,571 | 2,573 | 1,920 | -38.9 | -18.2 |
| Natural Resources and Mining | 211 | 368 | 295 | -42.7 | -28.5 |
| Mining | 194 | 318 | 273 | -39.0 | -28.9 |
| Oil & Gas Extraction | 11 | 24 | 14 | -54.2 | -21.4 |
| Construction | 1,195 | 1,908 | 1,439 | -37.4 | -17.0 |
| Manufacturing | 165 | 297 | 186 | -44.4 | -11.3 |
| Service-Providing | 1,283 | 2,132 | 1,654 | -39.8 | -22.4 |
| Trade, Transp., and Utilities | 440 | 658 | 592 | -33.1 | -25.7 |
| Wholesale Trade | 60 | 83 | 83 | -27.7 | -27.7 |
| Retail Trade | 235 | 401 | 340 | -41.4 | -30.9 |
| Transp., Warehousing & Utils. | 145 | 174 | 169 | -16.7 | -14.2 |
| Information | 17 | 26 | 17 | -34.6 | 0.0 |
| Financial Activities | 57 | 58 | 95 | -1.7 | -40.0 |
| Prof. and Business Services | 237 | 492 | 293 | -51.8 | -19.1 |
| Educational and Health Services | 157 | 196 | 163 | -19.9 | -3.7 |
| Leisure and Hospitality | 293 | 626 | 385 | -53.2 | -23.9 |
| Other Svcs., exc. Public Admin. | 82 | 76 | 109 | 7.9 | -24.8 |
| Government | 227 | 403 | 207 | -43.7 | 9.7 |
| Federal Government | 83 | 165 | 75 | -49.7 | 10.7 |
| State Government | 25 | 29 | 18 | -13.8 | 38.9 |
| Local Government | 119 | 209 | 114 | -43.1 | 4.4 |
| Local Education | 28 | 47 | 36 | -40.4 | -22.2 |
| Unclassified | 341 | 579 | 363 | -41.1 | -6.1 |
| Laramie County | |||||
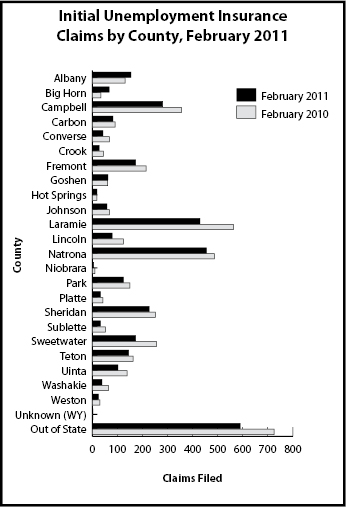
| Total Claims Filed | 426 | 745 | 561 | -42.8 | -24.1 |
| Goods-Producing | 195 | 373 | 235 | -47.7 | -17.0 |
| Construction | 161 | 287 | 202 | -43.9 | -20.3 |
| Service-Providing | 187 | 300 | 274 | -37.7 | -31.8 |
| Trade, Transp., and Utilities | 74 | 106 | 126 | -30.2 | -41.3 |
| Financial Activities | 13 | 9 | 17 | 44.4 | -23.5 |
| Prof. and Business Services | 30 | 84 | 37 | -64.3 | -18.9 |
| Educational and Health Services | 28 | 34 | 39 | -17.6 | -28.2 |
| Leisure and Hospitality | 23 | 54 | 39 | -57.4 | -41.0 |
| Government | 29 | 53 | 36 | -45.3 | -19.4 |
| Unclassified | 15 | 19 | 16 | -21.1 | -6.3 |
| Natrona County | |||||
| Total Claims Filed | 453 | 650 | 487 | -30.3 | -7.0 |
| Goods-Producing | 200 | 282 | 217 | -29.1 | -7.8 |
| Construction | 166 | 202 | 170 | -17.8 | -2.4 |
| Service-Providing | 226 | 336 | 247 | -32.7 | -8.5 |
| Trade, Transportation, and Utilities | 75 | 116 | 73 | -35.3 | 2.7 |
| Financial Activities | 4 | 16 | 20 | -75.0 | -80.0 |
| Professional and Business Services | 39 | 78 | 48 | -50.0 | -18.8 |
| Educational and Health Services | 35 | 43 | 40 | -18.6 | -12.5 |
| Leisure and Hospitality | 39 | 51 | 43 | -23.5 | -9.3 |
| Government | 15 | 16 | 11 | -6.3 | 36.4 |
| Unclassified | 12 | 16 | 12 | -25.0 | 0.0 |