Detailed Covered Employment and Wages for Third Quarter 2010: Mining Leads Payroll Growth
Total payroll (4.7%) and average weekly wage (4.9%) increased in third quarter 2010 compared to third quarter 2009, but average monthly employment (-0.1%) decreased slightly. Total payroll and average weekly wage have grown over the last two quarters, but over-the-year total employment has decreased every quarter dating back to first quarter 2009.
Total unemployment insurance (UI) covered payroll increased by $128.2 million (4.7%) in third quarter 2010. This was the second consecutive quarter that payroll has increased but overall job losses continued. The largest job 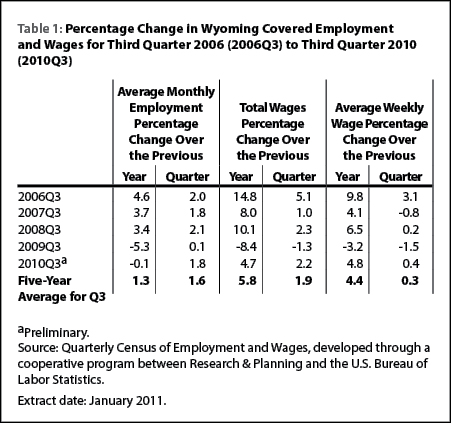 gains (1,291 jobs, or 5.3%) and increases in total payroll ($45.4 million, or 10.5%) occurred in mining (including oil & gas). UI covered payroll represents approximately 91% of all wage and salary disbursements and 43% of personal income in the state (U.S. Bureau of Economic Analysis, 2011).
Although payroll grew at a slower rate than its five-year average (4.7% compared to 5.8%), it grew faster than in third quarter 2009 (-8.4%; see Table 1). Employment decreased by 0.1%, which was a much smaller job loss than in third quarter 2009 (-5.3%). Analysts have noted that "minerals related employment is one of the key predictors of sales and use tax income" in Wyoming (CREG 2010).
The covered payroll and employment data in this article are tabulated by place of work, in contrast to the labor force estimates which are a measure of employed and unemployed persons by place of residence. Also, the employment data presented in this article represent a count of jobs, not persons. When individuals work more than one job, each is counted separately. Finally, job growth (or decline) is stated in terms of net change. The Quarterly Turnover Statistics by Industry table presents alternative measures of job gains and losses.
The purpose of this article is to show employment and payroll changes between third quarter 2009 and third quarter 2010. These economic changes help gauge the overall strength of Wyoming's economy and identify the fastest and slowest growing sectors and geographic areas.
The Figure shows that total payroll growth fell sharply from 10.1% in third 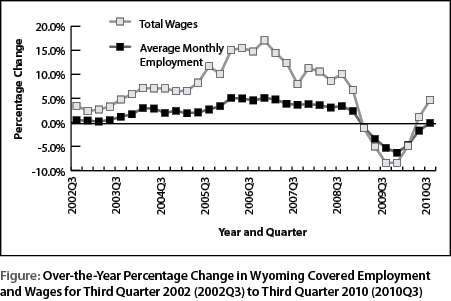 quarter 2008 to -8.4% in fourth quarter 2009. Employment growth decreased from 3.4% in third quarter 2008 to -6.3% at the end of 2009. Growth in total payroll has rebounded at a faster pace than employment, rising to 4.7% in third quarter 2010 (see Table 2).
Employment and Wages by County
As can be seen in Table 3, total payroll increased in 18 counties and decreased in 5. 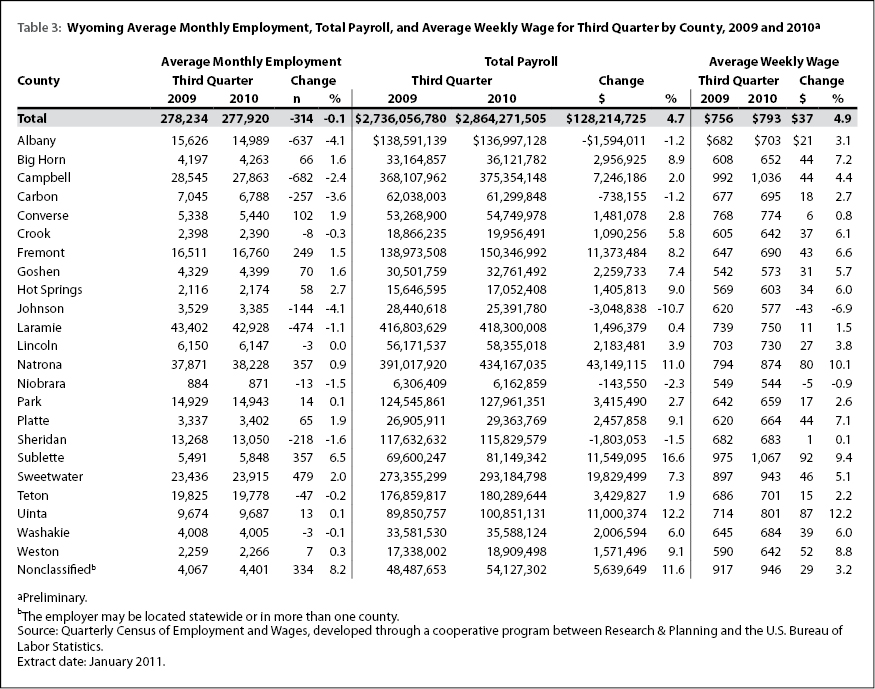 Employment rose in approximately half of Wyoming's counties. It is possible that some of the job gains in the southeast region of the state may be related to oil development in the Niobrara formation.
Sweetwater County added 479 jobs (2.0%) and its total payroll increased by $19.8 million (7.3%). The largest job gains were in mining (including oil & gas; more than 250 jobs), construction (approximately 150 jobs), professional & technical services (approximately 100 jobs), and local government (including public schools, colleges, and hospitals; approximately 100 jobs).
Employment in Sublette County increased by 357 jobs (6.5%) and total payroll grew by $11.5 million (16.6%). Construction added nearly 300 jobs and mining (including oil & gas) added approximately 100 jobs.
Fremont County gained 249 jobs (1.5%) and its total payroll increased by $11.4 million (8.2%). The largest job gains occurred in local government (including public schools & colleges; approximately 100 jobs), mining (including oil & gas; more than 50 jobs), health care & social assistance (approximately 50 jobs), and professional & technical services (approximately 50 jobs). Job losses were seen in manufacturing and retail trade.
Converse County added 102 jobs (1.9%) and its total payroll rose by $1.5 million (2.8%). Mining (including oil & gas) added nearly 200 jobs, and smaller job gains were seen in local government, administrative & waste services, and health care & social assistance. Employment fell noticeably in construction.
Campbell County lost 682 jobs (-2.4%), but its total payroll increased by $7.3 million (2.0%). The largest job losses were seen in construction (approximately 300 jobs), retail trade (approximately 150 jobs), and manufacturing (more than 50 jobs).
Albany County's employment fell by 637 jobs (-4.1%) and its total payroll decreased by $1.6 million (-1.2%). Sizeable job losses occurred in construction (approximately 250 jobs), state government (more than 150 jobs), and administrative & waste services (approximately 100 jobs).
Employment in Carbon County decreased by 257 jobs (-3.6%) and its total payroll fell by $0.7 million (-1.2%). Substantial job losses were seen in local government (including public schools; approximately 100 jobs), retail trade (approximately 50 jobs), and administrative & waste services (approximately 50 jobs).
Sheridan County lost 218 jobs (-1.6%) and its total payroll fell by $1.8 million (-1.5%). Relatively small job losses were seen in several sectors, including construction, retail trade, professional & technical services, manufacturing, finance & insurance, and wholesale trade.
Teton County lost 47 jobs (-0.2%) and its total payroll increased by $3.4 million (1.9%). Large job losses in construction (approximately 400 jobs) and retail trade (more than 100 jobs) more than offset job gains in accommodation & food services (approximately 300 jobs) and arts, entertainment, & recreation (approximately 100 jobs).
Natrona County (see Table 3a) gained 357 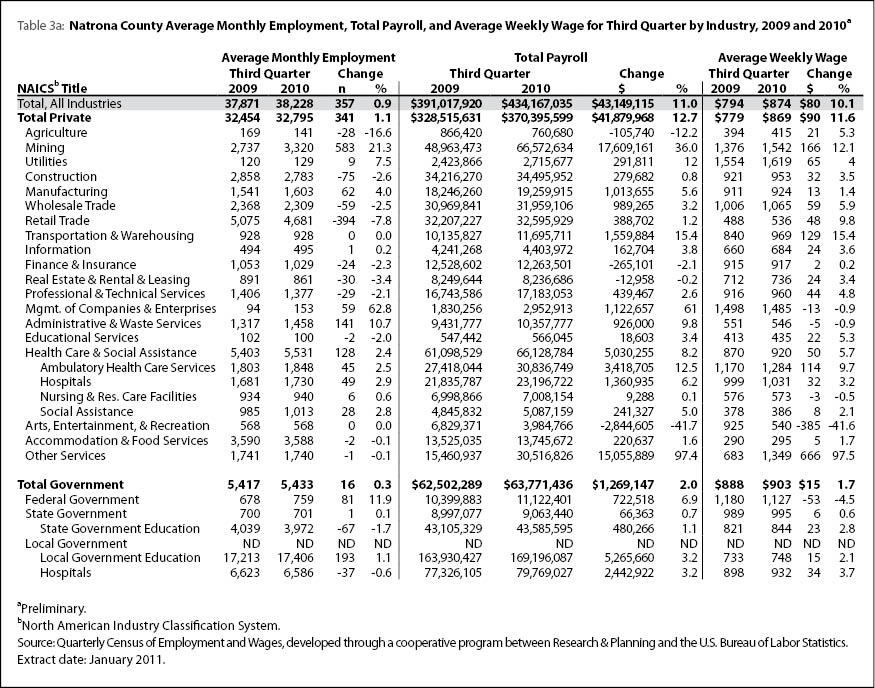 jobs (0.9%) and its total payroll rose by $43.1 million (11.0%). The largest job gains occurred in mining (including oil & gas; 583 jobs, or 21.3%), administrative & waste services (141 jobs, or 10.7%), and health care & social assistance (128 jobs, or 2.4%). Retail trade posted the largest job losses (-394 jobs, or -7.8%).
Laramie County (see Table 3b) lost 474 jobs (-1.1%) but its total payroll increased 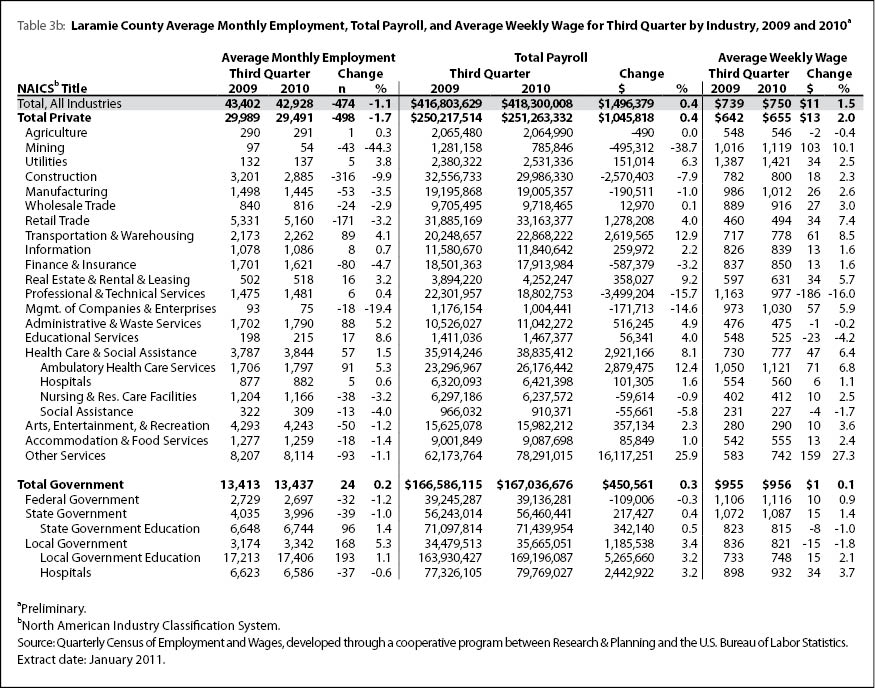 very slightly ($1.5million, or 0.4%). Substantial job losses were noted in construction (-316 jobs, or -9.9%) and retail trade (-171 jobs, or -3.2%). Employment increased in local government (96 jobs, or 1.4%), transportation & warehousing (89 jobs, or 4.1%), and administrative & waste services (88 jobs, or 5.2%).
Statewide Employment and Wages by Industry
Mining (including oil & gas) posted the largest job gains, followed by 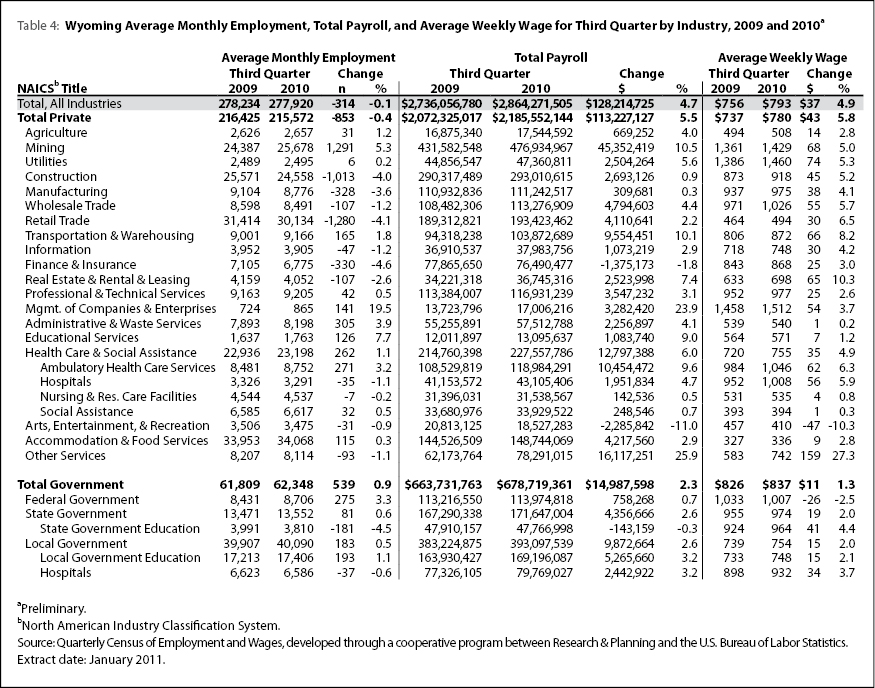 administrative & waste services, federal government, health care & social assistance, local government (including public schools, colleges, & hospitals), and transportation & warehousing (see Table 4). Sizeable job losses were noted in retail trade, construction, finance & insurance, and manufacturing.
Mining (including oil & gas) gained 1,291 jobs (5.3%) and its total payroll grew by $45.4 million (10.5%). Oil & gas extraction added approximately 100 jobs, mining, except oil & gas added approximately 50 jobs, and support activities for mining added approximately 1,100 jobs.
Administrative & waste services gained 305 jobs (3.9%) and its total payroll rose by $2.3 million (4.1%). Employment services (including temporary help agencies) added nearly 300 jobs, while job losses were seen in business support services.
Federal government added 275 jobs (3.3%) and its total payroll increased by $0.8 million (0.7%). At least part of the increased employment was related to the U.S. Census Bureau hiring temporary workers to conduct the decennial census.
Health care & social assistance gained 262 jobs (1.1%) and its total payroll grew by $12.8 million (6.0%). Employment increased substantially in ambulatory health care services (271 jobs, or 3.2%), while minor job losses were seen in private hospitals (-35 jobs, or -1.1%), and nursing & residential care facilities (-7 jobs, or -0.2%).
Employment in local government increased by 183 jobs (0.5%) and its total payroll rose by $9.9 million (2.6%). Job gains in local government education (including school districts and community colleges; 193 jobs, or 1.1%) were partially offset by small job losses in hospitals (-37 jobs, or -0.6%).
Transportation & warehousing added 165 jobs (1.8%) and its total payroll increased by $9.6 million (10.1%). Modest growth occurred in air transportation, truck transportation, transit & ground passenger transportation, couriers & messengers, and warehousing & storage.
Retail trade employment fell by 1,280 jobs (-4.1%), but its total payroll increased by $4.1 million (2.2%). General merchandise stores (including warehouse clubs and supercenters) posted the largest job losses (more than 300 jobs). Employment decreases were also seen in food & beverage stores (more than 250 jobs), miscellaneous store retailers (more than 150 jobs), nonstore retailers (more than 150 jobs), gasoline stations (more than 150 jobs), and motor vehicle & parts dealers (approximately 150 jobs).
Construction lost 1,013 jobs (-4.0%), but its total payroll rose by $2.7 million (0.9%). Employment fell in construction of buildings (approximately 700 jobs) and specialty trade contractors (approximately 600 jobs), but increased in heavy & civil engineering construction (more than 300 jobs).
Employment in finance & insurance decreased by 330 jobs (-4.6%) and its total payroll fell by $1.4 million (-1.8%). Credit intermediation & related activities lost approximately 250 jobs while insurance carriers & related activities lost approximately 50 jobs.
Manufacturing employment fell by 328 jobs (-3.6%), but its total payroll increased modestly ($0.3 million, or 0.3%). Job losses were seen in fabricated metal product manufacturing (approximately 100 jobs), miscellaneous manufacturing (approximately 100 jobs), petroleum & coal products manufacturing (more than 50 jobs), nonmetallic mineral product manufacturing (more than 50 jobs), furniture & related product manufacturing (approximately 50 jobs), and machinery manufacturing (approximately 50 jobs). Transportation equipment manufacturing added more than 100 jobs, and chemical manufacturing added nearly 50 jobs.
In summary, Wyoming's labor market continued to recover in third quarter. Total payroll increased by $128.2 million (4.7%) and net job losses were very small (-314 jobs, or -0.1%). The largest job gains (1,291 jobs, or 5.3%) and increases in total payroll ($45.4 million, or 10.5%) occurred in the mining sector.
Senior Economist David Bullard can be reached at (307) 473-3810 or david.bullard@wyo.gov.
References
Consensus Revenue Estimating Group (CREG). (2010, October). Wyoming state government revenue forecast fiscal year 2011-fiscal year 2016. Retrieved February 17, 2011 from http://eadiv.state.wy.us/creg/GreenCREG_Oct10.pdf
U.S. Bureau of Economic Analysis. (2011, March 16). SA04 State income and employment summary — Wyoming. Retrieved March 16, 2011, from http://www.bea.gov/regional/spi/default.cfm
U.S. Census Bureau. (2007, August 28). 2007 NAICS codes and titles. Retrieved March 16, 2011, from http://www.census.gov/naics/2007/NAICOD07.htm