Wyoming Labor Force Trends
December 2025 | Volume 62, No. 12
Click Here for PDF
Return to Table of Contents
2025Q1 Quarterly Update
Wyoming Job Growth Slows from Prior Quarters
by: Michael Moore, Research Supervisor
This article provides an overview of Wyoming’s employment and wages in first quarter 2025 at the county and industry levels, in order to identify areas of over-the-year job growth. This article also includes a discussion on post-pandemic job growth, which has slowed in recent quarters.
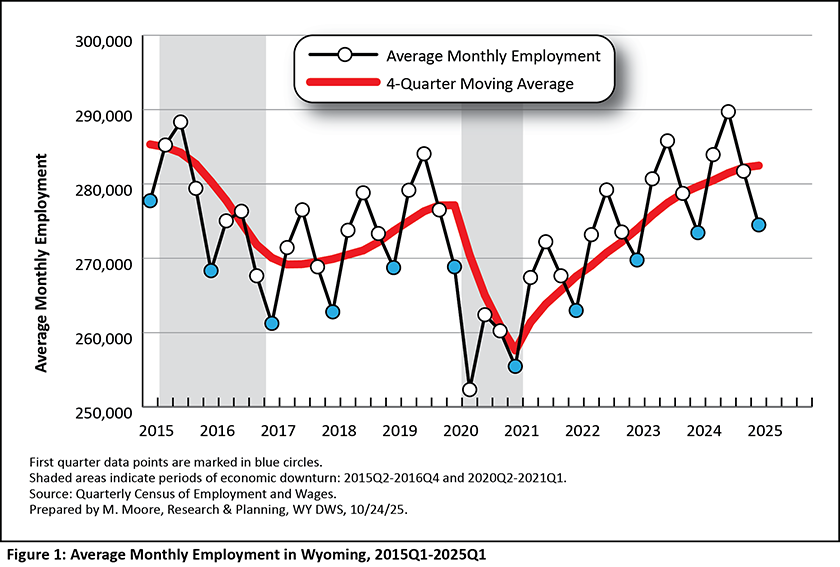
Wyoming’s average monthly employment increased just 0.4% over the year in first quarter 2025 (2025Q1), the slowest rate of job growth since first quarter 2020 (2020Q1) prior to the Covid-19 pandemic. However, 2025Q1 was the 16th consecutive quarter over-the-year job growth for Wyoming, as the state added 1,048 jobs (see Table 1). Despite the slow growth, 2025Q1 marked the highest first quarter employment in Wyoming since 2015Q1 (see Figure 1).
This article looks at quarterly employment and wages at the county and industry levels for 2025Q1 in Wyoming. This article also provides information on the industries and counties that have gained (or lost) the greatest number of jobs in the years since the Covid-19 pandemic.
The data discussed in this article are from the Quarterly Census of Employment and Wages (QCEW). Data from 2025Q1 are available at https://doe.state.wy.us/LMI/25Q1_QCEW/toc.htm.
Introduction
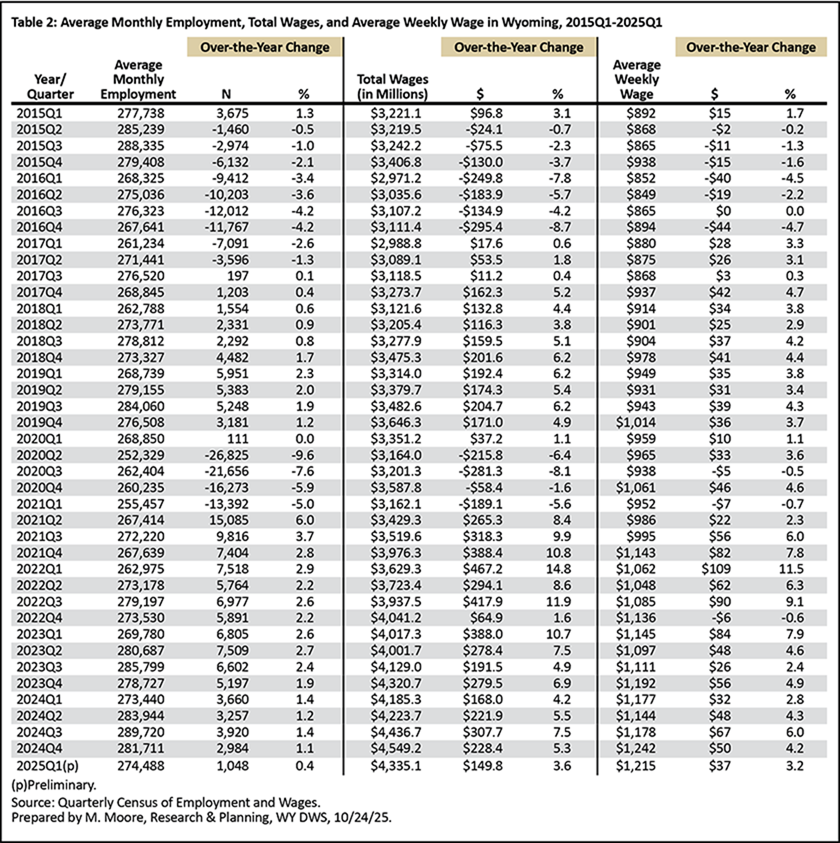
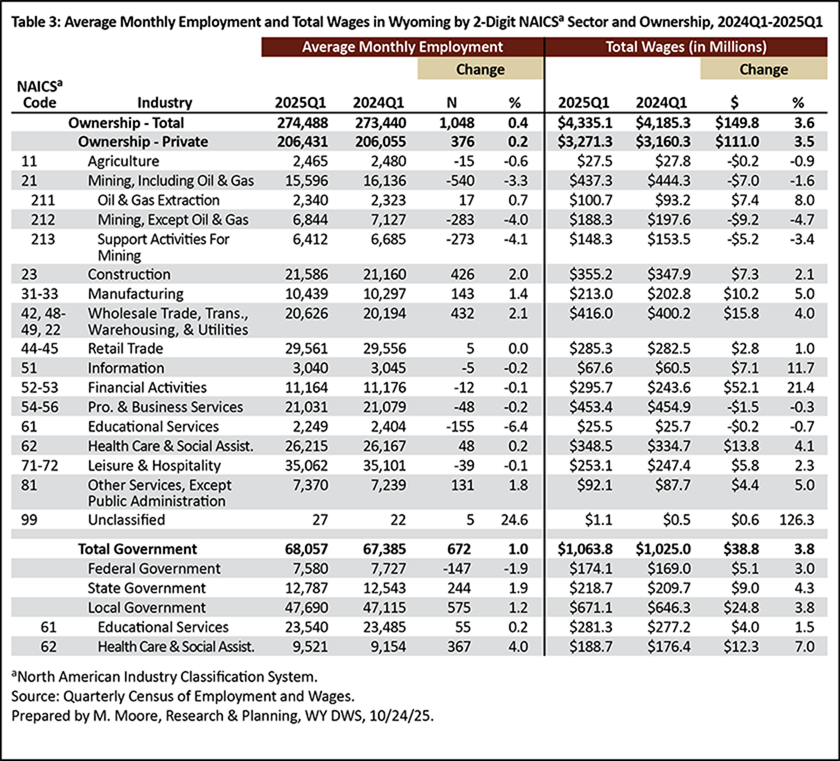
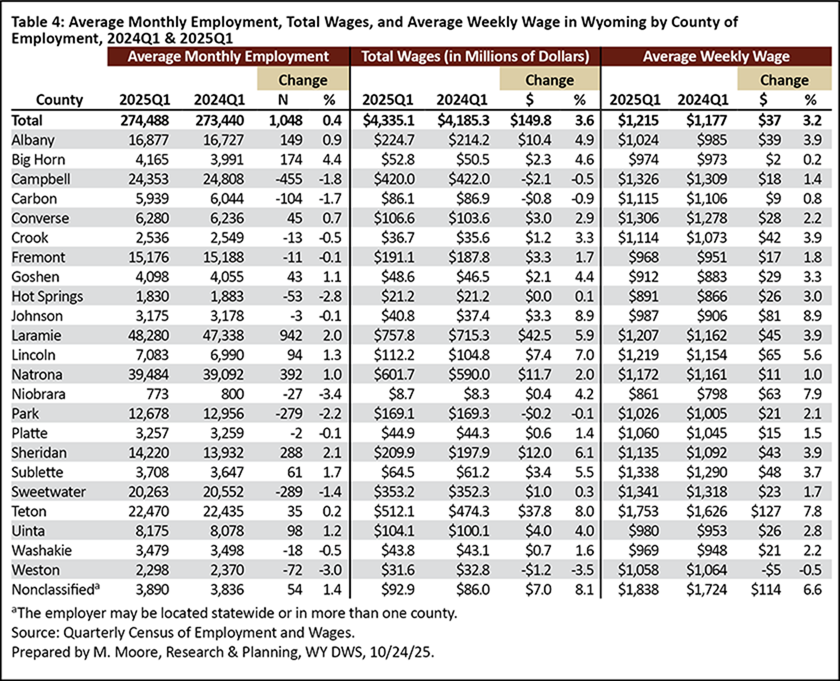
Wyoming’s average monthly employment in 2025Q1 was 274,488, an increase of 1,048 jobs (0.4%) compared to 2024Q1 (see Table 2). The state had $4.3 billion in total wages, up $149.8 million (3.6%) over the year. Wyoming's average weekly wage increased from $1,177 to $1,215 ($37, or 3.2%).
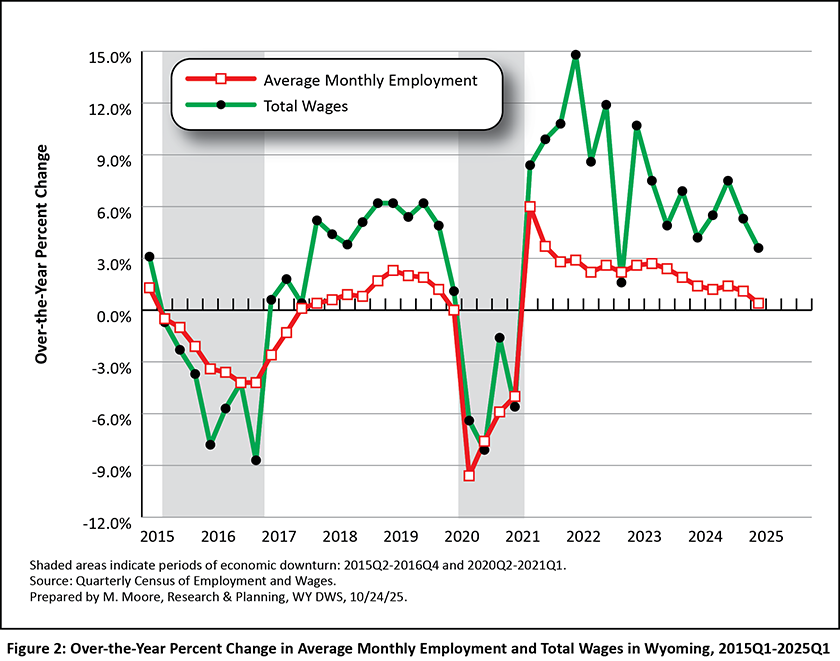
The shaded areas in the figures in this article represent periods of economic downturn. The Research & Planning (R&P) section of the Wyoming Department of Workforce Services has defined an economic downturn as a period of at least two consecutive quarters of over-the-year decreases in average monthly employment and total wages based on data from the QCEW. Wyoming has endured three such economic downturns since 2009: 2009Q1 to 2010Q1, 2015Q2 to 2016Q4, and 2020Q2 to 2021Q1 (see Figure 2). Wyoming’s most recent downturn was influenced by the COVID-19 pandemic and declines in the prices of and demand for the state’s energy resources. While each downturn had its own unique circumstances, declining energy prices preceded all three (Moore, 2019).
Industries
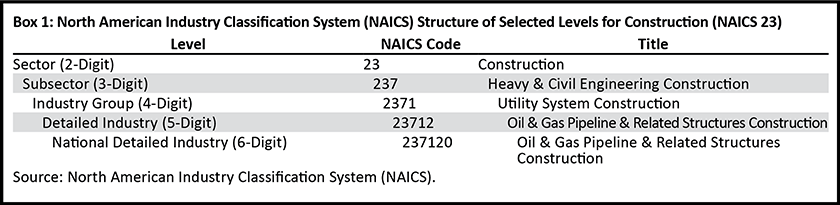
Industries are organized by the North American Industry Classification System (NAICS). A sample of the NAICS hierarchal structure for construction (NAICS 23) can be found in Box 1. This section discusses statewide employment and wages at the sector (or two-digit NAICS) level.
The greatest over-the-year job growth was seen in wholesale trade, transportation, & utilities, with 432 new jobs, an increase of 2.1% (see Table 3). Other industries with notable over-the-year job growth included construction (426, or 2.0%); manufacturing (143, or 1.4%); other services, except public administration (131, or 1.8%); and health care & social assistance (48, or 0.2%). The greatest over-the-year job losses were seen in mining, including oil & gas (-540, or -3.3%); private educational services (-155, or -6.4%); and professional & business services (-48, or -0.2%).
Local government (including schools and hospitals) accounted for the largest share (17.2%) of Wyoming's total employment in 2025Q1. Local government comprises employment and wages in Wyoming's counties, cities, towns, school districts, community colleges, tribal governments, and other municipalities. Other industries that accounted for substantial shares of employment included leisure & hospitality (12.8%), retail trade (10.8%), health care & social assistance (9.6%), and construction (7.7%).
Wyoming employers paid $4.3 billion in total wages in 2025Q1, an over-the-year increase of $149.8 million, or 3.6%. The greatest over-the-year increases in wages were seen in financial activities ($52.1 million, or 21.4%); local government ($24.8 million, or 3.8%); wholesale trade, transportation, & utilities ($15.8 million, or 4.0%); and manufacturing ($10.2 million, or 5.0%). Total wages in mining (including oil & gas) fell by $7.0 million, or 1.6%.
Local government contributed the greatest share (15.5%) of all wages, followed by professional & business services (10.5%); mining, including oil & gas (10.1%); and wholesale trade, transportation, & utilities (9.6%).
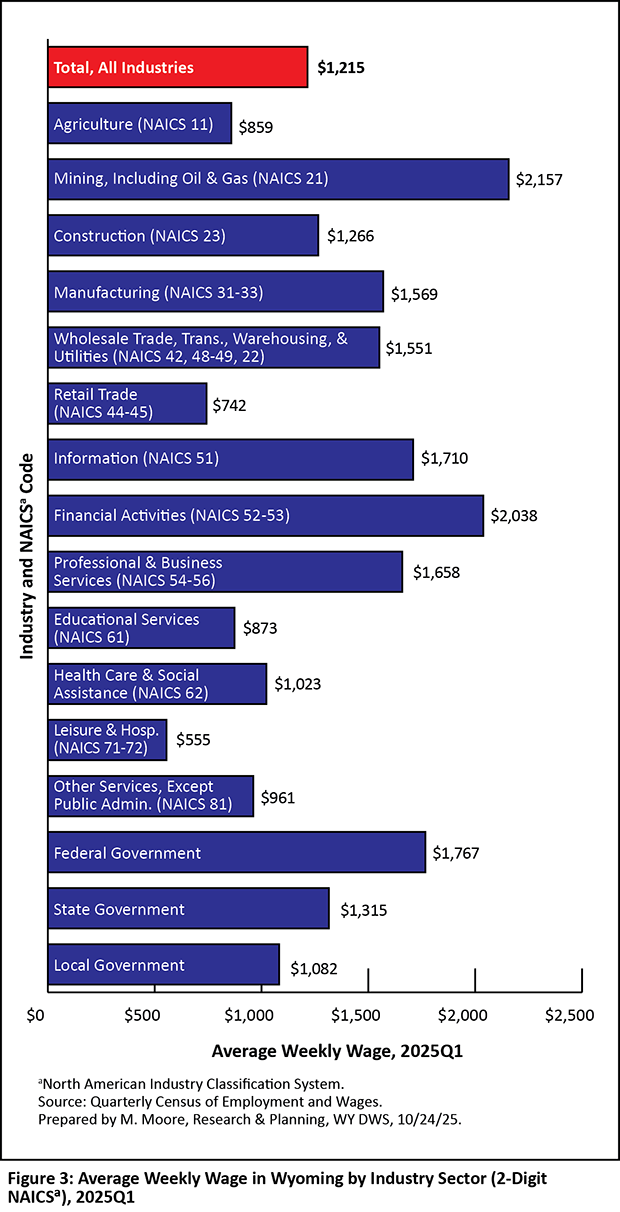
Wyoming's average weekly wage in 2025Q1 was $1,215 (see Figure 3). The highest average wages were seen in mining, including oil & gas ($2,157); financial activities ($2,038); federal government ($1,767); information ($1,710); professional & business services ($1,658); and manufacturing ($1,569). The industries with the lowest wages were leisure & hospitality ($555), retail trade ($742), and agriculture, forestry, fishing, & hunting ($859).
County
Over-the-year job growth occurred in 11 of Wyoming's 23 counties, while job losses were seen in 12 (see Table 4). Laramie County added the greatest number of jobs (942, or 2.0%), followed by Natrona (392, or 1.0%), Sheridan (288, or 2.1%), Big Horn (174, or 4.4%), and Albany (149, or 0.9%). The counties that lost jobs over the year included Campbell (-455, or -1.8%), Sweetwater (-289, or -1.4%), Park (-279, or -2.2%), and Carbon (-104, or -1.7%).
Many of the counties with the greatest over-the-year growth in total wages were the same that experienced the greatest over-the-year job growth including Laramie ($42.5 million, or 5.9%), Sheridan ($12.0 million, or 6.1%), and Natrona ($11.7 million, or 2.0%). Teton County, despite minimal job growth (35, or 0.2%) had the second highest increase in total wages ($37.8 million, or 8.0%).
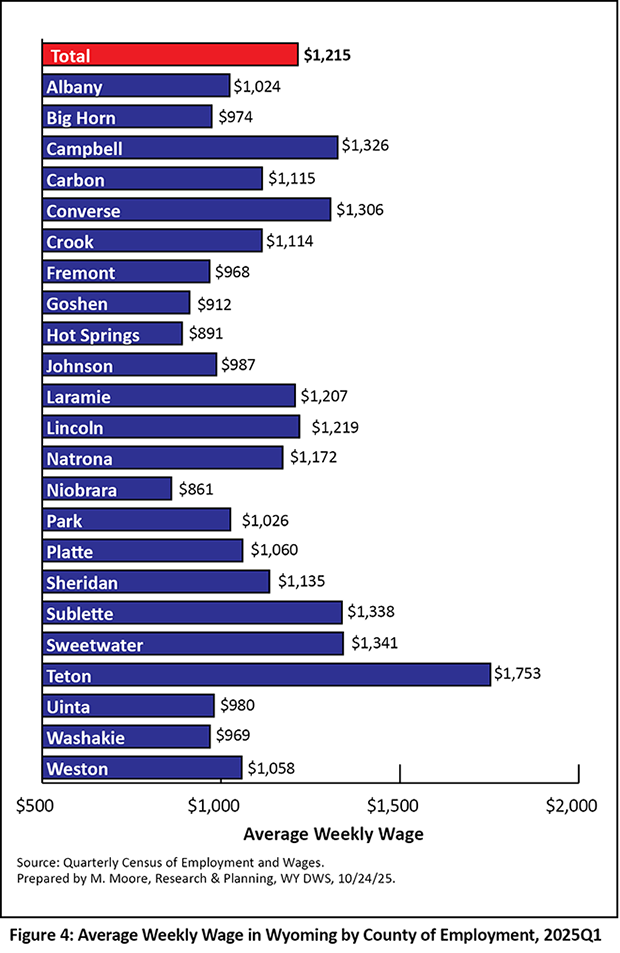
Teton County had the highest average weekly wage ($1,753), due in part to especially high wages in industries like management of companies & enterprises and financial activities (Research & Planning, 2025). Many of the other counties with high wages were those with relatively large numbers of mining-related jobs, such as Sweetwater ($1,341), Sublette ($1,338), Campbell ($1,326), and Converse ($1,306; see Figure 4). Niobrara County, Wyoming’s least populous county, had the state’s lowest average weekly wage ($861).
Post-Pandemic Changes
This section of the article compares employment and wage data from 2020Q1 to 2025Q1, in order to understand employment trends in selected industries and counties since the pandemic, and to determine where employment stands compared to pre-pandemic levels. For this article, the term post-pandemic refers to the period from 2021Q2 to 2025Q1. As previously mentioned, Wyoming’s most recent economic downturn resulted in part from of the Covid-19 pandemic and lasted from 2020Q2 to 2021Q1.
Industry
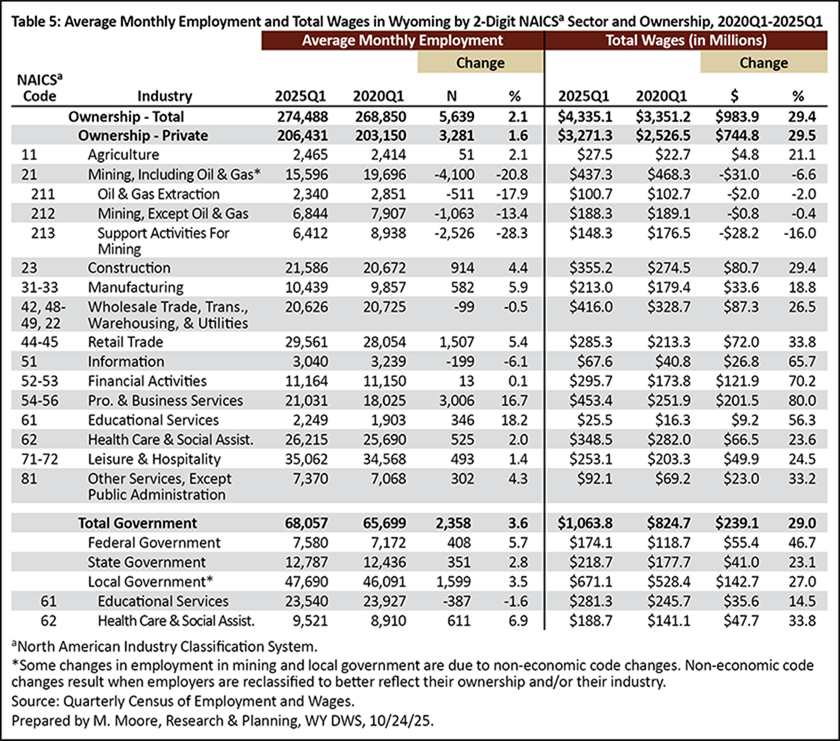
From 2020Q1 to 2025Q1, Wyoming’s average monthly employment increased from 268,850 to 274,488, an addition of 5,639 jobs, or 2.1% (see Table 5). The greatest growth was seen in professional & business services (3,006 new jobs, or 16.7%), local government (1,559, or 3.5%), retail trade (1,507, or 5.4%), and construction (914, or 4.4%). Substantial job losses were seen in mining, including oil & gas (-4,100, or -20.8%) and local government educational services (local school districts; -387, or -1.6%).
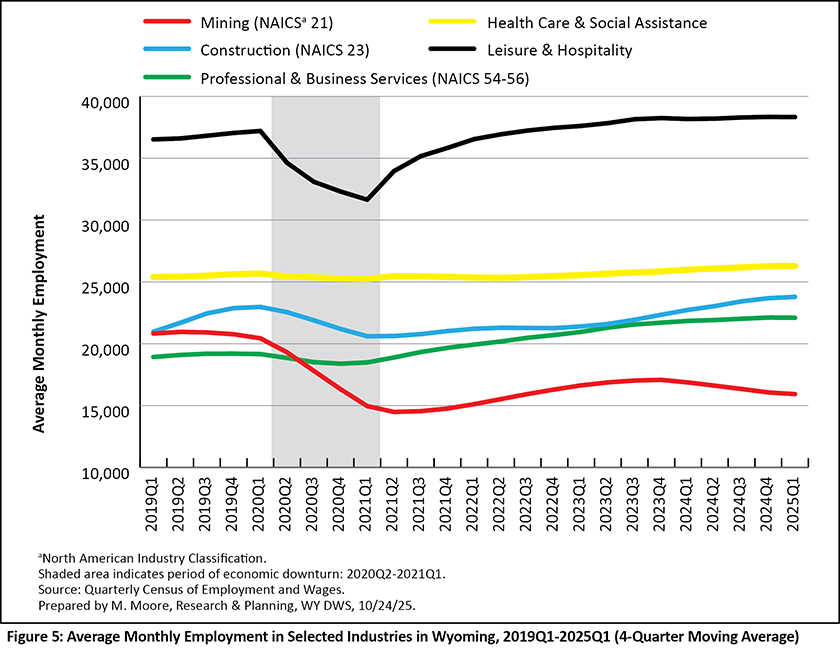
Figure 5 shows average monthly employment for five key industries in Wyoming: mining (including oil & gas), construction, professional & business services, health care & social assistance, and leisure & hospitality. Figure 5 uses four-quarter moving averages in order to identify trends in employment. Historical data for each industry are available at https://doe.state.wy.us/LMI/QCEW_OTY/toc.htm.
The black line in Figure 5 represents leisure & hospitality, which saw unprecedented job losses during the pandemic and associated economic downturn from 2020Q2 to 2021Q1. According to Moore (2021), leisure & hospitality lost more than 10,000 jobs (more than one in four jobs) from 2019Q2 to 2020Q2. After the pandemic, job gains in leisure & hospitality continued for an extended period, peaking at an all-time high of 43,655 in 2024Q3.
The yellow line in Figure 5 represents private health care & social assistance. Unlike other industries, employment in health care & social assistance remained relatively steady during the most recent downturn, partially because of the need for health care workers during the pandemic. Employment in this industry moderately increased after the pandemic, exceeding 26,000 during each quarter from 2023Q4 to 2025Q1.
Construction is represented by the blue line in Figure 5. Employment in construction increased during 2019 and then dropped during the economic downturn, with over-the-year job losses during each quarter from 2020Q2 to 2021Q1. After the economic downturn, construction saw continuous over-the-year job growth from 2021Q2 to 2025Q1, with the exception of small job losses in 2022Q3 and 2022Q4. Throughout 2023 and 2024, construction drove job growth in Wyoming.
Mining (including oil & gas) is a key component of Wyoming's economy, and is represented by the red line in Figure 5. Wyoming's mining sector experienced substantial job losses during the most recent economic downturn. Mining lost nearly 4,500 jobs from 2019Q4 to 2021Q1, nearly one-third of all jobs in this industry. Moderate job growth was seen in mining through 2023, before job losses resumed in 2024. It is worth noting that at least some of the employment change seen in mining in 2024 was due to non-economic code changes and not actual job losses (Moore, 2024).
Finally, the green line in Figure 5 represents professional & business services, which is made up of professional & technical services, management of companies & enterprises, and administrative & waste services. Professional & business services was relatively unaffected by the recent downturn, and has seen constant job growth since. Employment peaked at 23,098 in 2024Q3, the highest in this industry's history.
County
From 2020Q1 to 2025Q1, employment increased in 15 counties and decreased in eight. The counties with the greatest job gains included Teton (2,049, or 10.0%), Laramie (1,736, or 3.7%), Albany (1,350, or 8.7%), and Sheridan (1,038, or 7.9%). The counties with the greatest job losses included Converse (-953, or -13.2%), Sweetwater (-880, or -4.2%), Carbon (-602, or -9.2%), and Campbell (-566, or -2.3%). Most of the counties that lost jobs from 2020Q1 to 2025Q1 had relatively high concentrations of mining employment.
Teton County saw job growth across several industries, including construction, administrative & waste services, professional & technical services, and arts, entertainment, & recreation.
In Laramie County, more than half of all new jobs from 2020Q1 to 2025Q1 were seen in one of two industries: construction and professional & technical services. Job growth also was seen in administrative & waste services and arts, entertainment, & recreation.
Job gains in federal government and state government education drove employment growth in Albany County. Within the private sector, job gains were seen in professional & technical services, retail trade, and construction.
In Converse County, mining accounted for approximately half of all job losses. Notably, mining lost nearly half of its total jobs in mining from 2020Q1 to 2025Q1. Employment decreases also were seen in construction and administrative & waste services.
Sweetwater County lost nearly 800 jobs in mining, which was partially offset by job gains in retail trade. Job losses were also seen in local schools and private accommodation & food services.
Finally, Carbon County lost jobs in mining, accommodation & food services, and construction, particularly heavy & civil engineering construction.
Conclusion
First quarter 2025 marked the 16th consecutive quarter of over-the-year job growth in Wyoming. However, it is worth noting that the over-the-year increase of 0.4% was the lowest rate since 2020Q1 prior to the Covid-19 pandemic.
Several industries have seen sustained job growth since the most recent economic downturn, including professional & business services, local government, retail trade, and construction. The counties that have seen the greatest job growth since the downturn include Teton, Laramie, Albany, and Sheridan.
References
Moore, M. (2019, May). Chapter 1: Introduction — Driven by demographics and downturns: Wyoming’s 2018 labor market at a glance. 2019 Wyoming Workforce Annual Report. Research & Planning, WY DWS. Retrieved October 29, 2025, from https://tinyurl.com/426yehdh
Moore, M. (2021, January). 2020Q2 quarterly update: Covid-19 pandemic forces historic job losses in 2020Q2. Wyoming Labor Force Trends, 58(1). Retrieved October 29, 2025, from https://doe.state.wy.us/LMI/trends/0121/0121.pdf
Moore, M. (2024, October). 2024Q1 quarterly update: Wyoming jobs, total wages grow for 12th consecutive quarter. Wyoming Labor Force Trends, 61(10). Retrieved October 29, 2025, from https://doe.state.wy.us/LMI/trends/1024/a1.htm
Research & Planning. (2025a, May). Wyoming Quarterly Census of Employment and Wages — Teton County. Retrieved October 29, 2025, from https://doe.state.wy.us/LMI/25Q1_QCEW/t24.htm
 Hire Wyo
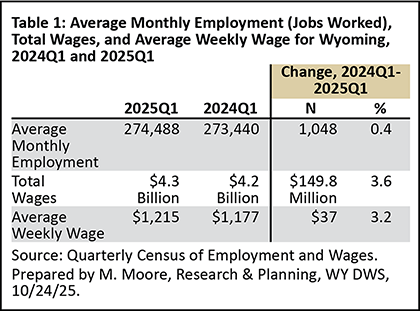