Wyoming Labor Force Trends
November 2023 | Volume 60, No. 11
Click Here for PDF
Return to Table of Contents
Labor Market Churn in the U.S. and Wyoming
by: David Bullard, Senior Economist
Labor market churn is the sum of hires and separations (quits, layoffs, discharges, or other separations) across the economy. The amount of churn is much higher than the net job gains reported each month. Normally, when the economy is growing, hires are greater than separations. When compared to the U.S., Wyoming tends to have greater hire and separation rates, which is likely because the state has many seasonal industries, such as leisure & hospitality and construction.
Each month the Current Employment Statistics (CES) program reports on the number of new jobs created in the U.S. This figure represents the number of net new jobs, or in other words, the number of new jobs minus the number of job losses.
Another way of looking at the labor market is by examining job losses and job gains separately. The Job Openings and Labor Turnover Survey (JOLTS) program produces estimates of the number of hires and the number of total separations each month. Total separations are defined as “all employees separated from [their employers’] payroll during the month.” Total separations includes employees who quit, those who are laid off, those who are fired, and those who retire or die (BLS, 2023).
Using the month of May 2023 for an example shows that the CES program reported a net gain of 281,000 jobs nationally (seasonally adjusted over-the-month change in total nonfarm employment). Separately, the JOLTS program estimates indicated that there were 6,231,000 hires and 5,925,000 total separations.
Subtracting JOLTS estimates of total separations from hires indicates net job growth (according to JOLTS) of 306,000 jobs. While the CES estimates do no exactly match those from JOLTS, they are close, and there are several reasons why one should not expect them to match. First, the reference periods for the two surveys are different. The CES program has a reference period of the pay period of the 12th of the month. On the other hand, the JOLTS reference period for hires and total separations is the entire calendar month. Additionally, both programs produce estimates from sample-based surveys of employers, and therefore the estimates are subject to sampling error.
Again, while the estimates do not match, they are similar in magnitude. It is important to note that the number of hires and the number of separations each month are much larger than the net change. In other words, there is a lot more movement in the labor market each month than is reflected in the net new jobs estimate produced by the CES program.
Churn in the labor market is defined as hires plus total separations. It represents the movement in and out of employment. This article focuses on the churn rate and breaks it down into its component parts for the U.S. and Wyoming.
Figure 1 shows the churn rate and the unemployment rate for the U.S. from December 2000 to July 2023. During the Great Recession (December 2007 to June 2009) it is clear that unemployment increased and churn decreased (NBER, 2023). The U.S. unemployment rate rose from 4.4% in May 2007 to 10.0% in October 2009 and churn fell from 8.1 in September 2005 to 6.0 in June 2009. During recessions, churn typically falls as employers hire fewer people and workers tend to stay put and not change jobs. During times of strong economic growth, churn usually increases. The pandemic period looks different from earlier recessions and from expansions, because both churn and unemployment increased. The churn rate shot up to 14.2 in March 2020 and the unemployment rate rose to 14.7% in April 2020.
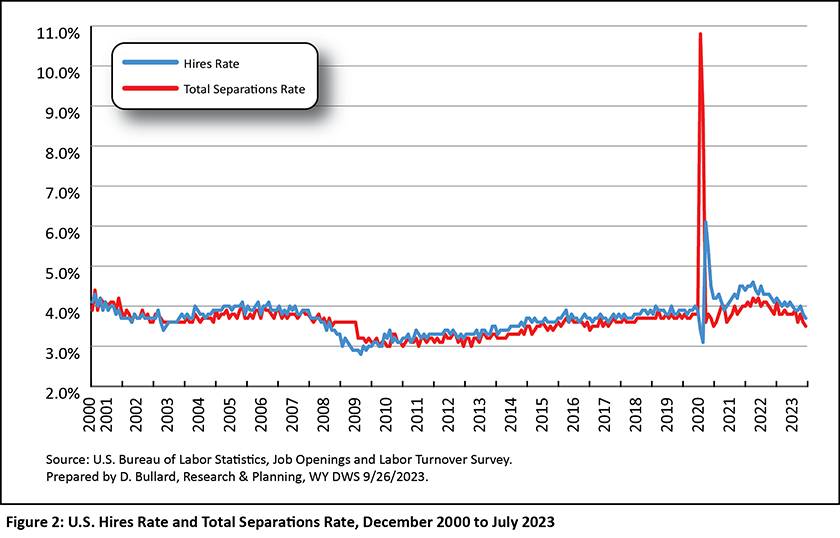
Figure 2 breaks out the churn rate into its two components: the hires rate and the total separations rate. During most of the time shown in the figure, hires exceeded total separations. This indicates that employment was growing. However, every month from April 2008 to October 2009, the total separations rate was greater than the hires rate and employment fell. During and following the Great Recession, the CES program estimated that approximately 8.7 million jobs were lost.
Similarly, during the height of the Covid-19 pandemic, the total separations rate rose to 10.8 in March 2020 and the hire rate very briefly fell to 3.1 in April 2020.
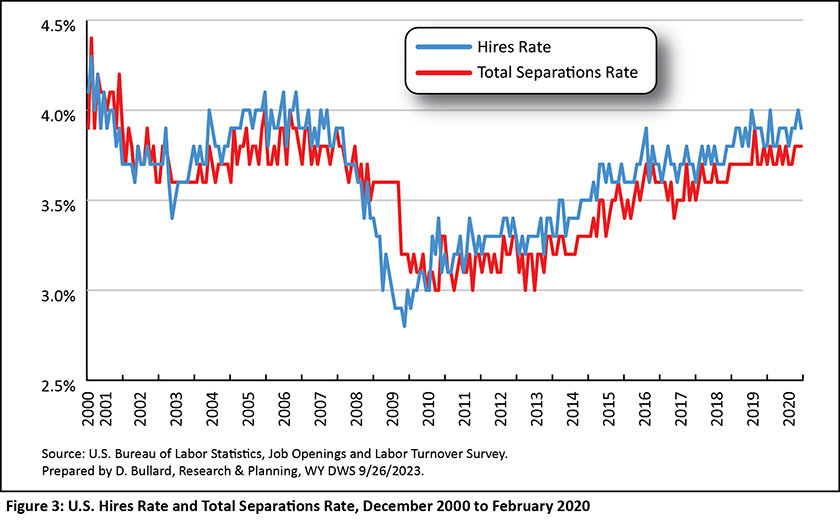
In order to get a close-up view of hires and separations, Figure 3 is limited to the pre-pandemic period. It is remarkable how closely these two series move, and how most of the time hires exceed total separations. The Great Recession stands out in the graph as the hires rate trended downward, but the total separations rate held steady at 3.6 for nine months of 2008 and 2009.
Total separations are broken out into the quits rate, layoffs & discharges rate, and the other separations rate in Figure 4. The BLS (2023) defines quits as “employees who left voluntarily, with the exception of retirements or transfers to other locations.” Layoffs & discharges “includes involuntary separations initiated by the employer, such as layoffs, ... discharges resulting from mergers, downsizing, or closings; firings or other discharges for cause; terminations of permanent or short-term employees; and terminations of seasonal employees (whether or not they are expected to return the next season).” Other separations is a very small category. It includes “retirements, transfers to other locations, separations due to employee disability; and deaths.”
For most of the period shown in Figure 4, the quits rate is higher than the layoffs & discharges rate. The exceptions are the Great Recession and a few months during the pandemic. This suggests that when the economy is growing, it is more likely that an employee will quit, rather than being laid off. The other separations rate appears very low and stable during the entire period, ranging from 0.2 to 0.3.
Figure 5 focuses on the pre-pandemic period and shows that the quits rate generally increased from 2010 to early 2020. When the economy is growing, workers are more willing to quit their jobs because they believe they can easily find other employment. The layoffs and discharges rate decreased from a peak of 2.0 in April 2009 to 1.1 in January 2019.
How does Wyoming compare to the U.S. in terms of labor market churn and its components? Figure 6 shows the unemployment rate and the churn rate for Wyoming. When comparing Figure 1 to Figure 6, there are both similarities and differences. In both charts, the unemployment rate peaked during the Great Recession and the pandemic. One key difference is the rise in Wyoming’s unemployment rate in 2015-2016. While the U.S. unemployment rate steadily decreased from 2009 to early 2020, Wyoming’s jobless rate rose in 2016 because of a decrease in energy prices and a slowdown in the state’s economy.
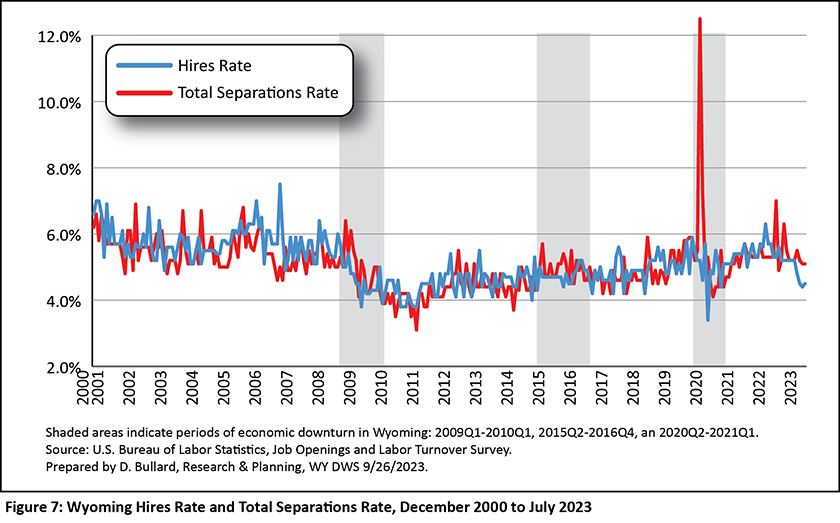
Wyoming’s hires rate and total separations rate are shown in Figure 7. One feature that differs between Wyoming (Figure 7) and the U.S. (Figure 2) is that between 2012 and 2019, Wyoming’s total separations rate was often higher than the state’s hires rate. When total separations are greater than hires, employment decreases. As noted earlier, Wyoming’s economy went through a period of job losses in 2015 and 2016, with large layoffs in the natural resources & mining sector.
Figure 8 focuses on the pre-pandemic period. Comparing Wyoming (Figure 8) to the U.S. (Figure 3) reveals that Wyoming has both a greater total separations rate than the U.S. and a greater hires rate than the U.S. Wyoming’s total separations rate ranged from 3.1 to 6.9, while the corresponding U.S. rate ranged from 3.0 to 4.2. Similarly, Wyoming hires rate ranged from 3.8 to 7.5 while the U.S. rate ranged from 2.8 to 4.1.
Detailed, industry-level JOLTS data are published for the U.S., but are not available for Wyoming, so it is not possible to make comparisons between Wyoming and the U.S. at the industry level. However, one might guess that Wyoming has higher total separations and hires rates because of the highly seasonal industries in the state, such as leisure & hospitality and construction. All else equal, states with large seasonal industries will likely have more hires and total separations during the course of a year. It is also possible that the age distribution of a state’s labor force could affect turnover measures such as hires and separations. It would seem reasonable that young people would have less job attachment and higher turnover than prime-age workers.
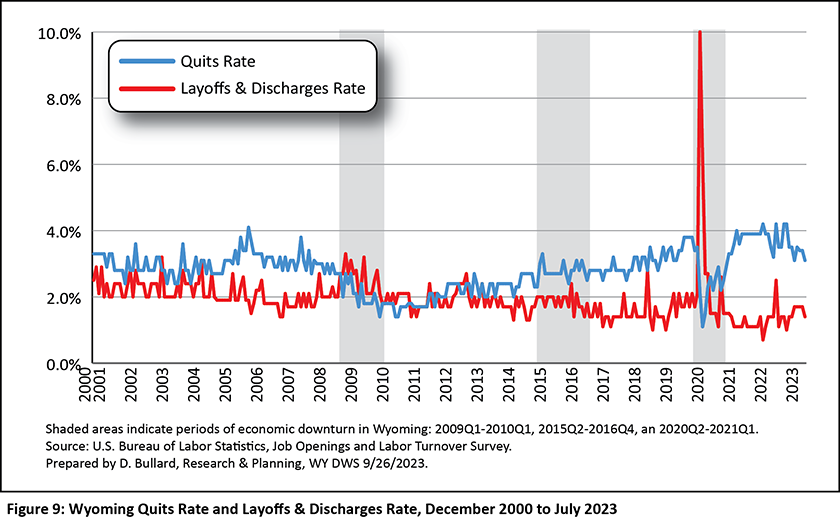
Wyoming’s total separations rate is broken out into the quits rate and the layoffs & discharges rate in Figure 9. Data on other separations are not available for Wyoming. Wyoming’s quits rate ranged from 1.1 to 4.2, which is higher than the U.S. quits rate, which ranged from 1.2 to 3.0. Wyoming’s quits rate seems to generally follow the same pattern as the U.S. quits rate, trending upward from 2010 to 2022.
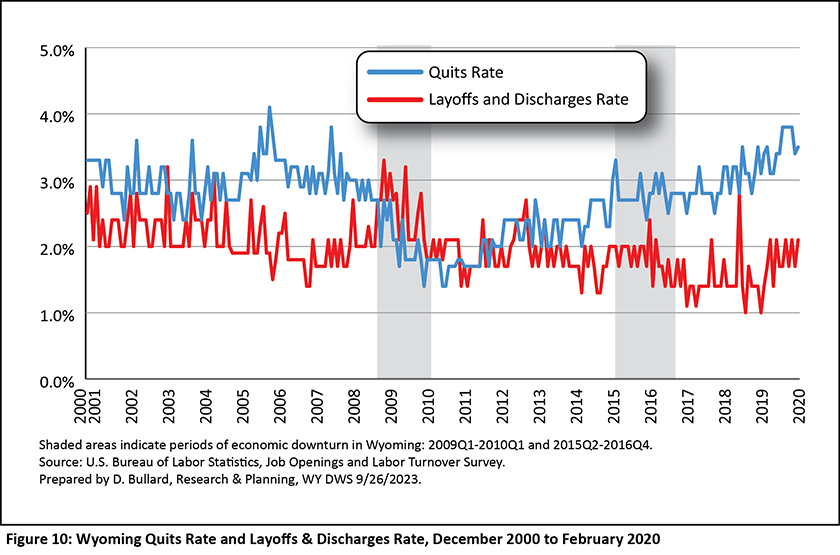
Figure 10 focuses on the pre-pandemic period in Wyoming and is similar to Figure 5. Wyoming’s quits rate hit its highest point in November 2005, when Wyoming’s economy was expanding rapidly. Wyoming’s layoffs & discharges rate reached its highest point in December 2008 when energy prices had fallen steeply.
Conclusion
In summary, the amount of churn in the labor market is much larger than the net job gains reported every month. Churn is the sum of hires and total separations. When the economy is growing hires exceed separations. Separations can be broken out into quits, layoffs & discharges, and other separations. Most of the time, quits are higher than any other type of separations.
Wyoming’s hires rate and its quits rate have been generally higher than the corresponding U.S. rates. This could be related to the many highly seasonal industries (such as leisure & hospitality and construction) that are found in Wyoming. It is also possible that differences in hires rates and quits rates could be related to the age structure of Wyoming’s labor force.
References
National Bureau of Economic Research. (2023). U.S. business cycle expansions and contractions. Retrieved September 27, 2023, from https://www.nber.org/research/data/us-business-cycle-expansions-and-contractions
U.S. Bureau of Labor Statistics. (2023). Job Openings and Labor Turnover. Retrieved September 27, 2023, from https://stats.bls.gov/news.release/pdf/jolts.pdf

 Wyoming at Work
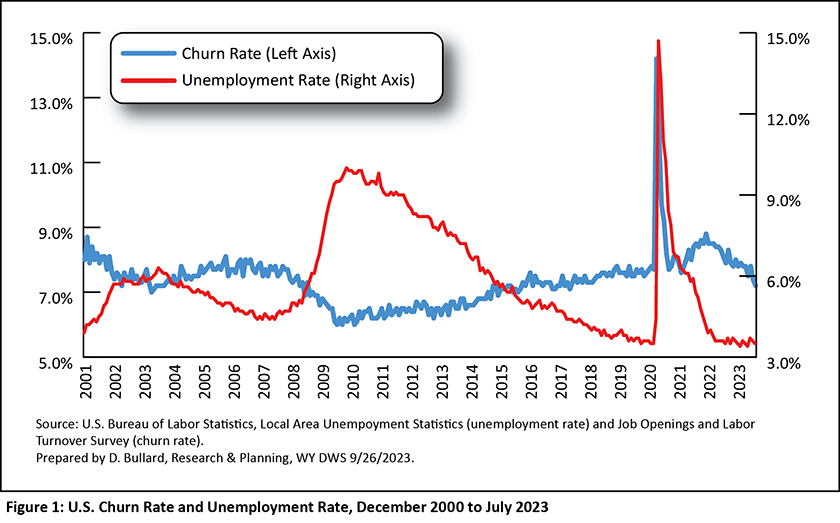