Wyoming Labor Force Trends
November 2022 | Volume 59, No. 11
Click Here for PDF
Return to Table of Contents
Wyoming’s Changing Retail Trade Sector, 2001-2021
Abstract: Wyoming’s retail trade industry peaked at 32,168 jobs in 2008 and has experienced ups and downs over the last 20 years. This article looks at changes in Wyoming’s retail trade industry by subsector from 2001 to 2021.
by: David Bullard, Senior Economist
Introduction
Wyoming’s retail trade industry peaked at 32,168 jobs in 2008 and has experienced ups and downs over the last 20 years. This article looks at changes in Wyoming’s retail trade industry by subsector from 2001 to 2021.
Wyoming’s retail trade sector has been through a number of changes in the past two decades. Overall employment has moved up and down, and the types of retailers have changed as well. Some of these shifts are the result of expansion and contraction in Wyoming’s economy, while others reflect changing tastes or new technology.
This article reviews total retail employment and breaks it down into 12 subsectors. The NAICS 2017 classification system is used throughout this article. All employment data in this article are annual averages. The 20-year change in employment for each subsector is presented in Table 1 at the end of this article.
Results
Figure 1 shows that retail employment peaked at 32,168 jobs in 2008. Then, as the state’s economy faltered during the Great Recession, the number of retail jobs fell in 2009 and 2010 and hit a low point of 29,195 jobs in 2011. It is hard to overstate the importance of the energy sector to Wyoming’s economy, and therefore Figure 1 includes the Baker Hughes rig count for the state. The rig count is the number of oil & gas drilling rigs operating in the state, and can be seen as a measure of energy activity. When the rig count is high, Wyoming’s economy tends to do well.
Retail employment seems to follow the rig count with a lag. The rig count peaked in 2006, and then retail employment peaked two years later in 2008. The rig count hit a low point in 2009-2010 at 40 rigs, and retail employment reached a low in 2011. The rig count increased to 54 in 2014 and retail employment peaked the following year. Retail employment has also been affected by the COVID-19 pandemic that began in 2020, and this is seen clearly in certain subsectors.
After all the ups and downs, total retail employment in Wyoming ended 2021 with 599 fewer jobs (-2.0%) than in 2001. Of the 12 retail subsectors, seven lost jobs, while five added jobs.
Motor Vehicle & Parts Dealers (NAICS 441)
Figure 2 shows employment at motor vehicle & parts dealers. This subsector is made up of new and used car dealers, auto parts stores, recreational vehicle dealers, and tire stores. With 4,244 jobs in 2021, this is one of the larger retail subsectors in Wyoming. Similar to total retail trade, employment peaked in 2007 and again in 2015. Motor vehicle & parts dealers gained 115 jobs (2.8%) between 2001 and 2021.
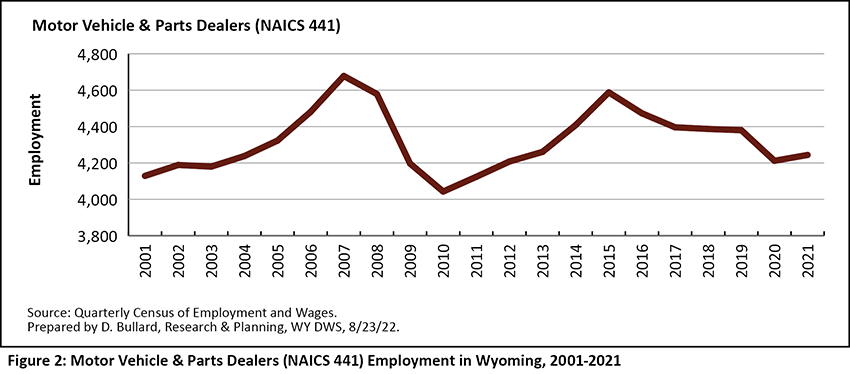
Furniture & Home Furnishings Stores (NAICS 442)
Employment in furniture & home furnishing stores is illustrated in Figure 3. This subsector contains furniture stores, mattress stores, floor covering stores, and kitchenware stores. Employment peaked in 2008 and then decreased. From 2001 to 2021, employment fell by 59 jobs, or 8.0%.
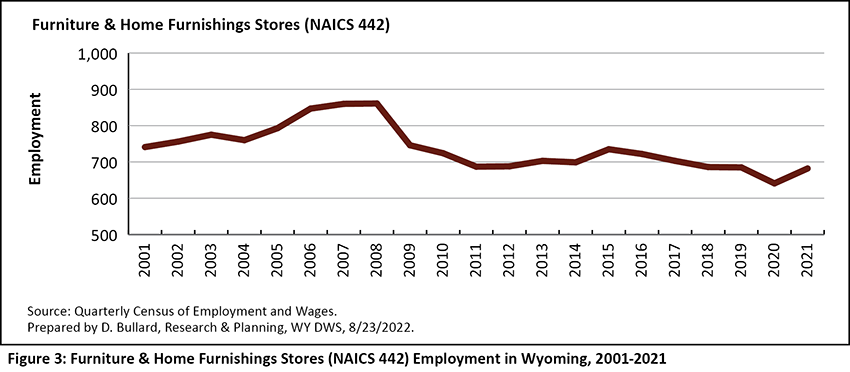
Electronics & Appliance Stores (NAICS 443)
Figure 4 shows employment in electronics & appliance stores. This relatively small subsector includes household appliance stores, computer stores, cellular telephone stores, camera stores, and other electronic stores. From 2001 to 2011, employment rose by 430 jobs, and then from 2011 to 2021, employment fell by 359 jobs. This left the subsector with a net gain of 71 jobs (12.1%) from 2001 to 2021. The decreasing employment from 2011 to 2021 could be the result of consumers buying electronics from online retailers rather than from stores physically located in Wyoming.
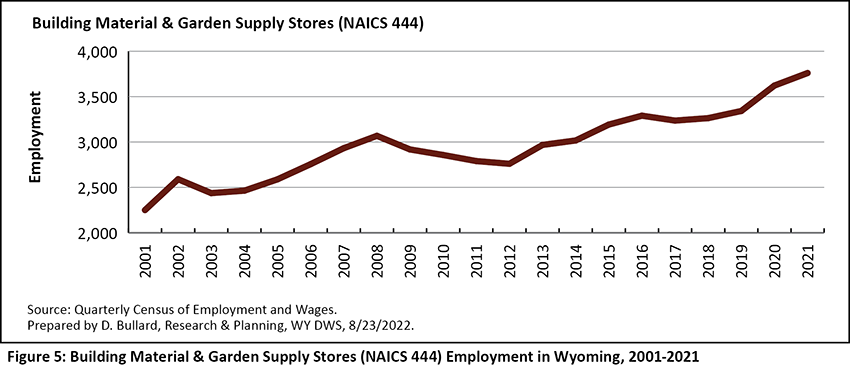
Building Material & Garden Supply Stores (NAICS 444)
Employment in building material & garden supply stores has generally increased over the past two decades, rising from 2,250 jobs in 2001 to 3,760 jobs in 2021 (see Figure 5). This subsector includes hardware stores, home centers, building material dealers, and nursery, garden & farm supply stores. In an environment where total retail employment fell, this subsector clearly stands out. It grew by 1,510 jobs, or 67.1%. Part of its growth in recent years is likely related to the pandemic. While some retail subsectors lost jobs in 2020, building material & garden supply stores continued to add jobs as more people worked on home improvement projects.
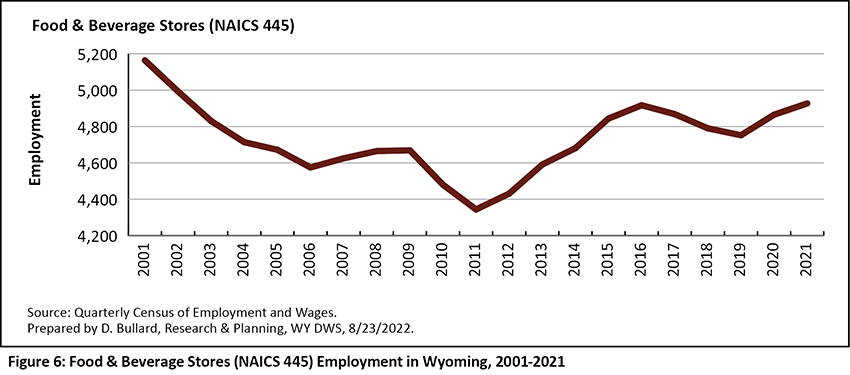
Food & Beverage Stores (NAICS 445)
Figure 6 shows employment trends in food & beverage stores. From 2001 to 2021, employment fell by 237 jobs, or 4.6%. Supermarkets, grocery stores, liquor stores, and specialty food stores (such as meat markets) are all included in this subsector. Part of the employment decrease in food & beverage stores may be related to growth of supercenters, which stock both groceries and general merchandise. Supercenters are classified in general merchandise stores (see Figure 11). It is also possible that employment has fallen as retailers have adopted new technologies, such as self-checkout machines.
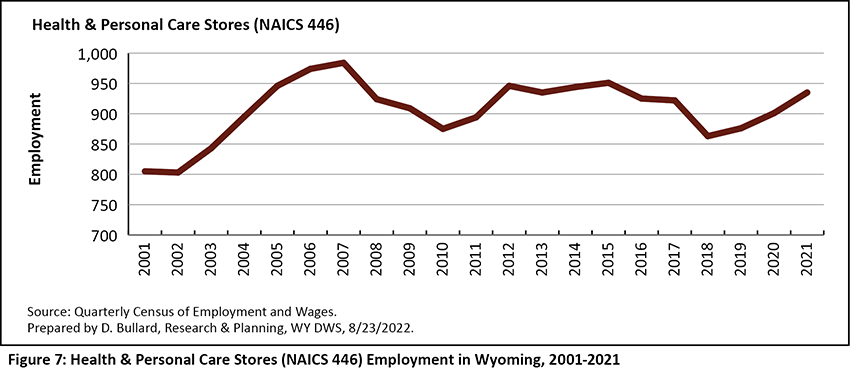
Health & Personal Care Stores (NAICS 446)
Employment in health & personal care stores rose from 805 jobs in 2001 to 935 jobs in 2021 (an increase of 130 jobs, or 16.1%; see Figure 7). This subsector is made up of pharmacies, drug stores, cosmetic and beauty supply stores, hearing aid stores, and vitamin and supplement stores. Increasing employment may be a function of an aging population that requires more health-related goods and services.
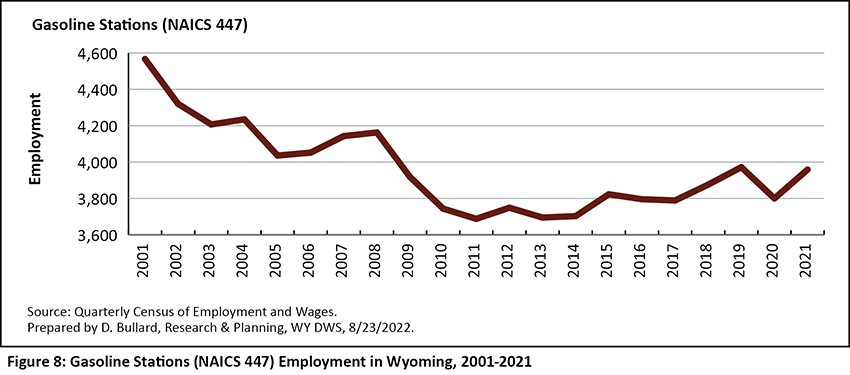
Gasoline Stations (NAICS 447)
Figure 8 illustrates the general downward trend in employment at gasoline stations in Wyoming. Between 2001 and 2021, employment fell by 608 jobs, or 13.3%. In recent years, gas pumps have appeared both at grocery stores and at warehouse clubs and supercenters. To the extent that consumers are buying gasoline at other types of retailers, the associated employment will be included there as well. In other words, gasoline station employment shown in Figure 8 is for stand-alone gasoline stations only. Employment at gasoline stations that operate as part of grocery stores is reported as grocery store employment and included in Figure 6. Technology that allows consumers to pay at the pump may have had a negative impact on employment at gasoline stations.
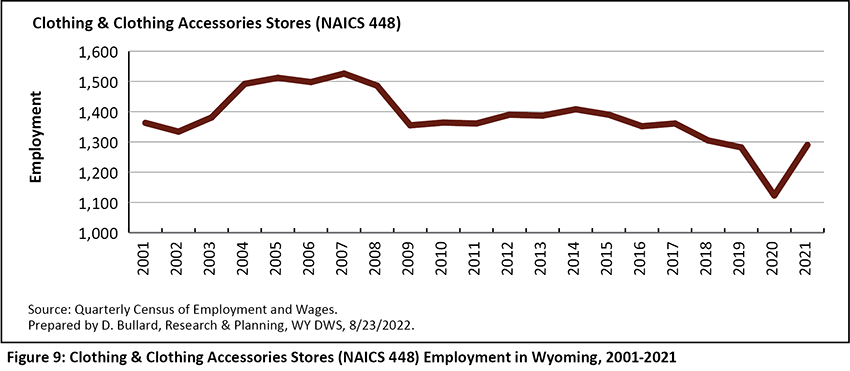
Clothing & Clothing Accessories Stores (NAICS 448)
Figure 9 shows employment at clothing & clothing accessories stores. Employment at these types of stores hit a peak of 1,526 jobs in 2007 and then fell to a low point of 1,123 jobs in 2020. From 2020 to 2021, employment rose sharply as retailers recovered from pandemic job losses. This subsector is made up of shoe stores, clothing stores, jewelry stores, and luggage stores. From 2001 to 2021, employment fell by 73 jobs, or 5.4%.
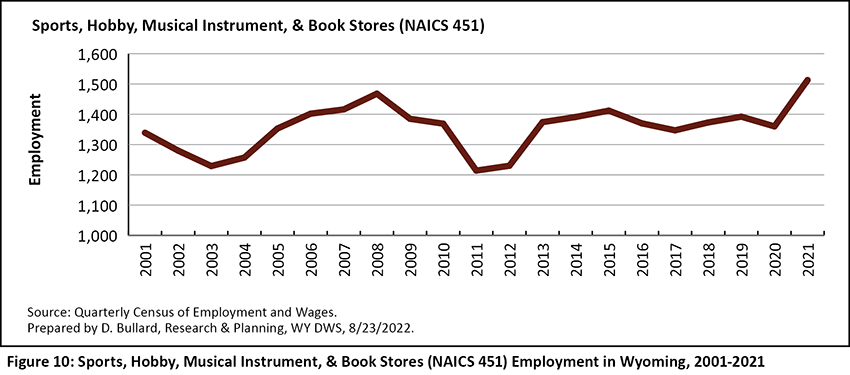
Sports, Hobby, Musical Instrument, & Book Stores (NAICS 451)
Employment in sports, hobby, musical instrument, & book stores hit high points in 2008 and 2021 (see Figure 10). The sharp increase in 2021 may reflect strong sales of sporting goods during the pandemic. From 2001 to 2021, this subsector gained 174 jobs (13.0%).
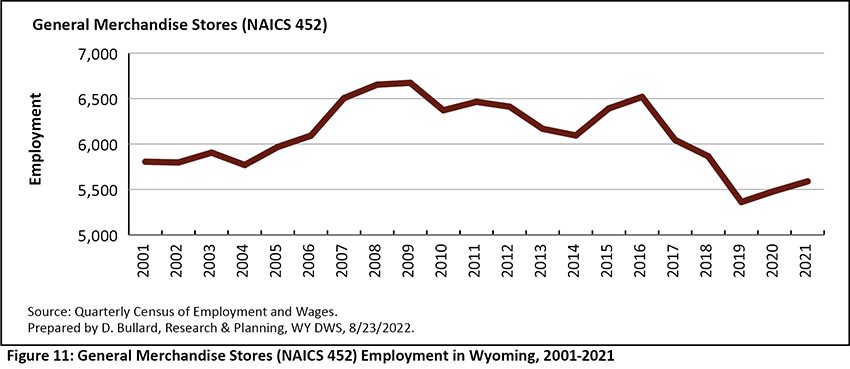
General Merchandise Stores (NAICS 452)
Figure 11 shows employment trends at general merchandise stores. This subsector is comprised of department stores, warehouse clubs & supercenters, dollar stores and other retailers that stock a wide variety of merchandise. It appears that the steep decline in employment from 2016 to 2020 may have been the result of job losses at department stores (NAICS 4522), or the downturn in Wyoming’s coal mining industry. In contrast to the decline in employment seen in Wyoming (down 216 jobs, or 3.7% from 2001 to 2021), national employment in this subsector increased 8.4% over the same period. By their very nature, general merchandise stores compete with many other types of retailers. For example, clothing is sold both at clothing stores and at department stores, food is sold both at grocery stores and at warehouse clubs & supercenters, and electronics are sold both at electronics stores and at warehouse clubs & supercenters.
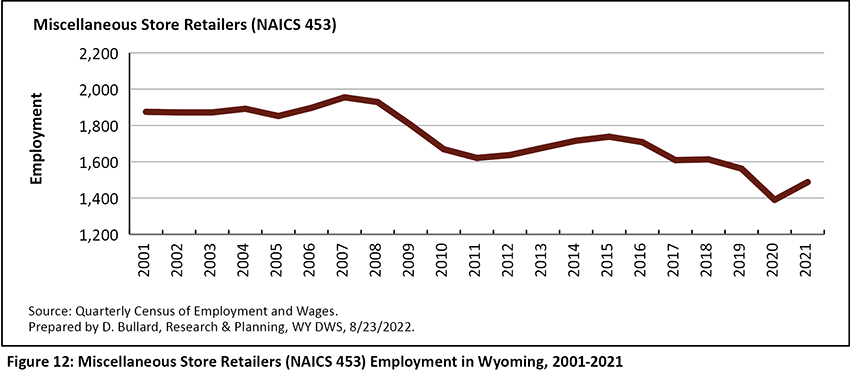
Miscellaneous Store Retailers (NAICS 453)
Miscellaneous store retailers includes office supply stores, pet stores, flower shops, thrift shops, tobacco stores, mobile home dealers, fireworks stores, and art galleries. From 2001 to 2021, employment decreased by 387 jobs, or 20.6% at these types of stores (see Figure 12).
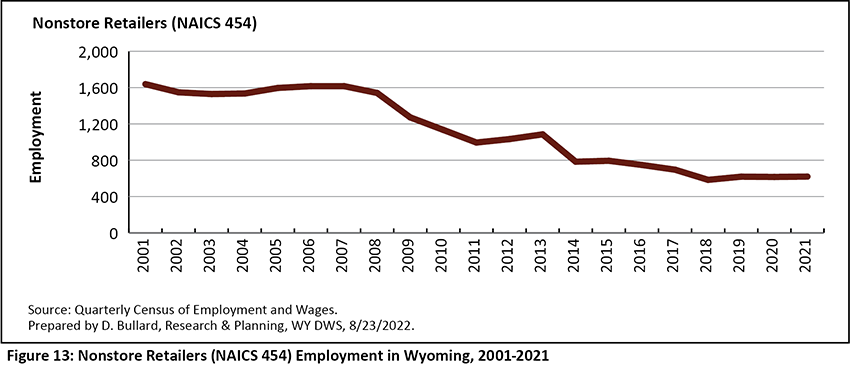
Nonstore Retailers (NAICS 454)
Figure 13 shows that employment in nonstore retailers fell from 2001 to 2021. This category includes online retailers, catalog retailers, and other types of retailers that do not sell out of a storefront, such as companies that sell goods door-to-door. The decreasing employment in Wyoming nonstore retailers is in direct contrast to national trends. While Wyoming employment fell by 62.1%, U.S. employment rose by 32.1%. Employment in distribution centers and warehouses operated by online retailers is sometimes classified in warehousing & storage (NAICS 493), which is not a part of the retail trade sector. Incidentally, Wyoming employment in warehousing & storage increased by 1,909 jobs between 2001 and 2021.
Conclusion
Wyoming’s retail sector has experienced both ups and downs in the past two decades with overall employment falling from 2001 to 2021. The building material & garden supply stores subsector added the most jobs, followed by sports, hobby, musical instrument, & book stores; health & personal care stores; and motor vehicle & parts dealers. Large job losses were seen in nonstore retailers, gasoline stations, and miscellaneous store retailers. Some of the decline in retail employment in the state may be related to increasing competition from internet retailers located outside of Wyoming.


 Wyoming at Work
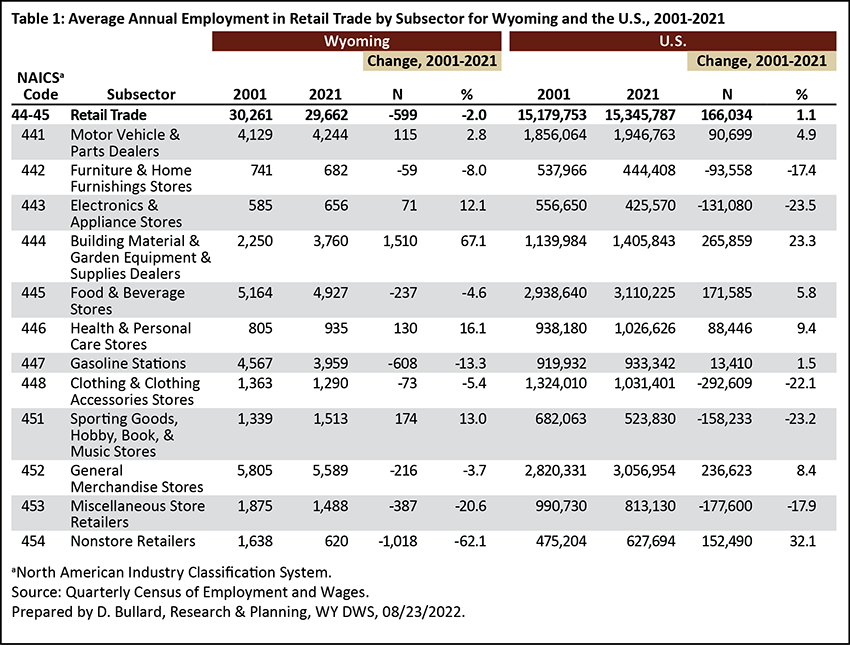