Wyoming Labor Force Trends
October 2025 | Volume 62, No. 10
Click Here for PDF
Return to Table of Contents
Tracking Youth into Wyoming's Labor Market: 2025 Update
by: Tony Glover, R&P Manager
The departure of young workers is a topic of major interest to Wyoming residents, policymakers, educators, training providers, employers, jobseekers, and others. This article updates prior research looking at just how many high school seniors were found working in Wyoming up to 10 years after their senior year. In addition, a related article of this issue of Trends looks at the departure of millenials from Wyoming's workforce.
The Research & Planning (R&P) section of the Wyoming Department of Workforce Services has published a variety of articles and datasets that track the state's youth into the labor market. Most recently, “Another Decade Later: Tracking Wyoming's High School Seniors Into Post-secondary Education and the Labor Market” (Glover and Moore, 2021) followed seniors in Wyoming’s secondary educational system into post-secondary education and the labor force over the course of a decade.
This article continues the research published in “Another Decade Later” by tracking high school seniors from 2010/2011 to 2023/2024 into Wyoming’s labor market. This article does not include data on postsecondary education, which is conducted by the Statewide Longitudinal Education Data System (SLEDS) program.
The current research examines 14 senior cohorts as identified from the Wyoming Department of Education (WDE) enrollment records captured in the WDE684 data. The WDE684 file contains data about the students but does not include social security numbers (SSN), which are needed to match the seniors to Wyoming’s Wage Records database. Data for 18-year-old high school seniors in the WDE684 were linked to other R&P data to obtain an SSN. The data were matched on first name, last name, sex, and date of birth. R&P matched 89.9% of the seniors to an SSN (see Table 1).
The calculations presented in this article were prepared by R&P and may differ from those prepared by the WDE.
The WDE684 data were then matched to wage records on the SSN. The wage records were aggregated to one record per school year. For example, the 2010/11 school year comprised third and fourth quarter 2010 and first and second quarter 2011. The primary industry (the industry paying the most wages) and total wages were assigned for each SSN and school year.
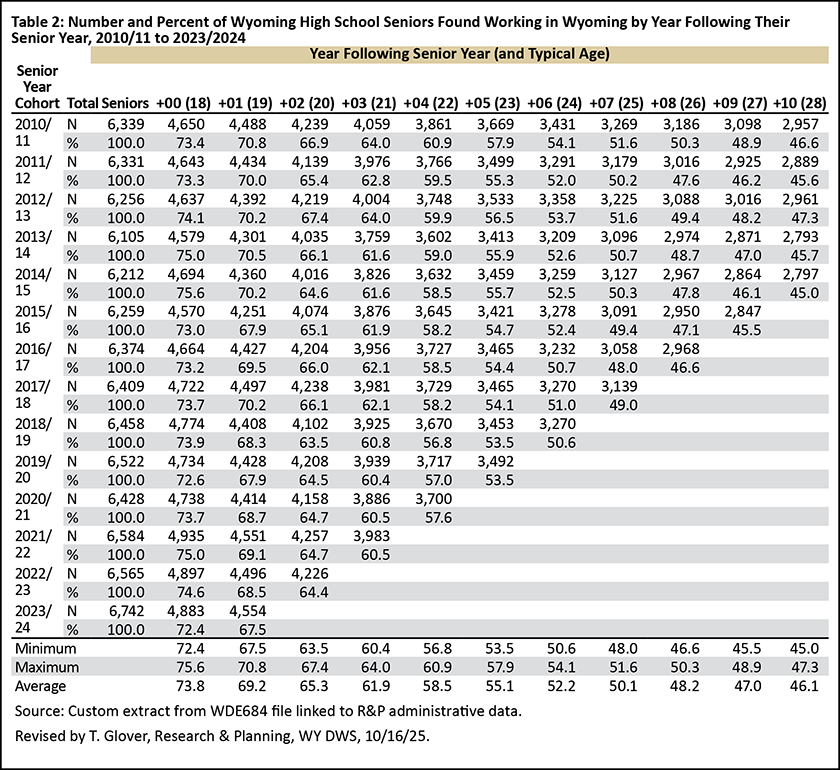
The number of seniors working in Wyoming tended to be highest during their senior year, and then decreased each following year (see Table 2). The senior year participation rate (number of seniors working divided by the total number of seniors) ranged from 72.4% for 2023/24 to 75.6% for 2014/15, with an average of 73.8% across all 14 cohorts.
A five-year retention rate of seniors (number of seniors working in Wyoming five years after their senior year divided by the original total number of seniors) was available for 10 cohorts (2010/11 to 2019/20). The five-year retention rate ranged from a low of 53.5% for 2018/19 and 2019/20 to 57.9% for 2010/11. The average five-year retention rate for all 10 cohorts was 55.1%.
The 10-year retention rate was calculated by dividing the number of seniors working in Wyoming 10 years after their senior year by the original total number of seniors, and was available for five cohorts (2010/11 to 2014/15). The highest 10-year retention rate was 47.3% for 2012/13, and the lowest was 45.0% for 2014/15. The average 10-year retention rate was 46.1%.
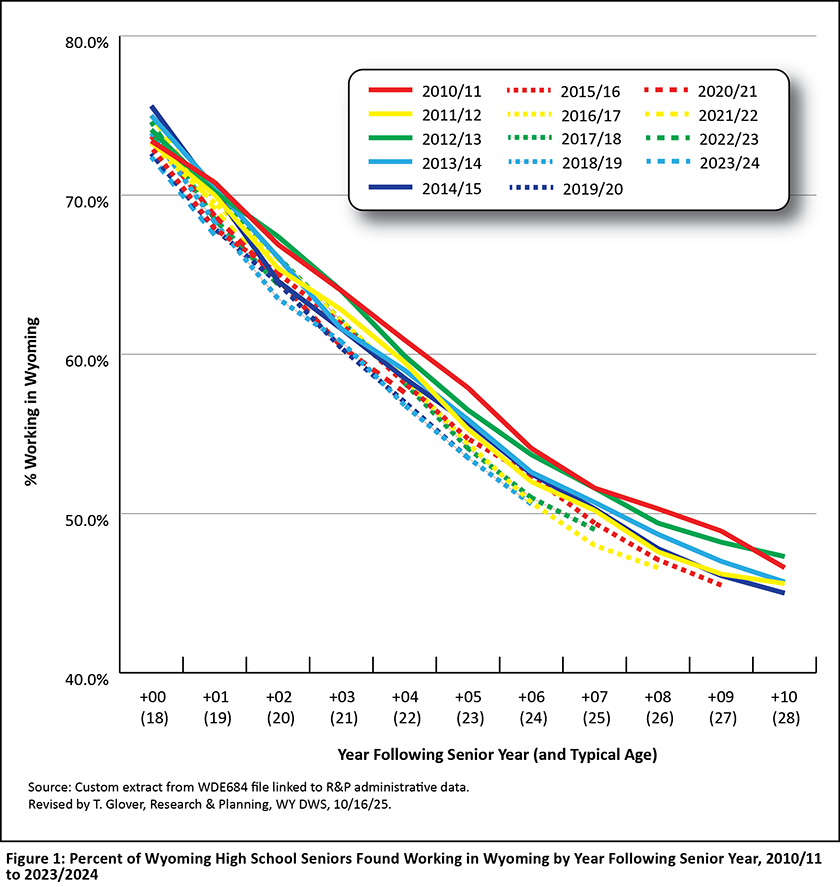
As illustrated in Figure 1, all 14 cohorts followed the same general pattern: they peaked during the senior year and then decreased each year after. For example, 73.4% of 2010/11 high school seniors worked in Wyoming, which then fell to 70.8% the next year. Of the 2023 seniors, 72.4% worked in Wyoming, which then decreased to 67.5% the next year.
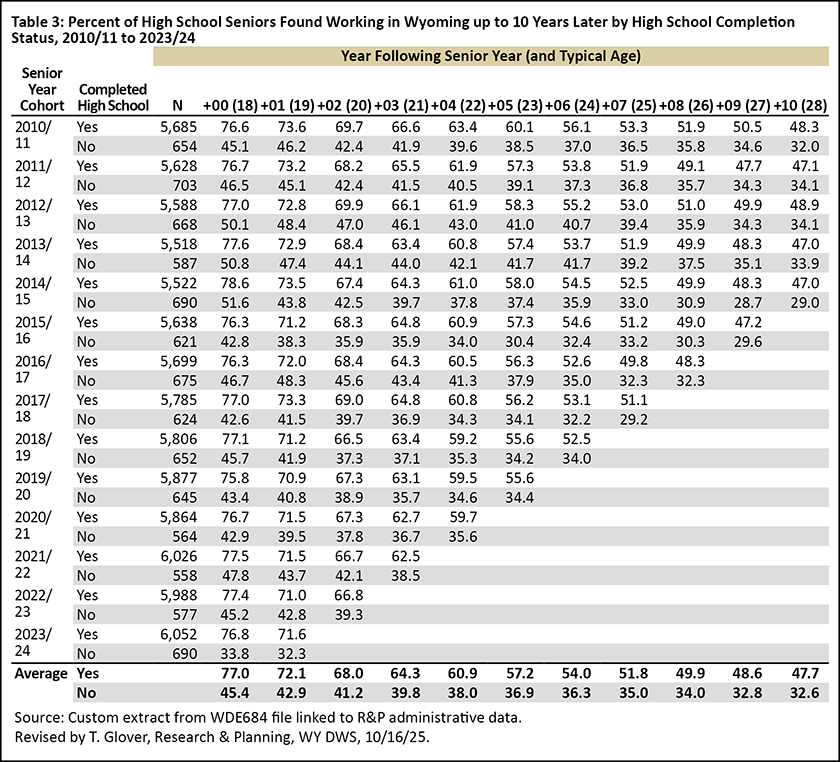
Table 3 is similar to Table 2, but adds high school graduation status. The average labor force participation rate during the senior year for 2010/11 to 2023/24 for graduates was 77.0%, compared to 45.4% for non-graduates. The average five-year participation rate was 57.2% for graduates and 36.9% for non-graduates. The average 10-year participation rate was 47.7% for graduates and 32.6% for non-graduates. The low retention rate for non-graduates could be because the senior left the state before graduation.
The average annual wages of graduates and non-graduates working in Wyoming are shown in Table 4 and are adjusted to the 2024 Consumer Price Index (CPI). During each year beginning with the senior year, graduates had higher wages than non-graduates from all cohorts. By the 10th year after graduation, the average annual wage for graduates was $51,493, compared to $38,562 for non-graduates.
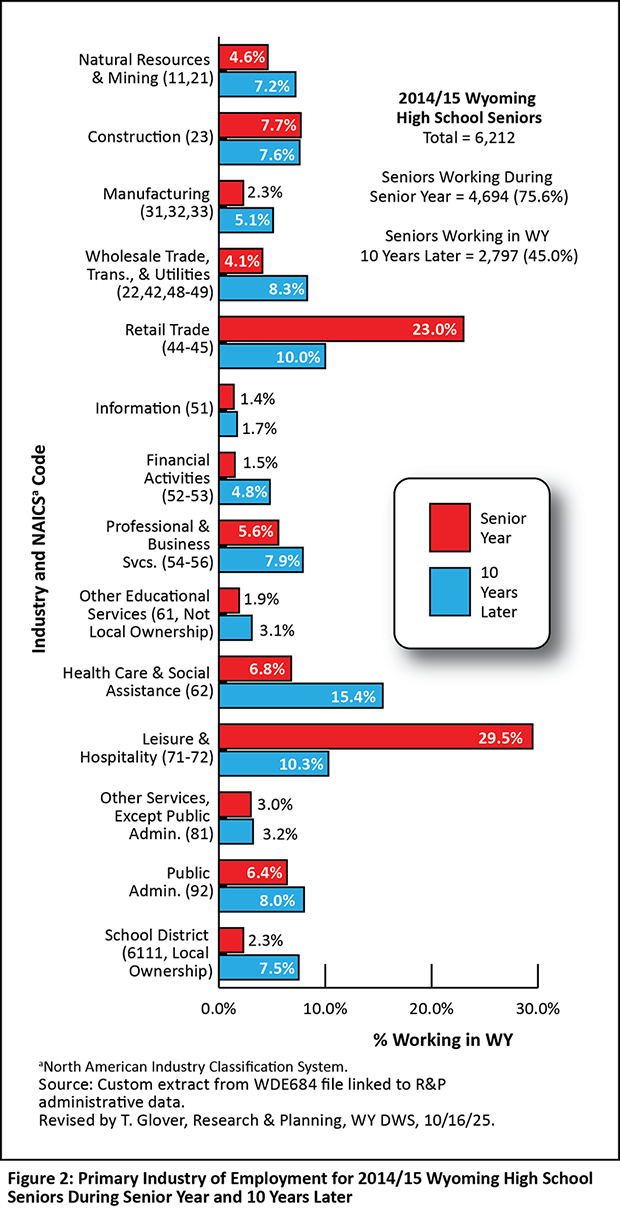
Figure 2 shows the percent distribution of the 2014/15 cohort by industry in their senior year and 10 years later. During their senior year, there was a high concentration of employment in industries like leisure & hospitality (29.5%) and retail trade (23.0%). For those still working in Wyoming 10 years later, employment was more evenly distributed, with more of a concentration in health care & social assistance (15.4%).
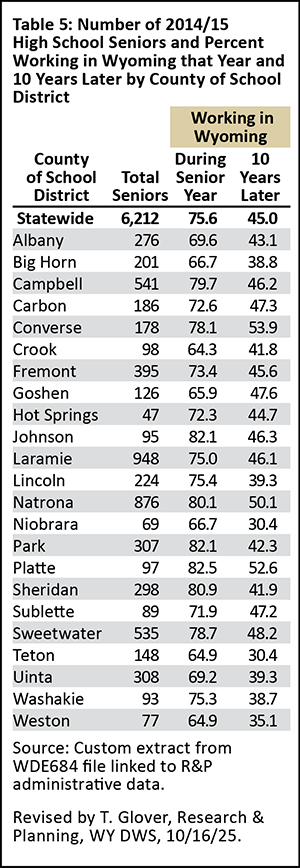
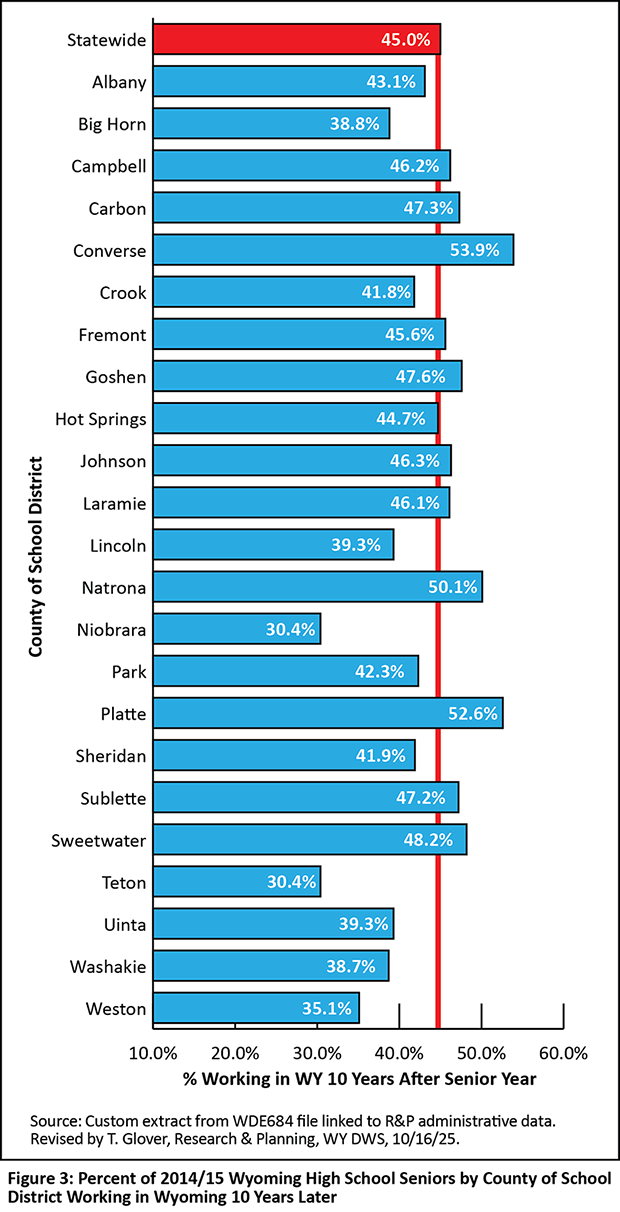
The 10-year retention rates varied by school district. Table 5 shows the total number of 2014/15 seniors by the county in which their school district was located, along with the percentage working their senior year and 10 years later. During the senior year, Platte County had the highest participation rate (82.5%), while Crook County had the lowest (64.3%). Ten years later, Converse and Platte counties had the highest participation rates (53.9% and 52.6%, respectively), while Teton and Niobrara counties had the lowest (30.4% each; see Figure 3).
The departure of youth from Wyoming’s labor market is nothing new. The 14 cohorts discussed in this article all followed the same general trend, with an average of 55.1% of high school seniors working in Wyoming five years later, and 46.1% working in Wyoming 10 years later.
The five- and 10-year retention rates discussed in this article were similar to those presented in “A Decade Later” (Glover and Moore, 2012), which used different methodology to track students into the labor force but still found similar patterns. In “A Decade Later,” Glover noted that among Wyoming 18-year-olds from 1992 to 2006, the average five- and 10-year retention rates were 55.8% and 43.8%, respectively.
There was little variation among each cohort of high school seniors in terms of those working in Wyoming during their senior year and the five- and 10-year retention rates. For example, 73.4% of the 2010/11 class worked during their senior year, compared to 72.4% of the 2023/24 class. The five- and 10-year retention rates for the 2010/11 seniors were 57.9% and 46.6%, respectively. The 2014/15 class had similar retention rates of 55.7% and 45.0%.
References
Glover, T., and Moore, M. (2012, March). A decade later: Tracking Wyoming’s youth into the labor force. Research & Planning, WY DWS. Retrieved September 16, 2025, from https://doe.state.wy.us/LMI/w_r_research/A_Decade_Later.pdf
Glover, T., and Moore, M. (2021, September). Another decade later: Tracking Wyoming's high school seniors into post-secondary education and the labor market. Research & Planning, Wyoming DWS. Retrieved September 16, 2025, from https://doe.state.wy.us/LMI/Another_Decade_Later.pdf
 Hire Wyo
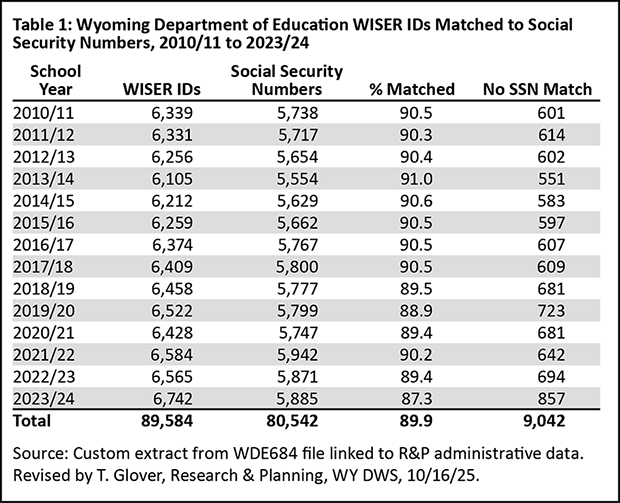