Wyoming Labor Force Trends
September 2026 | Volume 63, No. 9
Click Here for PDF
Return to Table of Contents
2025Q4 Quarterly Update
Wyoming Employment Drops Again in Fourth Quarter
by: Michael Moore, Research Supervisor
This article provides an overview of Wyoming’s employment and wages in fourth quarter 2025 at the county and industry levels. Despite consecutive quarters of over-the-year job losses, the last two quarters of 2025 are unlikely to mark the start of a new economic downturn.
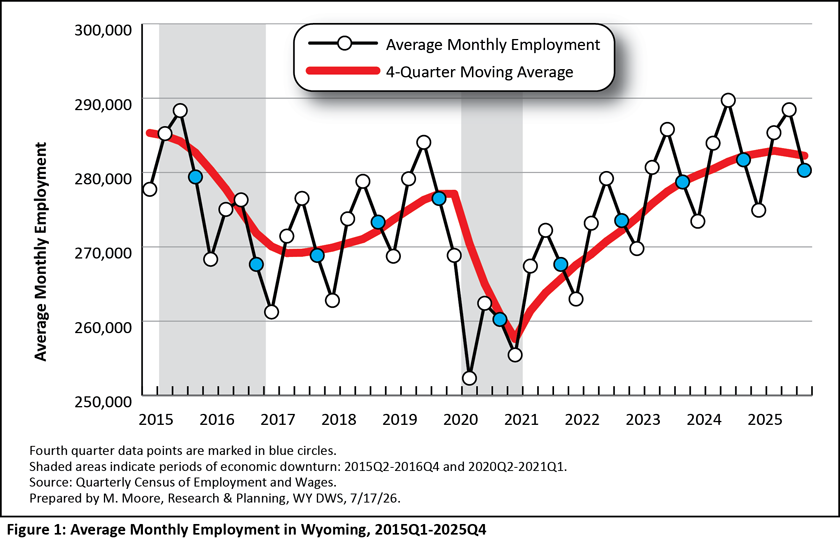
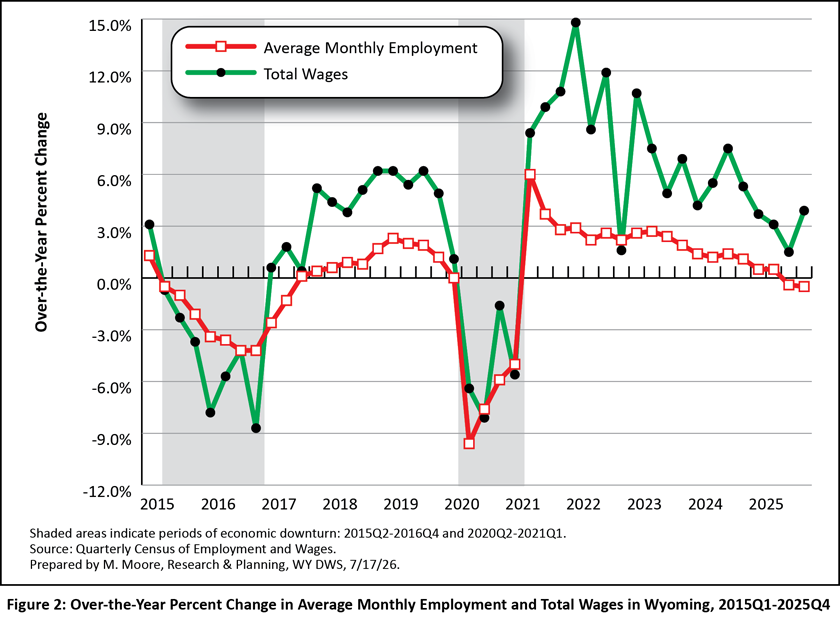
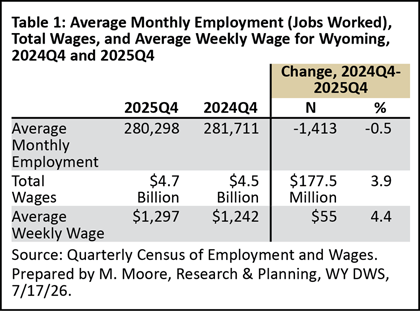
Wyoming's average monthly employment fell from the prior year in fourth quarter 2025 (2025Q4), marking the second consecutive quarter of minimal over-the-year job losses. Prior to 2025Q3, Wyoming employment had increased over the year for 17 consecutive quarters dating back to 2021Q2 (see Figure 1 and Figure 2). Wyoming lost more than 1,400 jobs from 2024Q4 to 2025Q4, a decrease of 0.5% (see Table 1). However, total wages increased by $177.5 million (3.9%), and the state's average weekly wage increased by $55, or 4.4%.
Job losses in Wyoming are typically seen during periods of economic downturn, which the Research & Planning (R&P) section of the Wyoming Department of Workforce Services has defined as a period of at least two consecutive quarters of over-the-year decreases in average monthly employment and total wages based on data from the Quarterly Census of Employment and Wages (QCEW).
Wyoming has faced three such economic downturns over the last 16 years: 2009Q1 to 2010Q1, 2015Q2 to 2016Q4, and 2020Q2 to 2021Q1 (see Figure 2). Each downturn was preceded by declining energy prices (Moore, 2021), but all three also had their own unique circumstances. These periods of downturn are indicated by shaded boxes in the figures presented with this article.
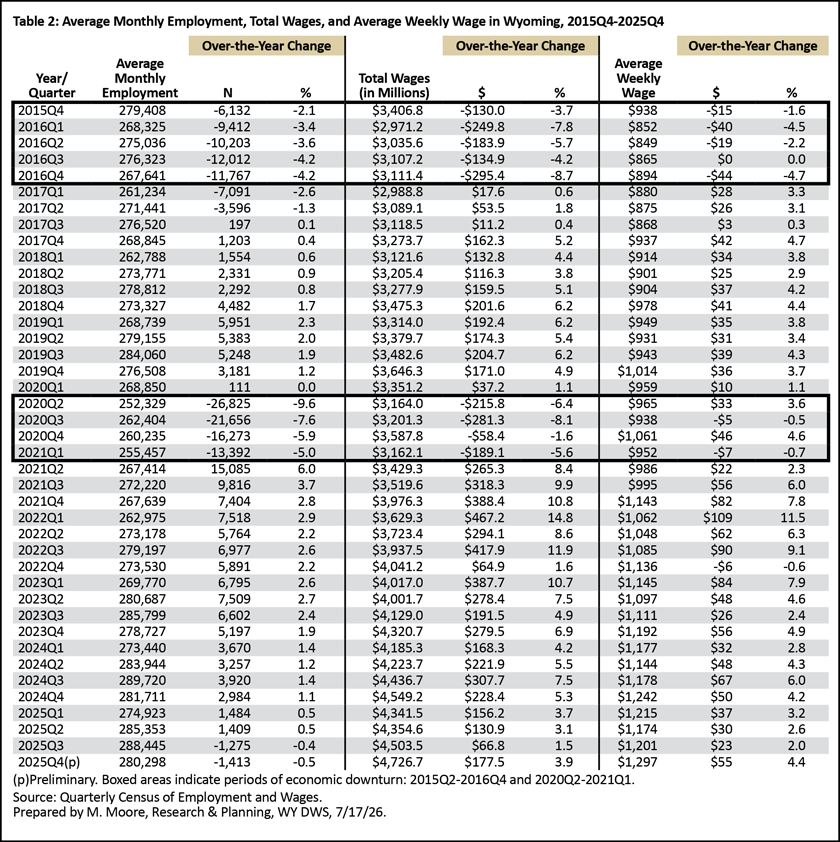
Although 2025Q4 marked the second consecutive quarter of over-the-year job losses, this period does not meet the definitions of an economic downturn, since total wages continued to increase. During each of the previous three downturns, declines in employment and wages began in the same quarter; despite job losses of approximately half a percent in 2025Q3 and 2025Q4, total wages increased by 1.5% and 3.9%, respectively (see Table 2). Preliminary data for 2026Q1 show this trend continuing, with approximately 715 jobs lost (-0.3%) and an increase of $243.4 million (5.6%) in total wages. In addition, non-seasonally adjusted estimates from the Current Employment Statistics program indicate job gains in Wyoming during the first six months of 2026 (see the figure titled, "Wyoming nonagricultural wage and salary employment"). Bullard (2026) noted that in June 2026, Wyoming employment increased by 2,500 jobs (0.8%) compared to June 2025.
Each prior downturn began due to a significant event: the U.S. Great Recession in 2007, large scale layoffs and job losses in Wyoming's energy sector in 2015, and the Covid-19 pandemic in 2020. Such an event has not happened nationally or locally prior to the most recent job losses.
Over-the-year job losses were not unique to Wyoming in 2025Q4. Job losses also were seen in surrounding states such as Colorado (-0.5%), Montana (-0.2%), and Nebraska (-0.2%). Idaho (1.7%) and Utah (1.5%) both added jobs, while employment was unchanged (0.0%) in South Dakota. Average monthly employment for the U.S. increased by 0.2% (BLS, 2026).
This article looks at quarterly employment and wages at the county and industry levels for 2025Q4 in Wyoming, with special attention paid to three of the state's largest industries: mining (including oil & gas), construction, and leisure & hospitality.
The data discussed in this article are from the QCEW, and Wyoming data for 2025Q4 are available at https://doe.state.wy.us/LMI/25Q4_QCEW/toc.htm.
Industry
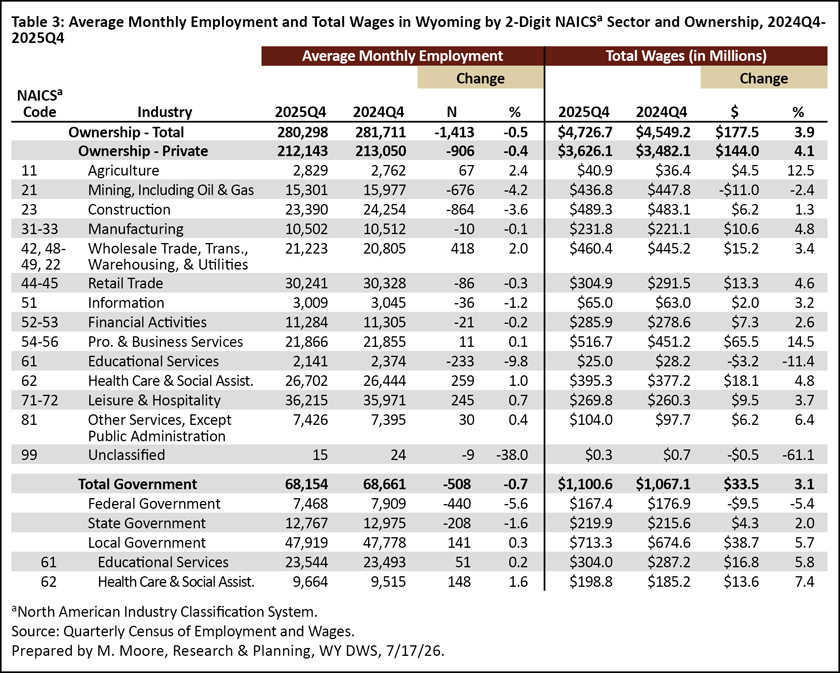
Wyoming’s average monthly employment in 2025Q4 was 280,298, a loss of 1,413 jobs (-0.5%) compared to 2024Q4 (see Table 3). The state had $4.7 billion in total wages, up $177.5 million (3.9%) over the year. Wyoming's average weekly wage increased from $1,242 to $1,297 ($55, or 4.4%).
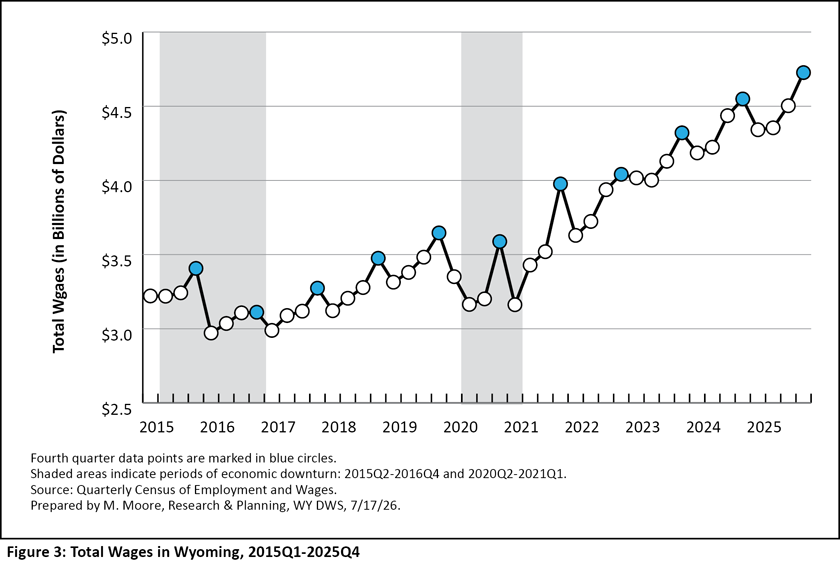
Wyoming's total wages typically peak during fourth quarter each year, when employees may receive bonuses or lump-sum payments (see Figure 3).
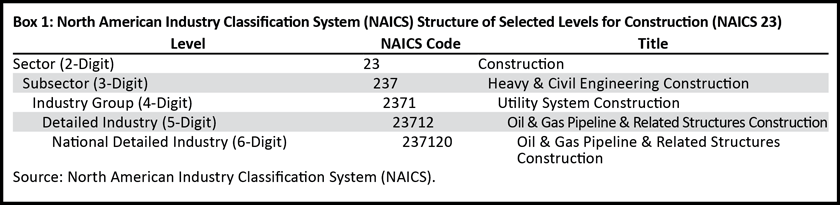
Industries are organized by the North American Industry Classification System (NAICS). A sample of the NAICS hierarchal structure for construction (NAICS 23) can be found in Box 1. This section discusses statewide employment and wages at the sector (or two-digit NAICS) level, with further discussion on the more detailed subsector (three-digit NAICS), industry (four-digit NAICS), and detailed industry (six-digit NAICS) for certain sectors.
Substantial over-the-year job losses were seen in construction (-864, or -3.6%); mining, including oil & gas (-676, or -4.2%); total government (-508, or -0.7%); and private educational services (-233, or -9.8%; see Table 3). Those job losses were somewhat offset by job gains in wholesale trade, transportation, & utilities (418, or 2.0%); health care & social assistance (259, or 1.0%); and leisure & hospitality (245, or 0.7%).
Wyoming employers paid $4.7 billion in total wages in 2025Q4, an over-the-year increase of $177.5 million, or 3.9%. Over-the-year increases in total wages were seen in nearly all industries, with the greatest gains found in professional & business services ($65.5 million, or 14.5%); health care & social assistance ($18.1 million, or 4.8%); and wholesale trade, transportation, & utilities ($15.2 million, or 3.4%).
The only industries with losses in total wages were mining, including oil & gas (-$11.0 million, or -2.4%); educational services (-$3.2 million, or -11.4%); and federal government (-$9.5 million, or -5.4%). Despite job losses in 2025Q4, total wages in construction increased by $6.2 million, or 1.3%.
Mining, Including Oil & Gas (NAICS 21)
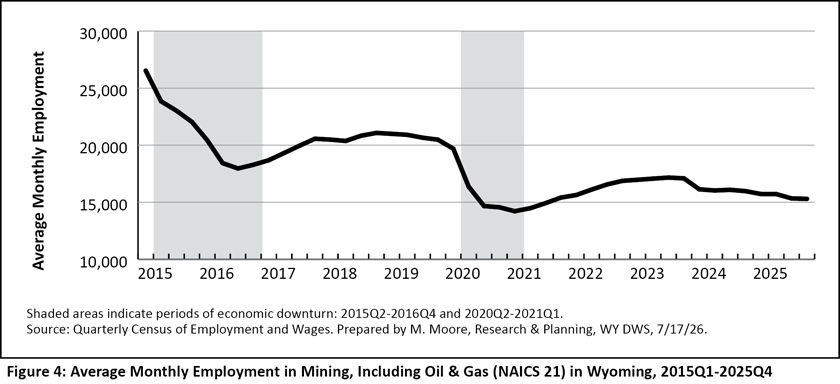
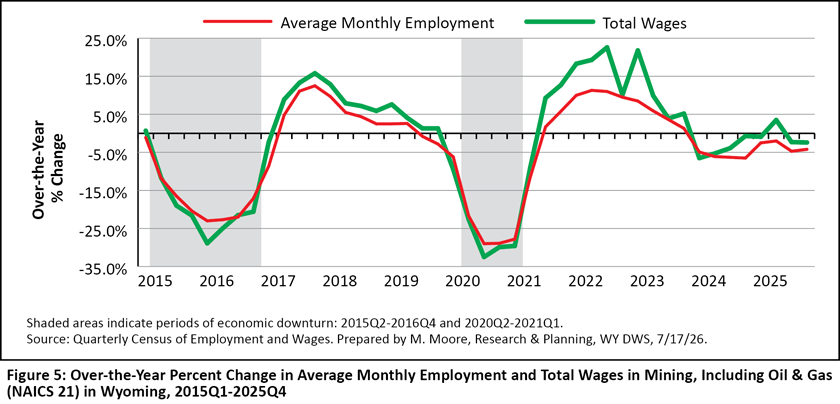
The number of jobs in Wyoming's mining sector has consistently declined over the last 10 years, from a high of 26,527 in 2015Q1 to 15,301 in 2025Q4. In other words, Wyoming's mining sector lost 11,226 jobs during that period, or 42.3% (see Figures 4 and Figure 5).
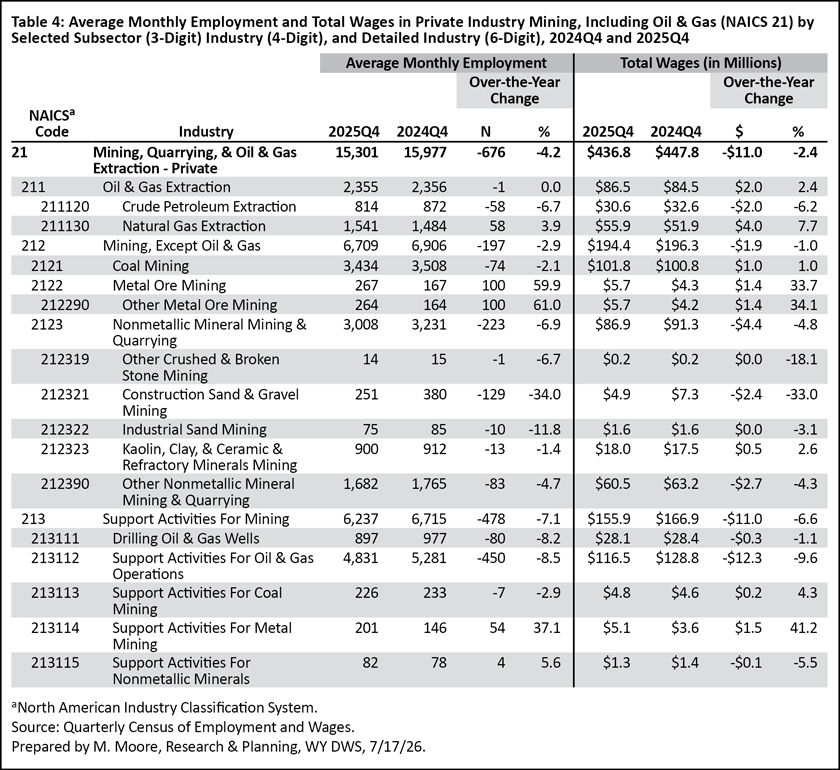
Wyoming's mining sector (NAICS 21) is made up of three subsectors (see Table 4): oil & gas extraction (NAICS 211); mining, except oil & gas (NAICS 212); and support activities for mining (NAICS 213). Average monthly employment fell from 15,977 in 2024Q4 to 15,301 in 2025Q4 (-676, or -4.2%). Substantial job losses were seen in support activities for mining (-478, or -7.1.%) and mining, except oil & gas (-197, or -2.9%). Employment was largely unchanged for the oil & gas extraction subsector (-1, or 0.0%). At the more detailed industry level, coal mining lost 74 jobs (-2.1%) and metal ore mining added 100 (59.9%).
Mining (including oil & gas) had $436.8 million in total wages in 2025Q4, down $11.0 million (-2.4%) compared to 2024Q4.
In 2025Q4, mining contributed 5.5% of the state's jobs and 9.2% of total wages. Over the last decade, mining (including oil & gas) has contributed a shrinking proportion of Wyoming's total jobs and wages. In 2015Q4, mining contributed 7.9% of all jobs and 14.7% of the state's total wages.
Construction (NAICS 23)
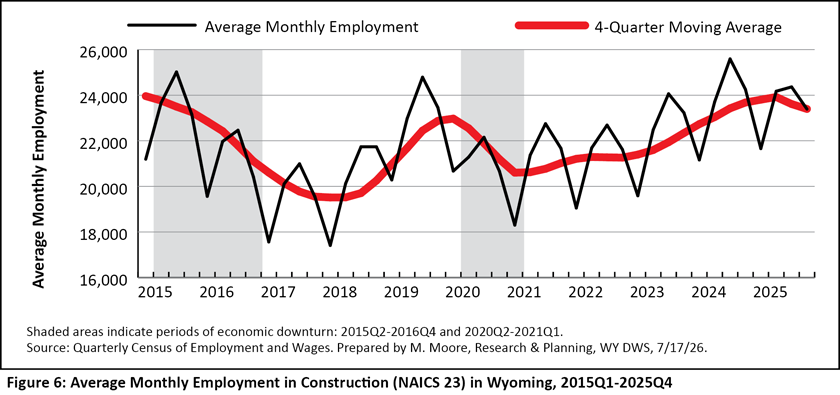
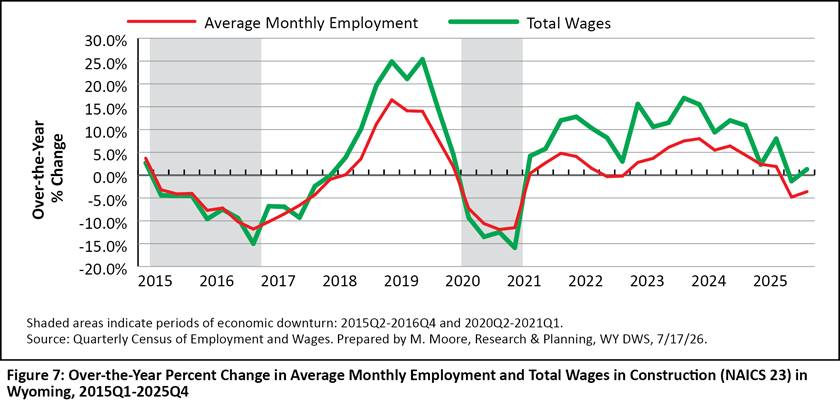
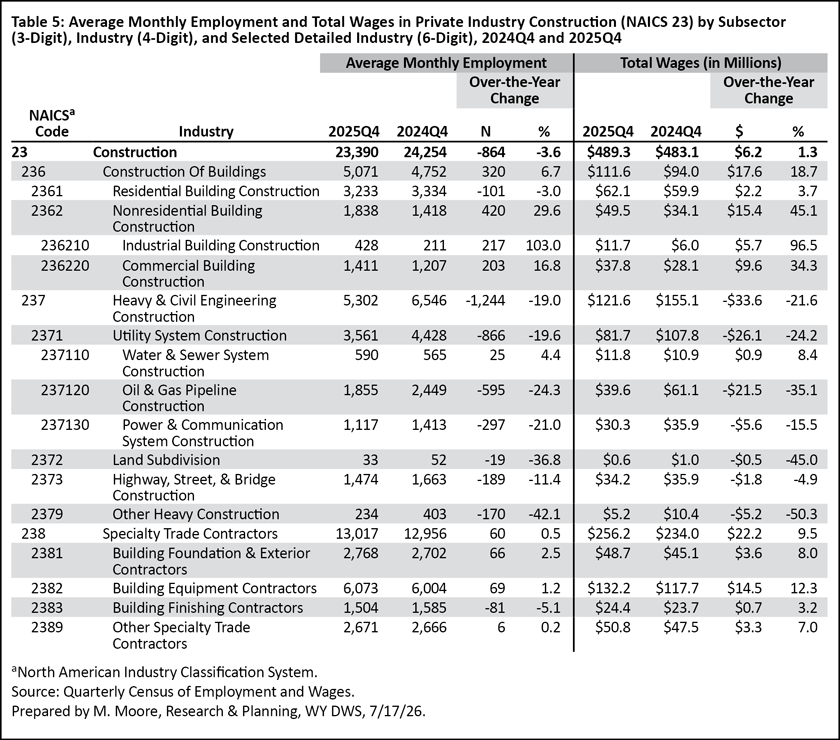
Over the last several years, Wyoming's overall job growth has been driven by the construction industry. From 2023Q1 to 2025Q2, construction had 10 consecutive quarters (two and a half years) of consistent job growth (see Figure 6 and Figure 7). However, average monthly employment in construction declined from prior-year levels in third and fourth quarter 2025. Average monthly employment in construction fell from 24,254 in 2024Q4 to 23,390 in 2025Q4 (-864, or -3.6%; see Table 5).
Construction (NAICS 23) comprises three subsectors: construction of buildings (NAICS 236), heavy & civil engineering construction (NAICS 237), and specialty trade contractors (NAICS 238). The most substantial job losses in 2025Q4 were seen in heavy & civil engineering construction (-1,244, or -19.0%). At the detailed industry level, oil & gas pipeline construction lost 595 jobs (-24.3%), and power & communication system construction lost 297 (-21.0%). Once large, temporary construction projects are completed, the jobs go away.
Construction of buildings increased by 320 jobs (6.7%) on the strength of nonresidential building construction. Specialty trade contractors increased by 60 (0.5%), as job gains were seen in building foundation & exterior contractors and building equipment contractors.
Construction had $489.3 million in total wages in 2025Q4, up $6.2 million, or 1.3%. Construction accounted for 8.3% of the state's jobs and 9.5% of total wages.
Leisure & Hospitality (NAICS 71-72)
The leisure & hospitality supersector consists of two sectors: arts, entertainment, & recreation (NAICS 71) and accommodation & food services (NAICS 72).
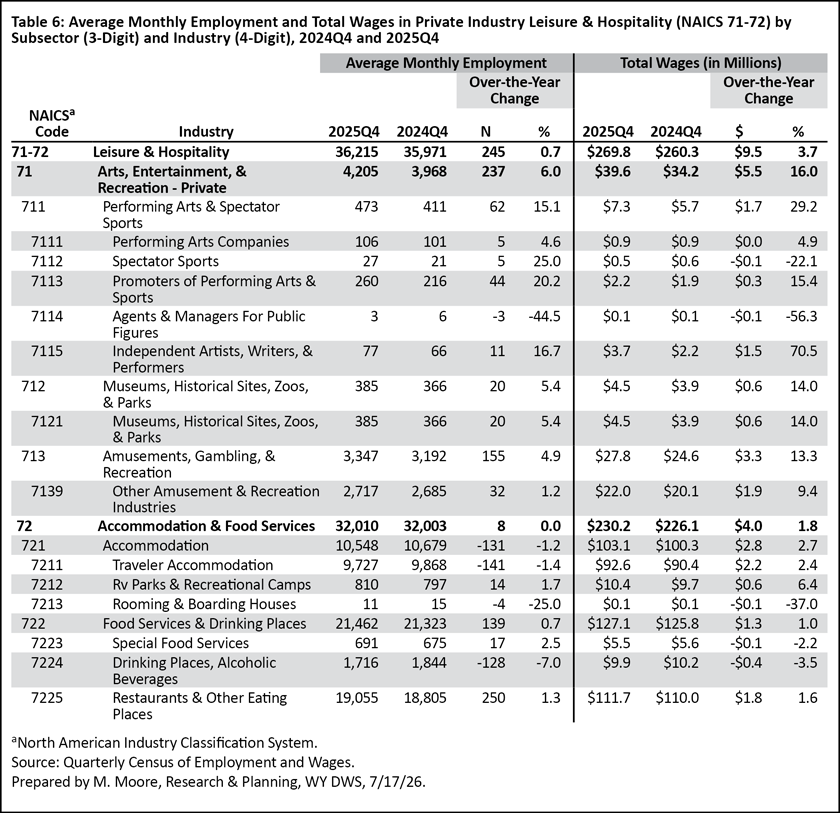
Following record job losses during the 2020-2021 economic downturn, leisure & hospitality experienced a prolonged period of slow, steady job and wage growth, with a few quarters of minor job losses (see Figure 6 and Figure 7). Employment peaked at an all-time high of 43,655 in 2024Q3, and then decreased slightly a year later. In 2025Q4, leisure & hospitality's average monthly employment was 36,215, up 245 jobs (0.7%) compared to 2024Q5 (see Table 6).
Within leisure & hospitality, job growth was seen in industries (four-digit NAICS) such as restaurants & other eating places (250, or 1.3%); amusements, gambling, & recreation (155, or 4.9%); and food services & drinking places (139, or 0.7%). Job losses occurred in traveler accommodation (-141, or -1.4%) and drinking places, alcoholic beverages (-128, or -7.0%).
Total wages in leisure & hospitality increased from $260.3 million in 2024Q4 to $269.8 million in 2025Q4 ($9.5 million, or 3.7%).
Leisure & hospitality accounted for a greater proportion of jobs (12.9%) than any other industry in 2025Q4. However, leisure & hospitality only accounted for 9.2% of the state's total wages. In 2025Q4, leisure & hospitality's average weekly wage of $573 was the lowest of any industry and less than half of the statewide average of $1,297 (Research & Planning, 2026).
County
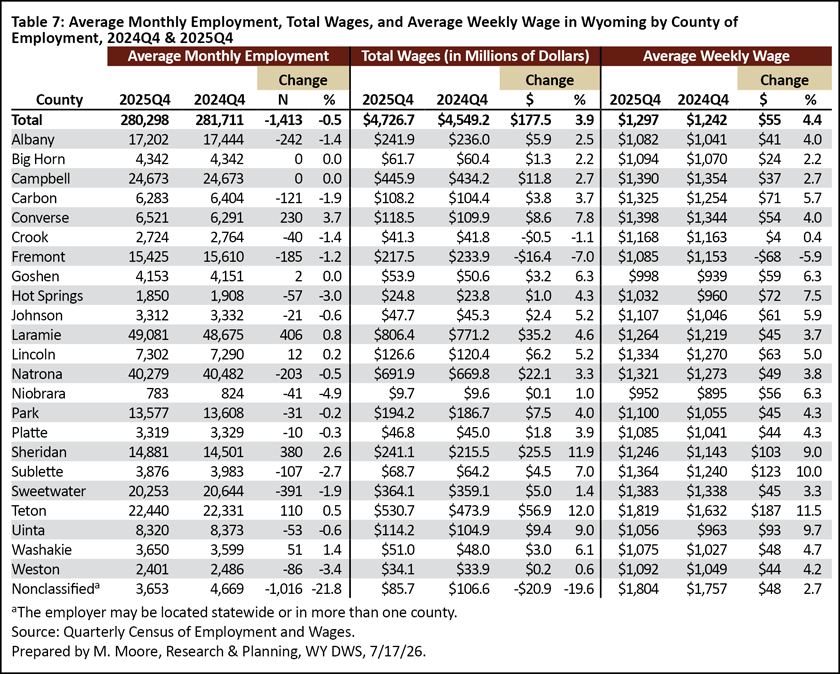
Over-the-year job growth occurred in six of Wyoming's 23 counties, while job losses were seen in 14 (see Table 7). Laramie County added the greatest number of jobs (406, or 0.8%), followed by Sheridan (380, or 2.6%), Converse (230, or 3.7%), and Teton (110, or 0.5%) counties. The largest job losses belonged to a nonclassified county (employers located statewide or in more than one county) with 1,016 fewer jobs, or 21.8%. The counties with the greatest job losses included Sweetwater (-391, or -1.9%), Albany (-242, or -1.4%), and Natrona (-203, or -0.5%). Employment was unchanged in three counties: Big Horn, Campbell, and Goshen.
Despite job losses in 14 counties, all but two showed increases in total wages. The greatest increases occurred in Teton ($56.9 million, or 12.0%), Laramie ($35.2 million, or 4.6%), and Sheridan ($25.5 million, or 11.9%). Decreases in total wages were found in Fremont (-$16.4 million, or -7.0%) and Crook (-$0.5 million, or -1.1%). In the nonclassified county, total wages fell by $20.9 million, or 19.6%.
Teton County had the highest average weekly wage in 2025Q4 ($1,819), due in part to especially high wages in industries like management of companies & enterprises, finance & insurance, and information (Research & Planning, 2026). Many of the other counties with high wages were those with relatively large numbers of mining-related jobs, such as Converse ($1,398), Campbell ($1,390), Sweetwater ($1,383), and Sublette ($1,364). The counties with the lowest average weekly wages included Niobrara ($952), Goshen ($998), and Hot Springs ($1,032).
A Closer Look
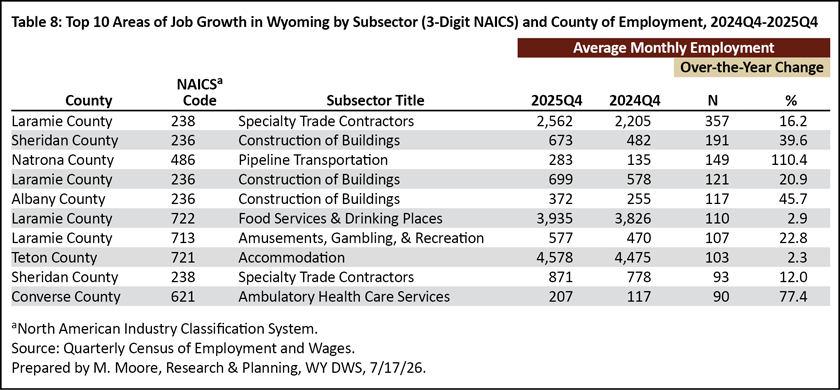
Table 8 shows more specific data on where job growth occurred by subsector (three-digit NAICS) and county. Much of the growth occurred within subsectors of construction and leisure & hospitality. For example, Laramie County saw job growth in specialty trade contractors (357, or 16.2%) and construction of buildings (121, or 20.9%), as well as food services & drinking places (110, or 2.9%) and amusements, gambling, & recreation (107, or 22.8%). Job growth in construction of buildings also was seen in Sheridan (191, or 39.6%) and Albany (117, or 45.7%) counties.
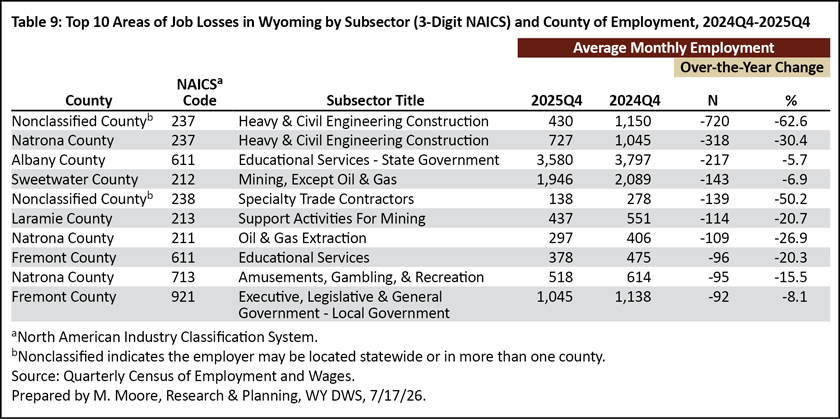
In contrast, Table 9 shows greatest employment decreases by subsector (three-digit NAICS) and county of employment. As previously mentioned, the greatest job losses were seen in Wyoming’s construction sector, likely due to the completion of large construction projects. This can be seen in Table 9, which shows the greatest job losses were found in heavy & civil engineering in the nonclassified county (-720, or -62.6%) and Natrona County (-318, or -30.4%). Job losses also were seen in mining subsectors, including mining, except oil & gas in Sweetwater County (-143, or -6.9%); support activities for mining in Laramie County (-114, or -20.7%); and oil & gas extraction in Natrona County (-109, or -26.9%).
Conclusion
In 2025Q4, Wyoming's average monthly employment declined from prior-year levels for the second consecutive quarter, as the state lost more than 1,400 jobs. However, several factors suggest that 2025Q3 and 2025Q4 were not the start of a new economic downturn for Wyoming. Despite job losses, total wages increased by $177.5 million, and other program estimates indicate moderate over-the-year job gains during the first six months of 2026.
Data for 2026Q1 will be published in November 2026.
References
Bullard, D. (2026, April). Wyoming unemployment rate falls to 3.2% in June 2026. Research & Planning, Wyoming Department of Workforce Services. Retrieved August 4, 2026, from https://doe.state.wy.us/LMI/2026_06_news.pdf
Moore, M. (2021, January). 2020Q2 quarterly update: Covid-19 pandemic forces historic job losses in 2020Q2. Wyoming Labor Force Trends, 58(1). Research & Planning, Wyoming Department of Workforce Services. Retrieved August 4, 2026, from https://doe.state.wy.us/LMI/trends/0121/0121.pdf
Research & Planning. (2026, July). Wyoming Quarterly Census of Employment and Wages — Employment and wages by county. Retrieved August 4, 2026, from https://doe.state.wy.us/LMI/25Q4_QCEW/t1.htm
U.S. Bureau of Labor Statistics. (2026). Quarterly Census of Employment and Wages — Employment and wages data viewer. Retrieved August 4, 2026, from https://data.bls.gov/cew/apps/data_views/data_views.htm#tab=Tables

 Hire Wyo