Wyoming Labor Force Trends
September 2025 | Volume 62, No. 9
Click Here for PDF
Return to Table of Contents
Three Decades of Shifting Spending Patterns in Retail Trade and Food Services
An Illustrated History of U.S. Retail and Food Services Sales, 1992-2025
by: David Bullard, Senior Economist
How have Americans’ shopping habits changed over the last 30-plus years? Every month the U.S. Census Bureau publishes estimates of retail and food services sales by subsector. This article reviews changes in retail and food services sales from 1992 to present. Retail and food services sales are broken out by 2017 North American Industry Classification System (NAICS) codes and published at the subsector (3-digit NAICS) level.
Figure 1 shows the total level of retail and food services sales for each month from January 1992 to July 2025. A large part of the upward trend reflects inflation because the data are not adjusted for changes in the price level. Two major downturns can clearly be seen in the data. The first was the Great Recession. Retail and food services sales peaked at $370.8 billion in November 2007, and then fell to $322.4 billion in March 2009. It wasn’t until two years later, in March 2011 that sales returned to their pre-recession peak.
The second major downturn was the COVID-19 Pandemic. Retail and food services sales fell sharply from $515.3 billion in February 2020 to $401.0 billion in April 2020, but rebounded very quickly. Following the initial rebound, sales continued to grow, and the most recent data for July 2025 show that U.S. consumers spent $726.3 billion in retail and food services establishments.
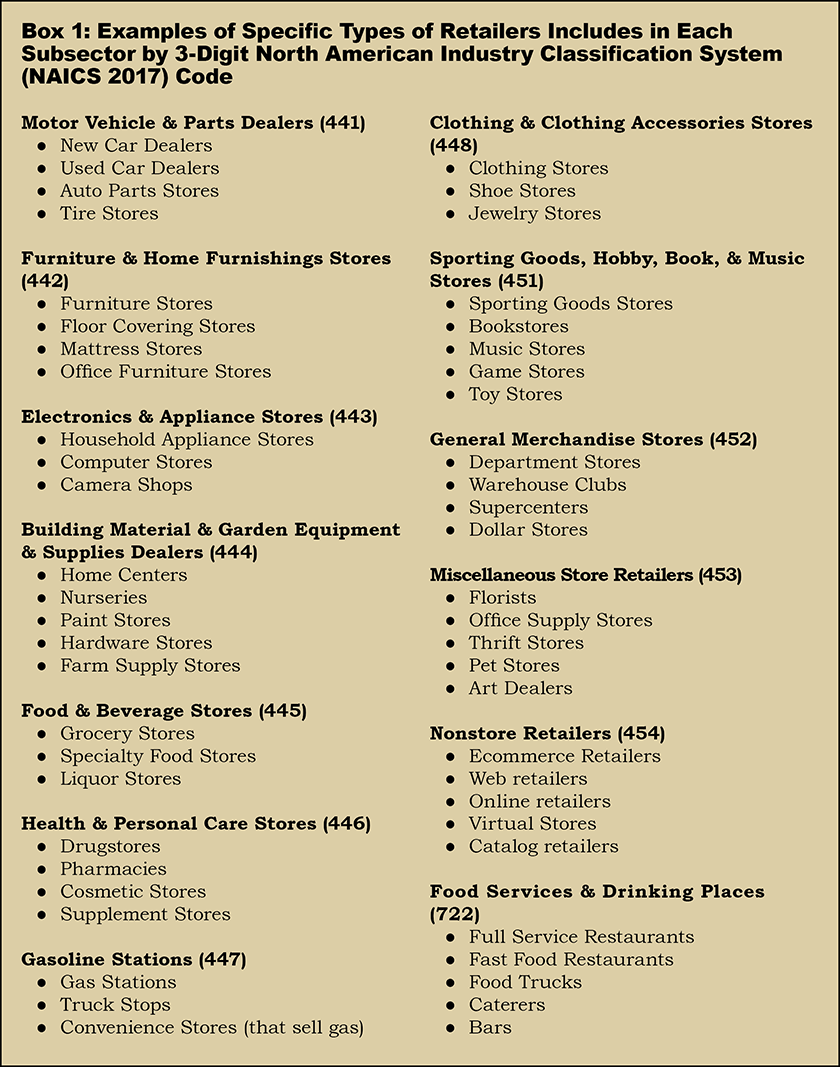
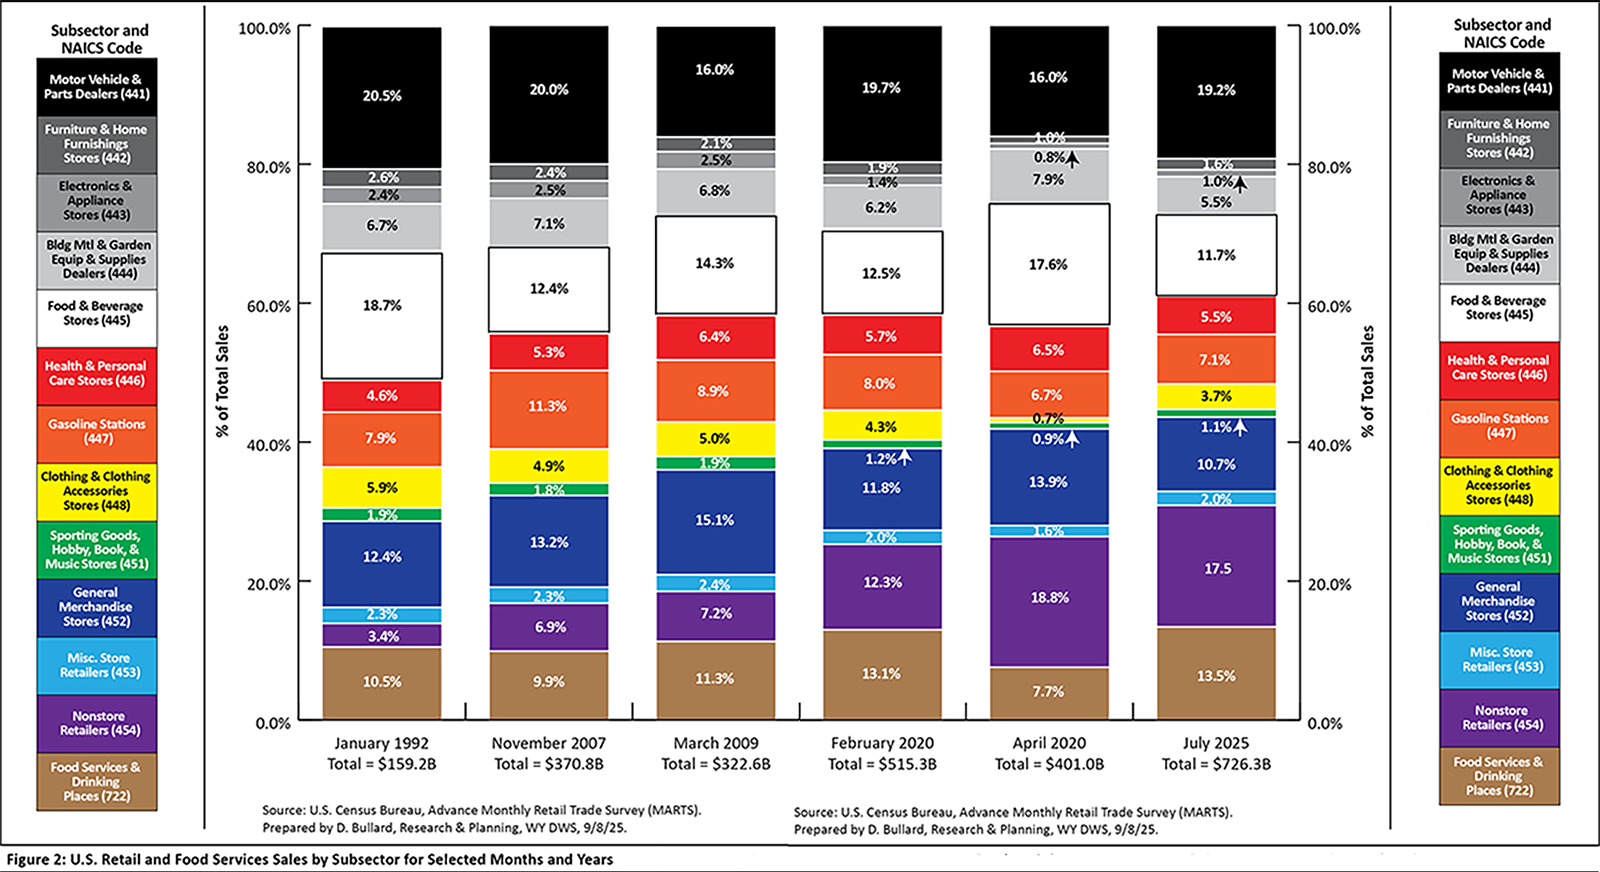
Figure 2 provides an illustration of retail and food services sales by subsector for each period discussed in this article. The first bar represents January 1992, when the largest subsectors by sales were motor vehicle & parts dealers (20.5% of total sales), food & beverage stores (18.7%), general merchandise stores (12.4%), and food services & drinking places (10.5%). Box 1 (click or see below) provides examples of specific types of stores within each category. For example, the category of general merchandise stores includes department stores, supercenters, warehouse clubs, and dollar stores.
Many commonly purchased items can be found at different types of stores. Groceries, for example, can be purchased at traditional grocery stores (included in food & beverage stores), at supercenters (included in general merchandise stores), or online (included in nonstore retailers). Similarly, clothing can be purchased at clothing stores, or general merchandise stores, or at nonstore retailers. Even while buying the same things, consumers can choose to buy from different outlets, and this helps explain some of the shifts in retail and food services spending.
Prices also affect retail and food services sales. None of the retail and food services sales estimates published by the Census Bureau are adjusted for inflation, so changes in spending at gasoline stations are just as likely to reflect changes in gasoline prices as changes in the volume of gasoline sold.
×
![]()
As seen in Figure 1, retail and food service sales rose steadily from 1992 to 2007. The second bar in Figure 2 shows the breakout of retail and food service spending at its pre-recession peak in November 2007. Motor vehicle & parts dealers maintained its spot as the single largest component of retail and food services sales (20.0%). It was followed by general merchandise stores at 13.2%, food & beverage stores at 12.4%, and gasoline stations at 11.3%. Thus, compared to January 1992, sales at general merchandise stores accounted for a larger percentage of overall sales (up from 12.4% to 13.2%), while food & beverage stores accounted for a smaller percentage (down from 18.7% to 12.4%). Gasoline stations rose from 7.9% to 11.3% as the price of fuel increased. Nonstore retailers, which includes internet based stores, rose from 3.4% to 6.9%.
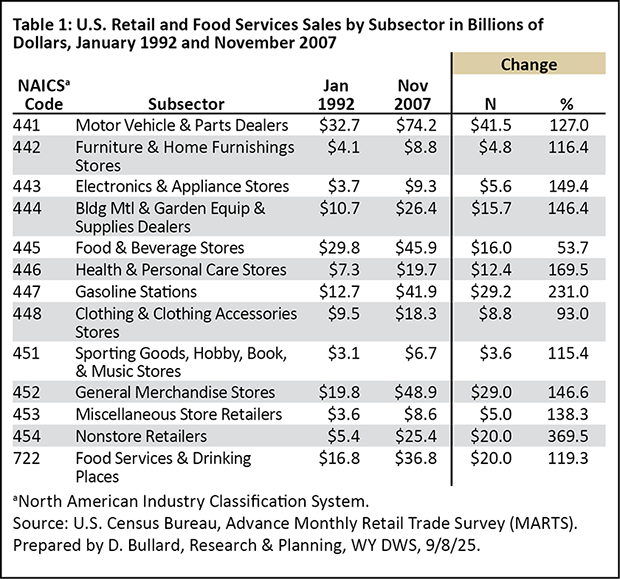
Table 1 compares January 1992 sales to November 2007. In percentage terms, the largest increase in sales occurred at nonstore retailers (up $20.0 billion, or 369.5%), reflecting the rapid growth of Internet retail. The second largest increase was seen at gasoline stations (up $29.2 billion, or 231.0%). According to the Bureau of Labor Statistics, the average price of a gallon of gasoline rose from $1.073 in January 1992 to $3.069 in November 2007. The smallest increase was at food & beverage stores ($16.0 billion, or 53.7%).
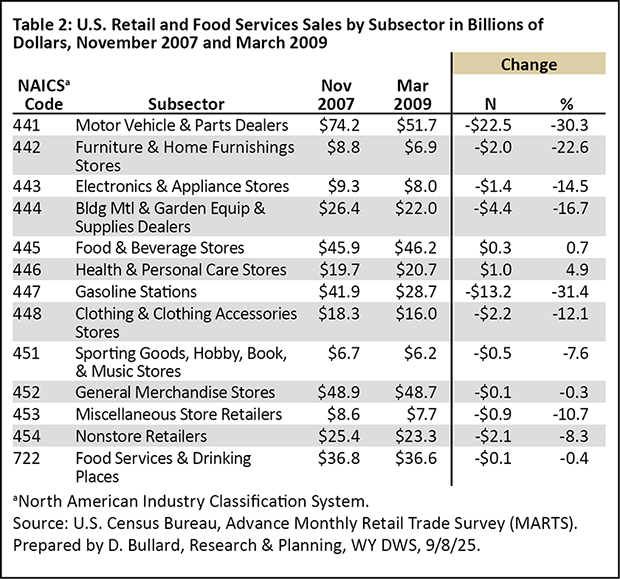
The third bar in Figure 2 shows the breakout of retail and food service sales at the bottom of the Great Recession. Between November 2007 and March 2009, retail and food services sales fell by $48.1 billion (13.0%). Comparing November 2007 to March 2009 reveals that Americans were spending a smaller proportion at motor vehicle and parts dealers (down from 20.0% to 16.0%), gasoline stations (down from 11.3% to 8.9%), food services & drinking places (down from 11.3% to 9.9%), and more at general merchandise stores (up from 13.2% to 15.1%) and food & beverage stores (up from 12.4% to 14.3%). In other words, at the depth of the Great Recession, consumer spending was focused more on necessities like groceries, and less on luxuries such as eating out. It also appears that some consumers might have been putting off the purchase of vehicles.
Table 2 summarizes the data in a different way. In terms of dollars (rather than percentages of the total), during the Great Recession retail and food services sales fell everywhere except two categories: food & beverage stores and health & personal care stores. The largest decreases were at motor vehicle & parts dealers (-$22.5 billion, or -30.3%), gasoline stations (-$13.2 billion, or -31.4%), and building material & garden equipment & supplies dealers (-$4.4 billion, or -16.7%).
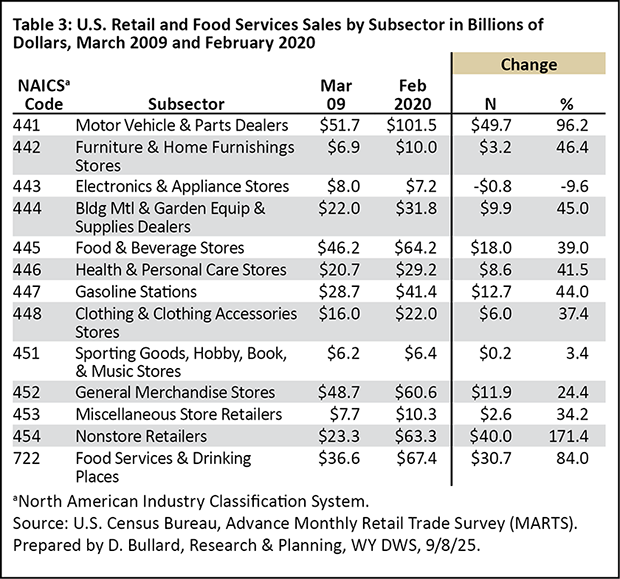
The pre-pandemic peak of retail and food services sales occurred in February 2020 and is represented by the fourth bar in Figure 2. Motor vehicle & parts dealers rebounded from 16.0% of retail sales to 19.7%, food services & drinking places rebounded from 11.3% to 13.1%, and the real winner was nonstore retailers, which rose from 7.2% to 12.3%. The growth in spending at nonstore retailers reflects U.S. consumers transitioning to more online purchases. Sales at nonstore retailers rose by $40.0 billion (171.4%; see Table 3). That huge increase likely reflected consumers shifting their spending away from electronics & appliance stores (down $767 million, or 9.6%) and sporting goods, hobby, book, & music stores (up $210 million, or 3.4%). During this time period (March 2009 to February 2020), the consumer price index rose 21.6%. Therefore, subsectors, such as sporting goods, hobby, book, & music stores, where sales rose less than 21.6% likely saw decreasing sales volumes (after adjusting for inflation).
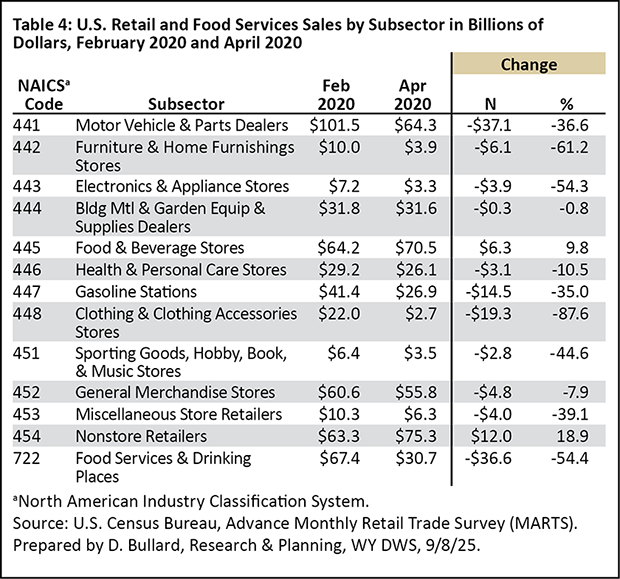
The fifth bar in Figure 2 shows the pattern of retail and food services sales at the height of the pandemic in April 2020. From February 2020 to April 2020, total retail and food service sales fell $114.3 billion, or 22.2%. During that two-month period, sales fell in every category except nonstore retailers (up $12.0 billion, or 18.9%) and food & beverage stores (up $6.3 billion or 9.8%; see Table 4).
From February 2020 to April 2020, sales at clothing & clothing accessories stores fell by $19.3 billion, or 87.6%.
The current situation in retail and food services sales is shown in the sixth and final bar in Figure 2. Motor vehicle & parts dealers accounted for the largest part of retail sales (19.2%) and it was followed by nonstore retailers (17.5%), and food services & drinking places (13.5%). In January 1992, nonstore retailers only made up 3.4% of retail sales.
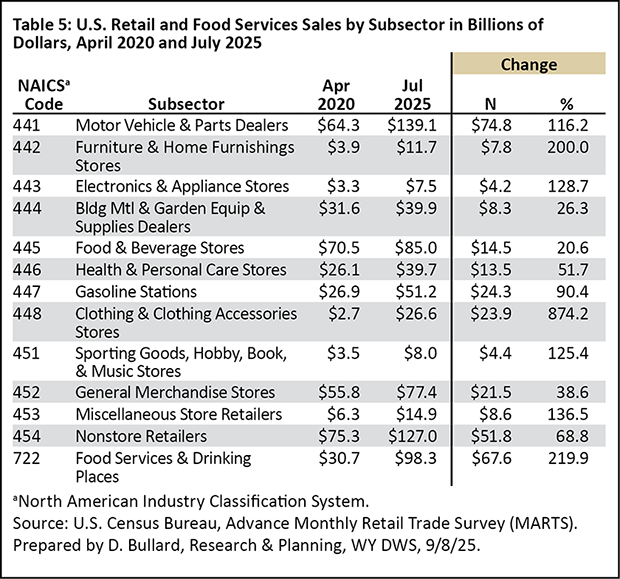
Table 5 compares the current retail landscape to the height of the pandemic. In percentage terms, the largest sales increase occurred at clothing & clothing accessories stores ($23.9 billion, or 874.2%). This large increase is partly a function of the very sharp contraction in sales at clothing retailers that occurred during the pandemic. The second largest sales increase was at food services & drinking places ($67.6 billion, or 219.9%). The smallest percentage increase occurred at food & beverage stores ($14.5 billion, or 20.6%). As seen in Table 4, food & beverage stores did not see sales decline during the pandemic, so they did not need to make up for any loss.
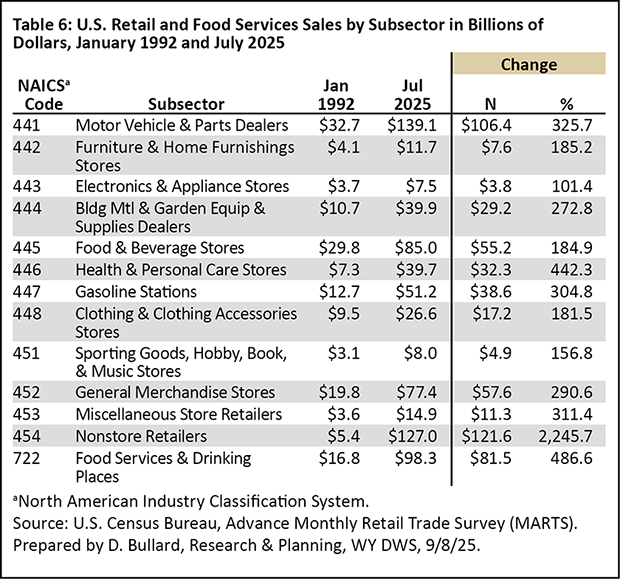
Table 6 summarizes the changes over the entire time period. By far, the largest percentage increase in sales was at nonstore retailers (up $121.6 billion, or 2,245.7%). The slowest growth was electronics & appliance stores ($3.8 billion, or 101.4%); sporting goods, hobby, book & music stores ($4.9 billion, or 156.8%); and clothing & clothing accessories stores ($17.2 billion, or 181.5%). It appears that those three categories of retailers were negatively affected by the shift to online retail.
In summary, several important changes have occurred in the U.S. retail and food services sector. First, the growth in nonstore retailers, especially ecommerce, has been dramatic, up over 2,000%. Second, a large part of that growth has come at the expense of electronics & appliance stores; sporting goods, hobby, book, & music stores; and clothing & clothing accessories stores. Third, there has been a shift away from traditional grocery stores (in the food & beverage stores category) towards warehouse clubs and supercenters (in the general merchandise stores category). Finally, U.S. consumers are spending much more on eating out. Food services & drinking places had the second largest percentage increase in sales from 1992 to 2025.
Note: The U.S. Census Bureau publishes “experimental” state retail sales data, starting with January 2019. Instead of dollar values, they publish over-the-year percentage change in retail sales. Reviewing their data for Wyoming reveals that even within the relatively short time frame of January 2019 to May 2025, many values are suppressed which limits the value of the data series.
 Hire Wyo
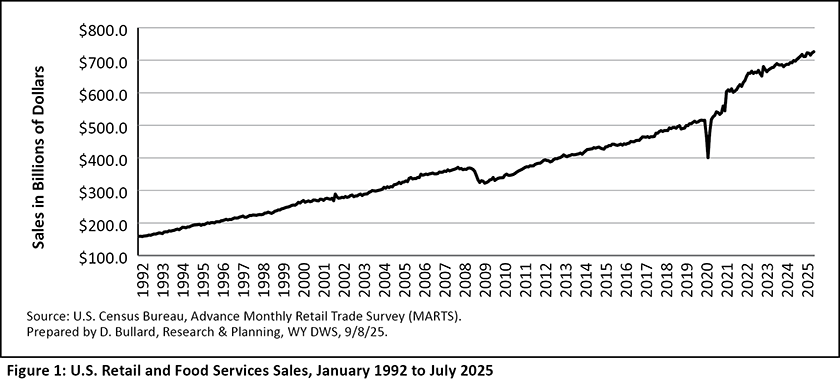