Wyoming Labor Force Trends
September 2025 | Volume 62, No. 9
Click Here for PDF
Return to Table of Contents
The Demographics of Wyoming’s Workforce in 2024
by: Lisa Knapp, Senior Analyst
In 2024, more than 350,000 individuals had wages in Wyoming at any time during the year. This article provides information on Wyoming’s workforce by age, sex, industry and county of employment, and more.
Each year, the Research & Planning (R&P) section of the Wyoming Department of Workforce Services publishes detailed demographic tables for the Wyoming workforce. These tables include information about the number of workers, average number of employers worked for, average number of quarters worked, and average annual wages, and are broken out by sex, age group, and nonresident status. This information is available at https://doe.state.wy.us/LMI/demographics.htm.
The data in these tables were calculated by linking the Wyoming Wage Records database to other administrative data. Wage records include all individuals working in the state based on data from employer quarterly employment and wage reports that are provided to the Unemployment Insurance (UI) section of the Wyoming Department of Workforce Services.
This article contains data for all individuals who worked in the state in 2024, with each individual counted only once. The published demographics data provide general overview of worker characteristics that include wages, industry of work, length of time spent with a particular employer, within an industry, and in the Wyoming workforce, and demographics such as age and sex.
This article focuses specifically on the age and sex characteristics of people working in Wyoming in 2024. Chapter 6 in the 2025 Wyoming Workforce Annual Report looks at changes in the demographics over time in Wyoming’s workforce, and is available at https://doe.state.wy.us/LMI/annual-report/2025/2025_Annual_Report.pdf#page=38.
County
Overall, as shown in Table 1, 44.2% of Wyoming’s workforce in 2024 was male, 39.2% was female, and 16.6% were nonresidents. The term nonresidents refers to individuals for whom demographic data are not available. Nonresident workers frequently are individuals who come to Wyoming for seasonal or temporary work from another state or country. Some nonresident workers may move to Wyoming for long-term employment.
Counts are revised each year as demographic data become available. For example, a male may have been a nonresident worker in Wyoming in 2024, but then obtained a Wyoming driver's license in 2025. When R&P updates its demographics data each year, data are backfilled and that person will be counted as a resident male worker.
Overall, 18 of Wyoming’s 23 counties had a higher proportion of male workers than female (see Table 1). These included Sweetwater (50.4% male to 39.8% female, Campbell (51.4% male to 39.4% female), and Natrona (48.8% male to 42.6% female) counties.
In comparison, only Niobrara County had a noticeably larger proportion of female workers (51.3%) compared to males (42.9%). The counties in which nonresidents made up the greatest proportion of workers included Teton (39.0%), Carbon (19.1%), Lincoln (13.5%), and Sublette (13.5%).
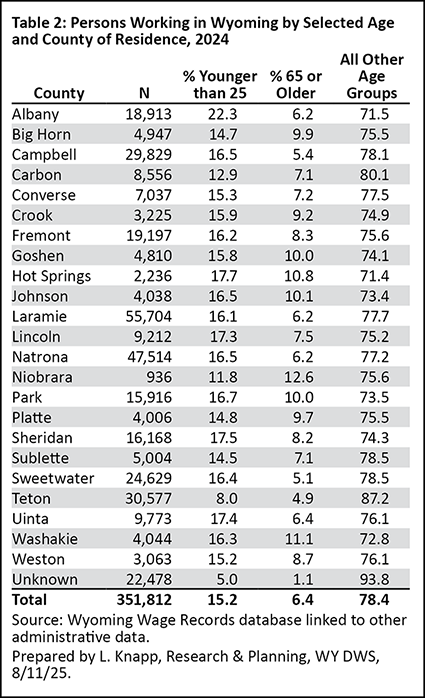
Table 2 shows the percentage of persons working in Wyoming by selected age group and county. Albany County, where the University of Wyoming is located, had the largest percentage of workers who were younger than the age of 25 (22.3%). Some of Wyoming’s least populous rural counties had the largest percentage of workers age 65 or older, such as Hot Springs County (10.8%), Niobrara County (12.6%), and Washakie County (11.1%). Teton County had the smallest proportion of both workers under the age of 25 (8.0%) and age 65 or older (4.9%), due in part to the large proportion of nonresident workers in the county.
Industry
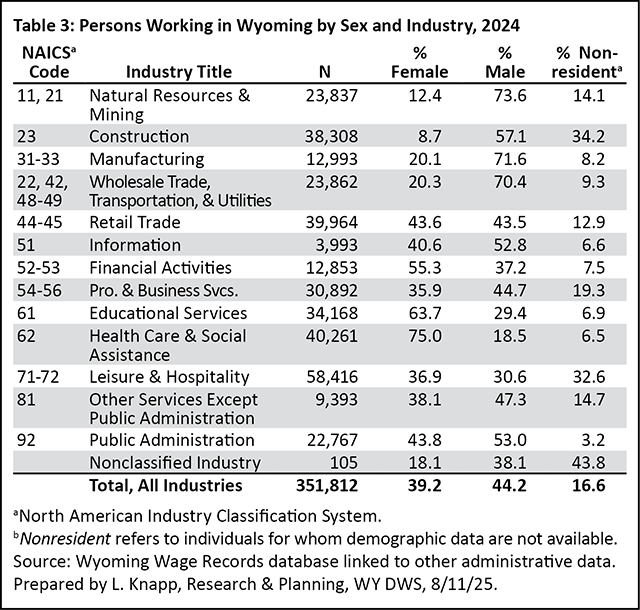
Table 3 shows the proportion of workers in Wyoming in 2024 broken out by sex and industry. Male workers constituted the largest percentage of workers in several industries, including natural resources & mining (73.6%); manufacturing (71.6%); and wholesale trade, transportation, and utilities (70.4%). In comparison, females made up a greater proportion of persons in several other industries, such as educational services (63.7%), health care & social assistance (75.0%), and financial activities (55.3%). Nonresident workers made up approximately one in three workers in both construction (34.2%) and leisure & hospitality (32.6%).
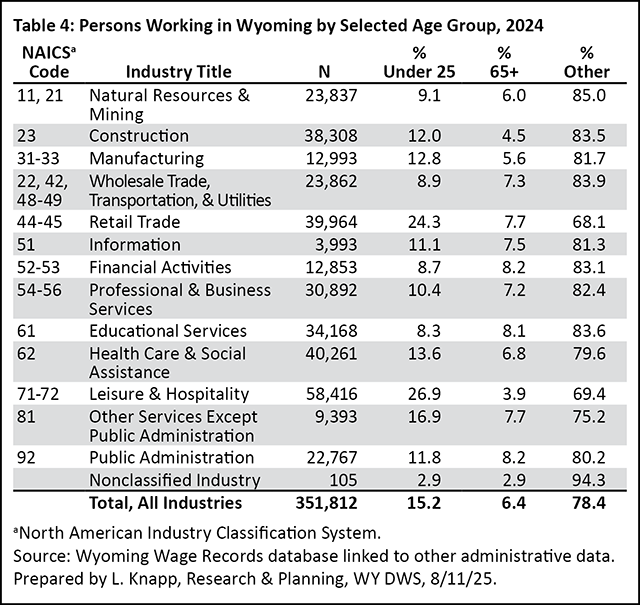
Most industries had a larger concentration of younger workers (those younger than 25) than older workers (those 65 and older; see Table 4). In particular, at least one in four workers in retail trade (24.3%) and leisure & hospitality (26.9%) were younger than age 25, compared to only 7.7% and 3.9% age 65 or older, respectively. There were nearly equal proportions of workers in these two age groups working in financial activities, where 8.7% of workers were younger than age 25 compared to 8.2% of workers who were age 65 or older, and in educational services where 8.3% of workers were younger than age 25 compared to 8.1% of workers who were age 65 or older.
Older and Younger Workers by Sex
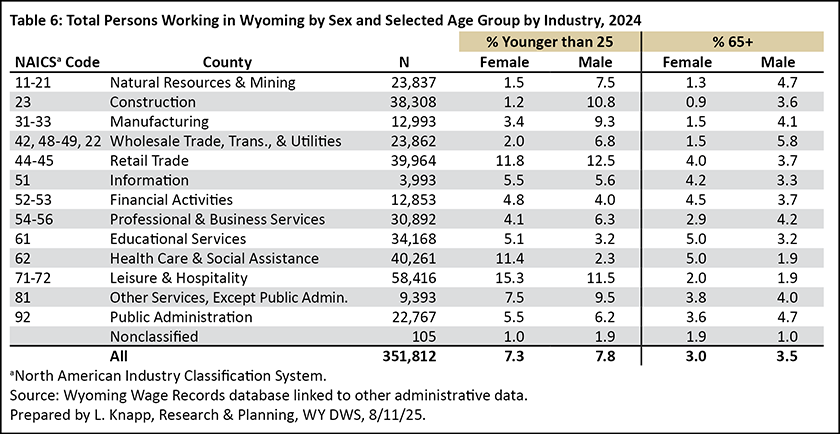
Overall, females younger than 25 made up 7.3% of all persons working in Wyoming, while males younger than 25 made up 10.7%. In addition, females 65 and older made up 3.0% of all persons working, compared to 3.5% of males 65 and older.
Overall, females younger than 25 made up 7.3% of all persons working in Wyoming, while males younger than 25 made up 10.7%. In addition, females 65 and older made up 3.0% of all persons working, compared to 3.5% of males 65 and older.
At the industry level, however, greater differences can be seen among younger and older workers by sex (see Table 6). Males younger than 25 made up a greater proportion than females in industries such as construction (10.8% to 1.2%) and natural resources & mining (7.5% to 1.5%).
Conversely, females younger than 25 made up a great proportion than males in industries like health care & social assistance (11.4% to 2.3%) and leisure & hospitality (15.3% to 11.5%).
Less of a difference was seen between the sexes in the 65 and older age group. For example, males made up a greater proportion than females in wholesale trade, transportation, & utilities (5.8% to 1.5%), while females made up a greater proportion than males 65 and older in health care & social assistance (5.0% to 1.9%).
 Hire Wyo
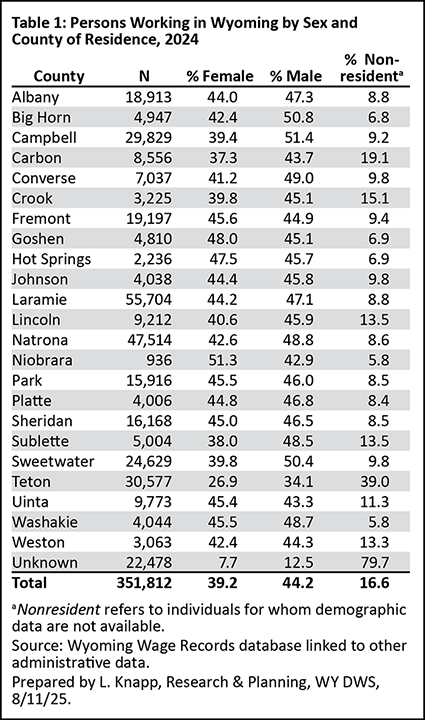