Wyoming Labor Force Trends
July 2024 | Volume 61, No. 7
Click Here for PDF
Return to Table of Contents
2023Q4 Quarterly Update: Construction Drives Wyoming Employment Growth
by: Michael Moore, Research Supervisor
This article provides an overview of Wyoming’s employment and wages in fourth quarter 2023 at the county and industry levels. Employment and wages from 2023Q4 are compared to data from 2022Q4 and 2019Q4. In addition, this article provides a detailed look into Wyoming's construction sector in order to gain a better understanding of where growth occurred.
Wyoming added nearly 4,600 jobs and $265.8 million in total wages over the year in fourth quarter 2023 (2023Q4; see Table 1). This marked the 11th consecutive quarter (nearly three years) of over-the-year job growth. Average monthly employment was also about 1,600 jobs higher compared to 2019Q4 prior to the pandemic.
This article looks at quarterly employment and wages at the county and industry levels for 2023Q4, in order to determine areas of job growth over the year and prior to the pandemic. Also, this article provides a detailed discussion on Wyoming's construction sector, which led all industries in job gains.
The data discussed in this article are from the Quarterly Census of Employment and Wages (QCEW). Data from 2023Q4 are available at https://doe.state.wy.us/LMI/23Q4_QCEW/toc.htm.
Introduction
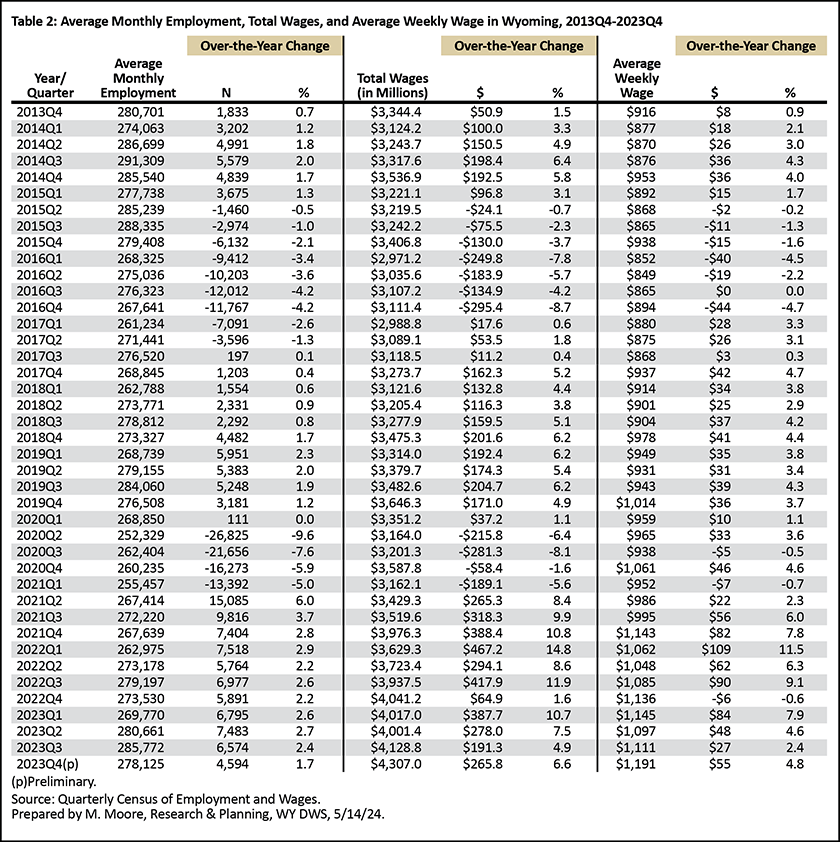
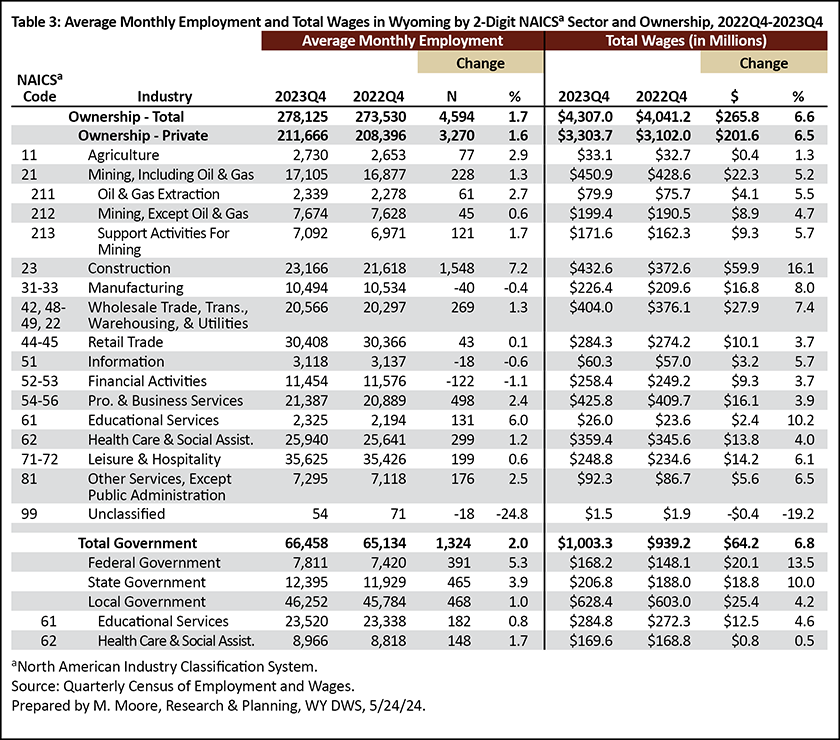
Wyoming’s average monthly employment in 2023Q4 was 278,125, an increase of 4,594 jobs (1.7%) compared to 2022Q4 (see Table 2). The state had $4.3 billion in total wages, up $265.8 million (6.6%) over the year. Wyoming's average weekly wage increased from $1,136 to $1,191 ($55, or 4.8%).
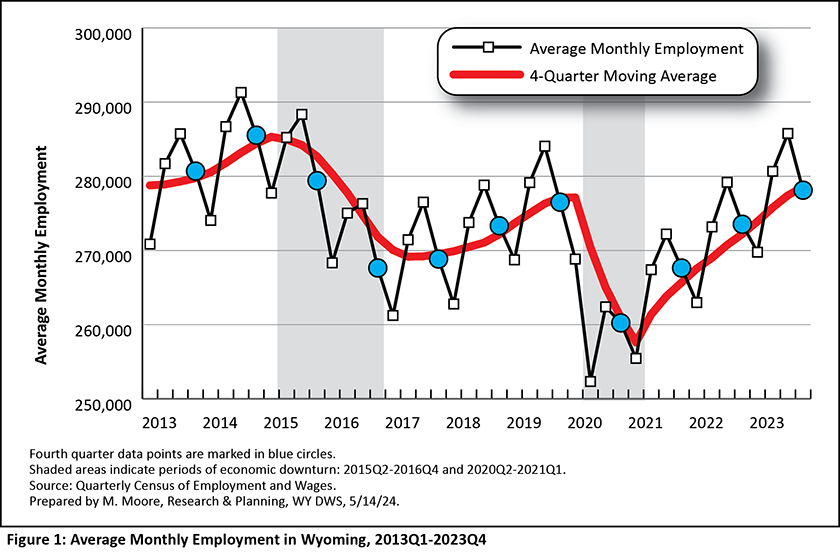
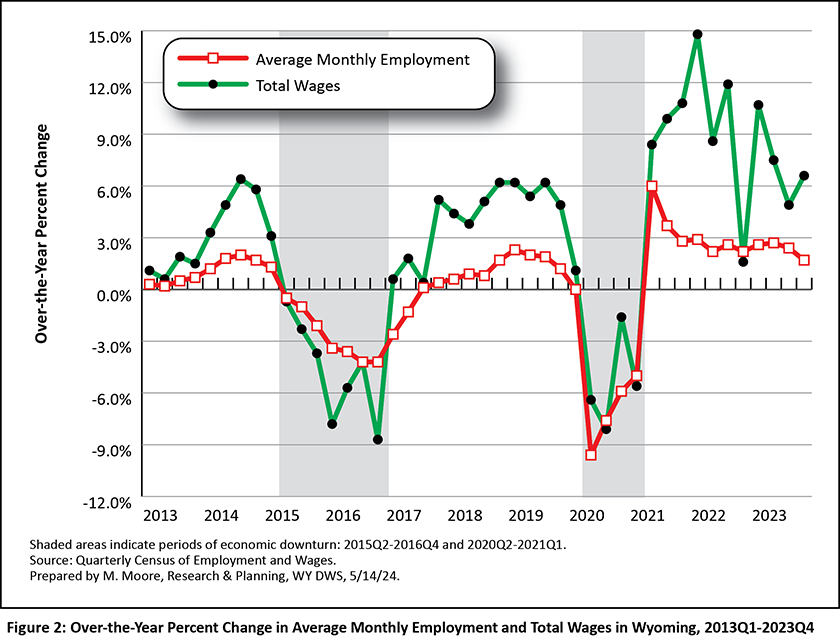
Wyoming employment typically increases from first quarter to second, before peaking in third quarter and then dropping in fourth quarter (see Figure 1). The shaded areas in the figures in this article represent periods of economic downturn. The Research & Planning (R&P) section of the Wyoming Department of Workforce Services has defined an economic downturn as a period of at least two consecutive quarters of over-the-year decreases in average monthly employment and total wages based on data from the QCEW. Wyoming has endured three such economic downturns since 2009: 2009Q1 to 2010Q1, 2015Q2 to 2016Q4, and 2020Q2 to 2021Q1 (see Figure 2). Wyoming’s most recent downturn was influenced by the COVID-19 pandemic and declines in the prices of and demand for the state’s energy resources. While each downturn had its own unique circumstances, declining energy prices preceded all three (Moore, 2019).
As illustrated in Figure 2, 2023Q4 marked the 11th consecutive quarter over-the-year growth in employment and wages in Wyoming. In addition, 2023Q4 was also the fourth consecutive quarter during which Wyoming surpassed pre-pandemic levels from 2019.
Industry
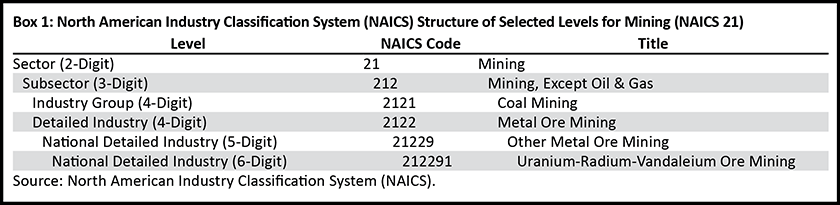
Industries are organized by the North American Industry Classification System (NAICS). A sample of the NAICS hierarchal structure for mining (NAICS 21) can be found in Box 1. This section of the article primarily discusses statewide employment and wages at the sector (or two-digit NAICS) level.
As shown in Table 3, most industries added jobs and total wages over the year. The greatest job growth was seen in construction (1,548, or 7.2%), followed by government (1,324, or 2.0%), professional & business services (498, or 2.4%), health care & social assistance (299, or 1.2%), and wholesale trade, transportation, warehousing, & utilities (269, or 1.3%).
Wyoming's mining industry, which drives the state's economy, added 228 jobs, or 1.3%. This marked the 10th consecutive quarter of over-the-year job growth in mining; however, it should be noted that 2023Q4 also marked the first time that employment decreased from the prior quarter since 2021Q1 (Research & Planning, 2024a). This is a situation worth monitoring, as mining also saw an increase in initial Unemployment Insurance claims during the first few months of 2024 (Research & Planning, 2024b).
Local government (including schools and hospitals) accounted for the largest share (16.6%) of Wyoming's total employment, followed by leisure & hospitality (12.8%), retail trade (10.9%), private health care & social assistance (9.3%), and construction (8.3%). The mining sector (including oil & gas) contributed 6.2% of the state's total jobs.
Wyoming had a record $4.3 billion in total wages in 2023Q4, an over-the-year increase of $265.8 million, or 6.6%. The greatest over-the-year increases were seen in construction ($59.9 million, or 16.1%); wholesale trade, transportation, & utilities ($27.9 million, or 7.4%); local government ($25.4 million, or 4.2%); and mining ($22.3 million, or 5.2%).
Local government contributed the greatest share (14.6%) of all wages, followed by mining (10.5%), construction (10.0%), and professional & business services (9.9%).
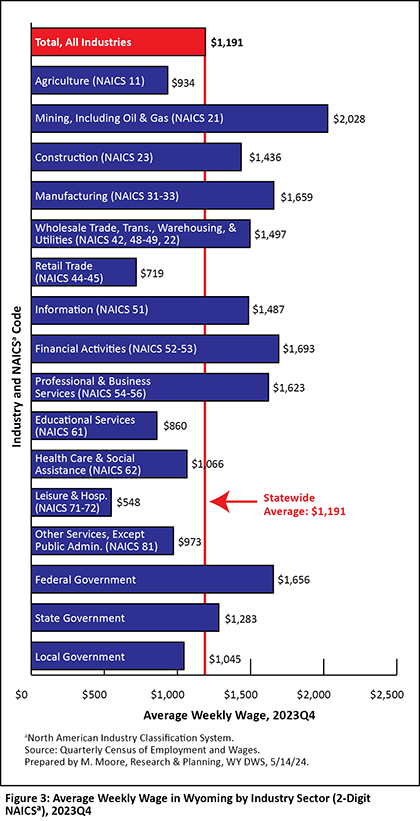
Wyoming's average weekly wage in 2023Q4 was $1,191 (see Figure 3). Average wages typically peak in fourth quarter, due to end-of-the-year bonuses and other factors. The highest wages were seen in mining, including oil & gas ($2,028), financial activities ($1,693), manufacturing ($1,659), federal government ($1,656), and professional & business services ($1,623). The lowest wages were found in leisure & hospitality ($548) and retail trade ($719).
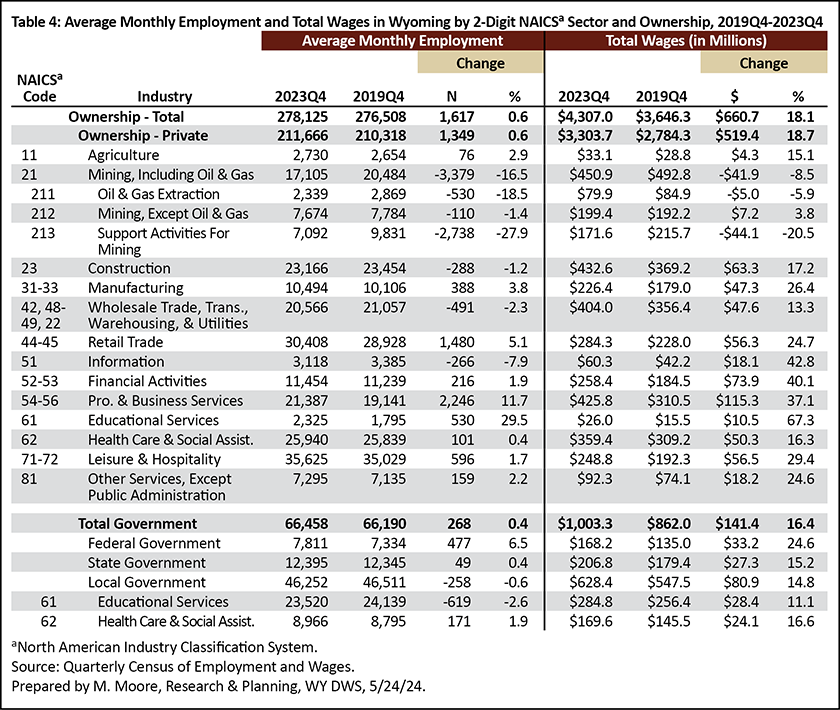
As previously mentioned, Wyoming's average monthly employment of 278,125 in 2023Q4 was 1,617 jobs (0.6%) higher compared to 2019Q4 prior to the pandemic. As seen in Table 4, some industries exceeded pre-pandemic employment levels, while others still continue to lag behind. Industries that added jobs compared to 2019Q4 include professional & business services (2,246 jobs, or 11.7%), retail trade (1,480, or 5.1%), leisure & hospitality (596, or 1.7%), and private educational services (530, or 29.5%).
Wyoming's mining sector had 3,379 fewer jobs (-16.5%) in 2023Q4 compared to pre-pandemic employment in 2019Q4. Other industries that were lower than their pre-pandemic job numbers include wholesale trade, transportation, & utilities (-491, or -2.3%); construction (-288, or -1.2%); and information (-266, or -7.9%).
County
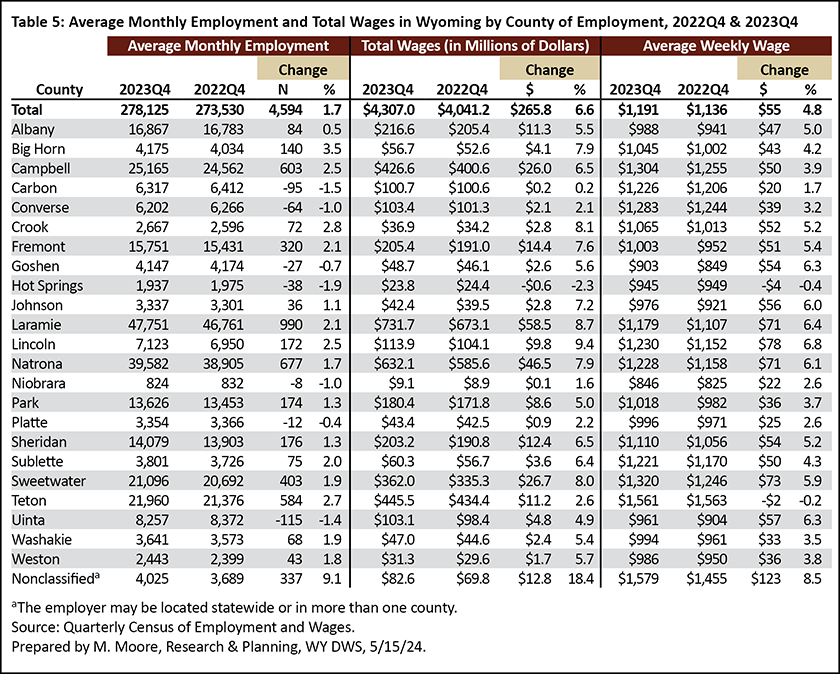
Over-the-year job growth occurred in 16 of Wyoming's 23 counties (see Table 5). Laramie County added the greatest number of jobs (990, or 2.1%), followed by Natrona (677, or 1.7%), Campbell (603, or 2.5%), Teton (584, or 2.7%), and Sweetwater (403, or 1.9%) counties. Six counties lost jobs over the year, including Uinta (-115, or -1.4%), Carbon (-95, or -1.5%), and Converse (-64, or -1.0%) counties.
The counties with the greatest over-the-year growth in total wages were Laramie ($58.5 million, or 8.7%), Natrona ($46.5 million, or 7.9%), Sweetwater ($26.7 million, or 8.0%), and Campbell ($26.0 million, or 6.5%). Hot Springs County (-$565,348, or -2.3%) was the only county with a decline in total wages.
Teton County had the highest average weekly wage in 2023Q4 ($1,561), due in large part to high weekly wages in industries such as management of companies & enterprises ($8,242) and finance & insurance ($7,166). Many of the other counties with the highest weekly wages were those with greater concentrations of high-paying mining jobs, such as Sweetwater ($1,320), Campbell ($1,304), and Converse ($1,283).
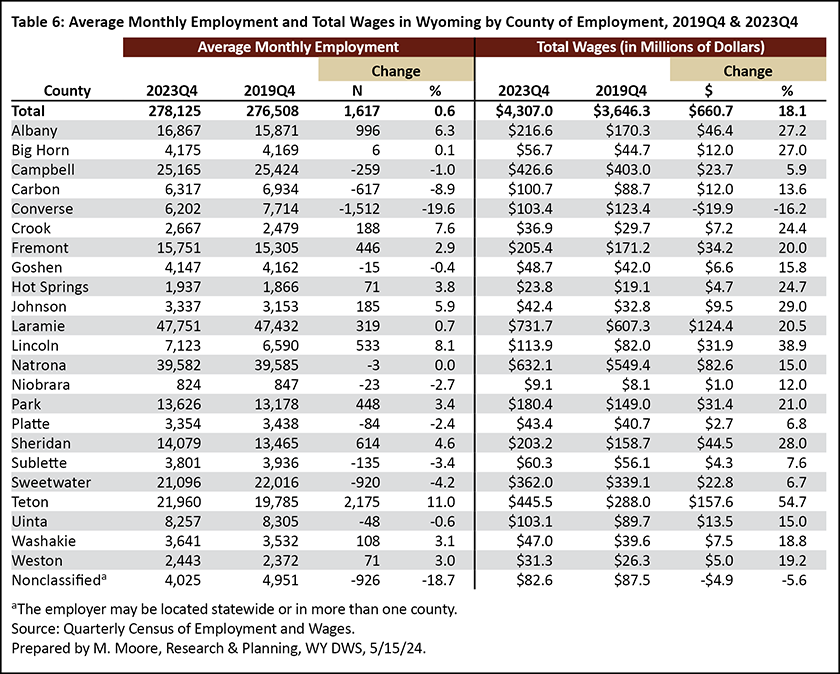
As shown in Table 6, Teton County saw the greatest job growth from 2019Q4 to 2023Q4, as average monthly employment increased from 19,785 to 21,960 (2,175, or 11.0%). Teton County experienced substantial job growth across a variety of industries during that period, including construction, leisure & hospitality, and professional & business services. Albany County added 996 jobs from 2019Q4 to 2023Q4, with job growth driven by professional & business services, educational services, and leisure & hospitality. Converse County lost 1,512 jobs over this period, due in large part to the completion of large scale construction projects.
A Detailed Look at Wyoming's Construction Industry
As previously mentioned, Wyoming's construction sector added the greatest number of jobs from 2022Q4 to 2023Q4. This section takes an in-depth look at the construction industry, from the subsector to the detailed industry level, to identify particular areas of job growth. In addition, this section looks at construction by sub-state region to determine where growth is occurring around the state.
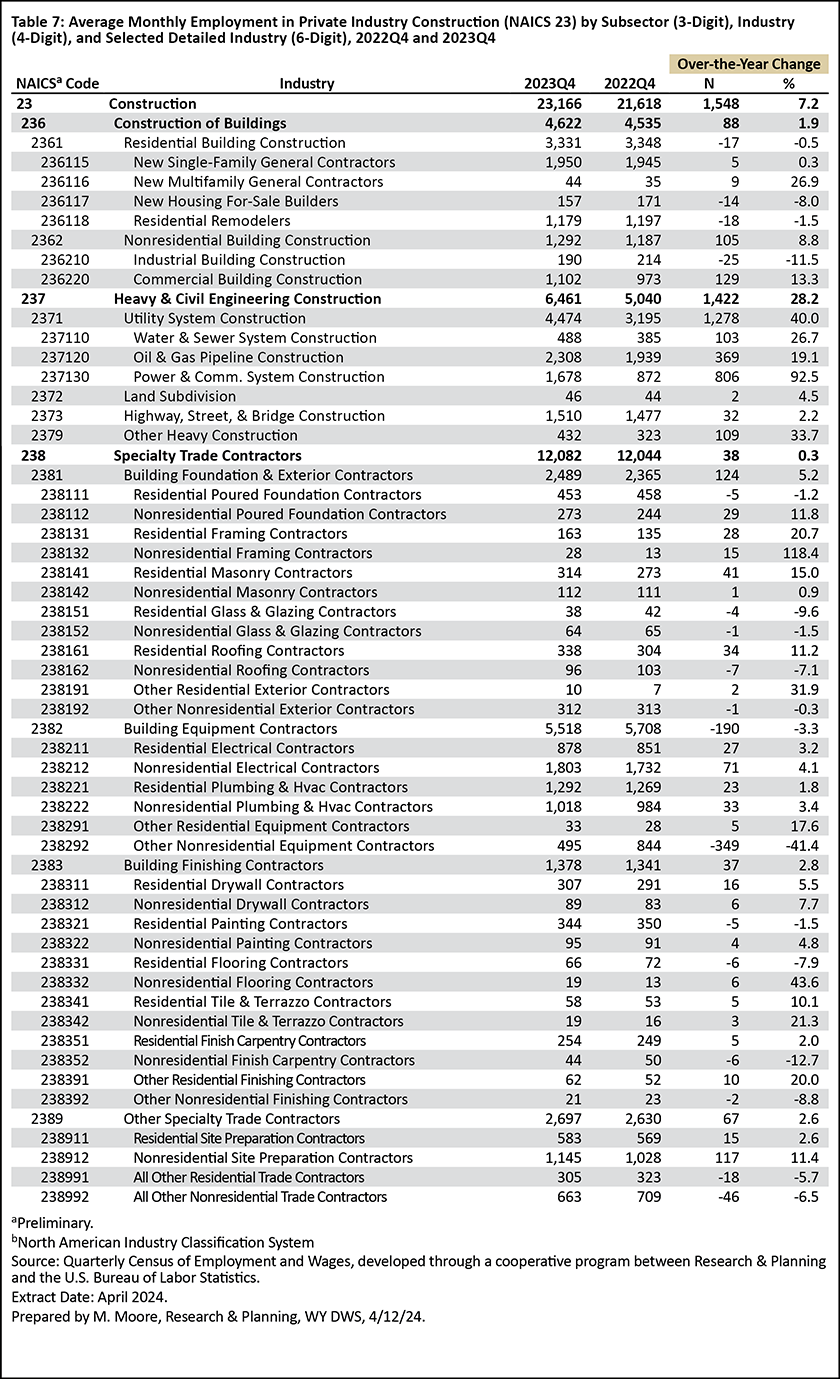
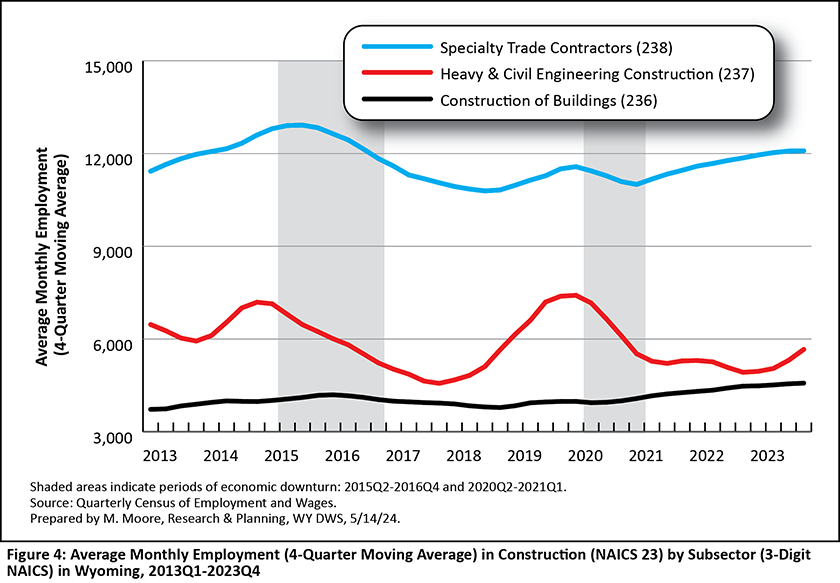
Construction comprises three subsectors: construction of buildings (NAICS 236), heavy & civil engineering construction (NAICS 237), and specialty trade contractors (NAICS 238). Employment in the construction of buildings subsector increased from 4,535 in 2022Q4 to 4,622 in 2023Q4 (88 jobs, or 1.9%; see Table 7). Within this subsector, the greatest growth was seen in nonresidential building construction, particularly commercial building construction (129 new jobs, or 13.3%)
Heavy & civil engineering construction added more than 1,400 jobs, as employment increased from 5,040 to 6,461. This is the subsector that adds temporary jobs when large-scale projects begin, such as oil & gas pipeline construction and water & sewer system construction. When projects are completed, these temporary jobs go away.
Finally, specialty trade contractors accounts for the greatest number of jobs in the construction industry, with 12,082 in 2023Q4. Overall, this subsector experienced little change over the year, adding just 38 jobs, a 0.3% increase. However, much more activity takes place within the detailed industries of this subsector. For example, building foundation & exterior contractors added 124 jobs (5.2%), with growth in areas such as residential masonry contractors, residential roofing contractors, and nonresidential poured foundation contractors, among others. In contrast, building equipment contractors lost 190 jobs, with especially prominent job losses in other nonresidential equipment contractors.
Figure 4 uses four-quarter moving averages to show the differences in employment in the three construction subsectors over the last 10 years. Employment in construction of buildings remained relatively flat, with steady increases since the end of the most recent economic downturn. Heavy & civil engineering construction shows the greatest fluctuation, with a noticeable increase in 2018 and 2019. Finally, employment in specialty trade contractors has fluctuated, with consistent growth over the last two years.
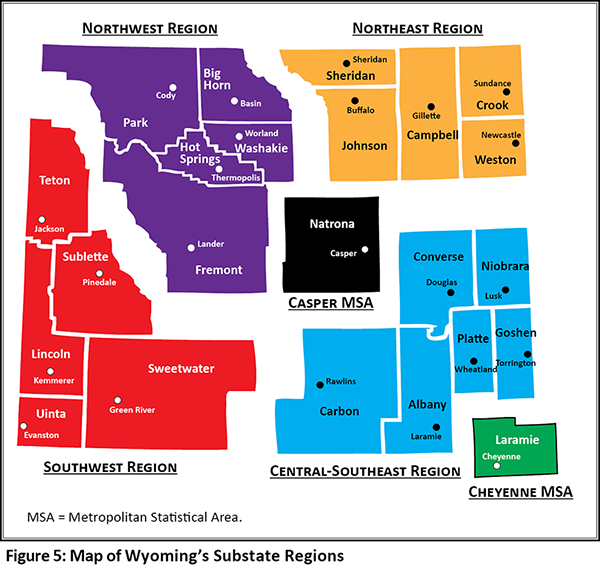
This section discusses construction employment by sub-state region. As illustrated in Figure 5, Wyoming is divided into two metropolitan statistical areas (MSAs) in Casper and Cheyenne, along with four other substate regions. The region labeled as other refers to employers with jobs spread across several areas.
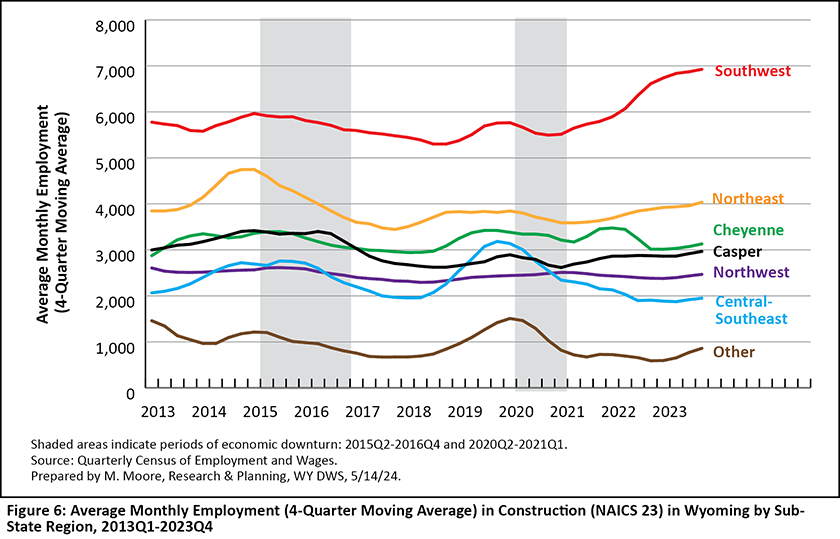
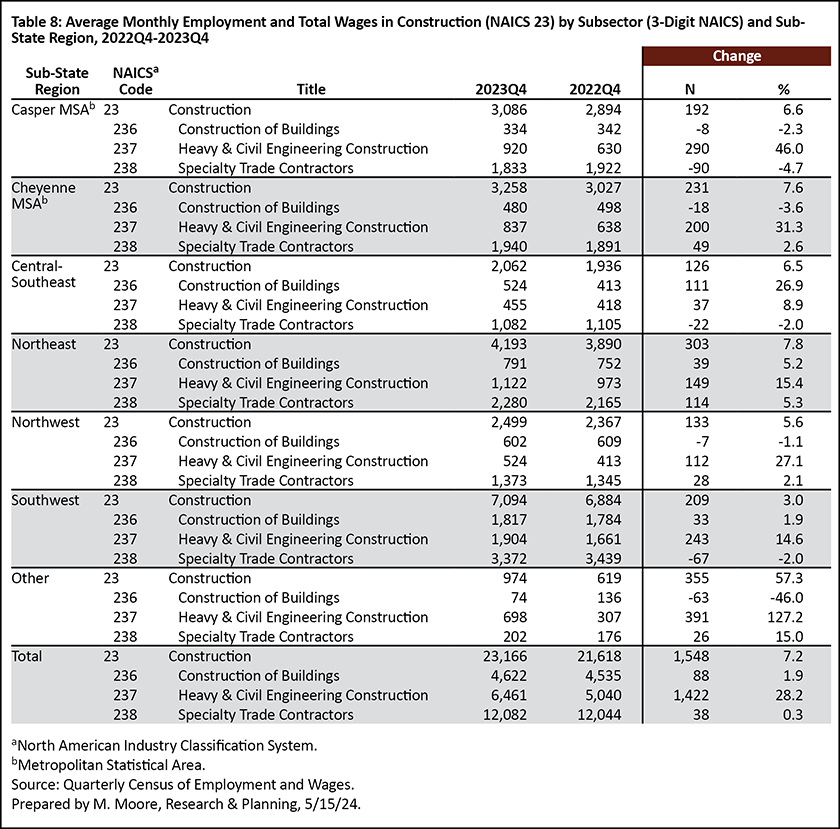
Over the last 10 years, Wyoming's southwest region has led all other regions in construction employment (see Figure 6). This is consistent with recent research by Halama (2024), who noted that the southwest region led all others in new business formation, particularly new construction businesses. The southwest region includes Lincoln, Sublette, Sweetwater, Teton, and Uinta counties, and has seen particularly strong construction growth since the end of the most recent economic downturn, and from 2022Q4 to 2023Q4 added 209 new construction jobs (see Table 8). Strong job growth was particularly seen in heavy & civil engineering construction (243 jobs, or 14.6%).
Construction employment in the northeast region peaked prior to the 2015-2016 economic downturn. While employment has not returned to those levels, the northeast region added the greatest number of construction jobs over the year (303, or a 7.8% increase) of all regions. The northeast region includes Campbell, Crook, Johnson, Sheridan, and Weston counties.
While most regions saw the greatest job growth in heavy & civil engineering construction, most of the construction job growth in the central-southeast region was in construction of buildings (111 new jobs, or a 26.9% increase). The central-southeast region is made up of Albany, Carbon, Converse, Goshen, Niobrara, and Platte counties.
Job Growth in Surrounding States
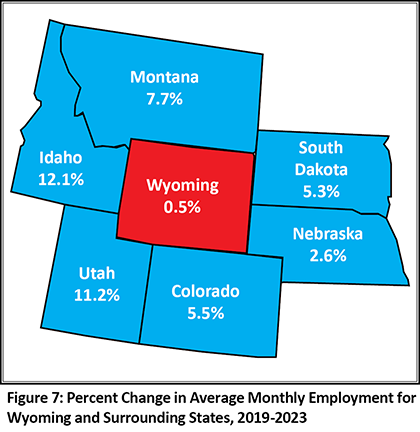
As previously mentioned, Wyoming returned to pre-pandemic employment levels in 2023. However, it is worth noting that Wyoming continues to lag behind surrounding states when it comes to post-pandemic job growth. Annual QCEW data show that Wyoming's average monthly employment increased by just 0.5% from 2019 to 2023 (see Figure 7). However, states like Idaho and Utah saw employment increases of 12.1% and 11.2%, respectively.
Part of the discrepancy lies in the fact that Wyoming's mining sector lost nearly 3,700 jobs from 2019 to 2023. In contrast, Idaho has seen substantial growth for most industries, most notably construction, health care & social assistance, and professional, scientific, & technical services (Moore, 2024). Utah saw a substantial increase in those same industries, along with job growth in manufacturing and accommodation & food services.
Conclusion
Fourth quarter 2023 marked the 11th consecutive quarter of over-the-year job growth for Wyoming, as the state added nearly 4,600 jobs and $265.8 million in total wages. Particularly strong job growth continued for construction, which added more than 1,500 jobs and $59.9 million in total wages. Other industries with over-the-year job growth included professional & business services, health care & social assistance, and mining, including oil & gas.
Fourth quarter 2023 was also the fourth consecutive quarter in which Wyoming returned to pre-pandemic employment levels from 2019. However, Wyoming continues to lag behind its neighboring states in recovering from pandemic job losses.
Quarterly employment and wage data for Wyoming from the QCEW are available online at https://doe.state.wy.us/LMI/toc_202.htm. Data for first quarter 2024 will be released on August 9, 2024, with a feature article planned for the October 2024 issue of Wyoming Labor Force Trends.
References
Halama, M. (2024, February). Wyoming new business formation in 2021 and 2022. Wyoming Labor Force Trends, 61(2). Research & Planning, WY DWS. Retrieved June 12, 2024, from https://doe.state.wy.us/LMI/trends/0224/a1.htm
Moore, M. (2019, May). Chapter 1: Introduction — Driven by demographics and downturns: Wyoming’s 2018 labor market at a glance. 2019 Wyoming Workforce Annual Report. Research & Planning, WY DWS. Retrieved June 12, 2024, from https://doe.state.wy.us/LMI/annual-report/2019/2019_Annual_Report.pdf
Moore, M. (2024, June). Wyoming's labor market in 2024. Research & Planning, WY DWS. Retrieved June 12, 2024, from https://doe.state.wy.us/LMI/presentations.htm
Research & Planning. (2024a, May). Wyoming QCEW summary statistics by industry, 2001-2023: Mining, including oil & gas. Retrieved May 17, 2024, from https://doe.state.wy.us/LMI/QCEW_OTY/mining_OTY.htm
Research & Planning. (2024b, May 15). Wyoming Unemployment Insurance claims statistics by industry in North American Industry Classification System (NAICS). Retrieved May 17, 2024, from https://doe.state.wy.us/LMI/UI/NAICS_Statewide_Initial.htm

 Hire Wyo
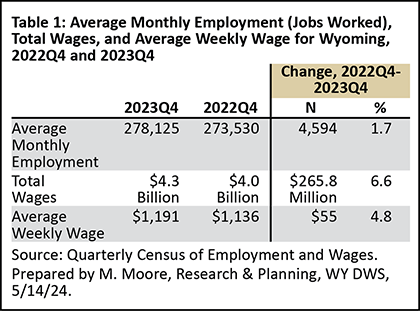