Wyoming Labor Force Trends
July 2023 | Volume 60, No. 7
Click Here for PDF
Return to Table of Contents
2022Q4 Quarterly Update
Mining Adds Nearly 1,500 Jobs, $39 Million in Total Wages
by: Michael Moore, Research Supervisor
This article provides an overview of Wyoming’s employment and wages in fourth quarter 2022, as the state saw over-the-year increases in employment and wages for the seventh consecutive quarter. The data presented in this article are from the Quarterly Census of Employment and Wages, available online at https://doe.state.wy.us/LMI/toc_202.htm.
This article provides an overview of Wyoming’s employment and wages in fourth quarter 2022, as the state saw over-the-year increases in employment and wages for the seventh consecutive quarter. The data presented in this article are from the Quarterly Census of Employment and Wages, available online at https://doe.state.wy.us/LMI/toc_202.htm.
Wyoming added more than 5,000 jobs and $58.8 million in total wages over the year in fourth quarter 2022 (2022Q4) as the state continued to recover from its most recent economic downturn (see Table 1). While total employment has not yet returned to pre-pandemic levels, 2022Q4 marked the seventh consecutive quarter of over-the-year growth in employment and total wages.
This article compares data from 2022Q4 to data from the prior year at the industry and county levels in order to obtain a better understanding of how different industries and counties are recovering from economic disruptions caused by the COVID-19 pandemic and job losses in the energy sector.
The data in this article are from the Quarterly Census of Employment and Wages (QCEW). Data from 2022Q4 are available at https://doe.state.wy.us/LMI/22Q4_QCEW/toc.htm.
Wyoming’s average monthly employment in 2022Q4 was 272,931, an increase of 5,292 jobs (2.0%) compared to 2021Q4 (see Table 2). The state had $4.0 billion in total wages, up $58.8 million (1.5%) over the year. Wyoming's average weekly wage dropped slightly from $1,143 to $1,137 (-$6, or -0.5%).
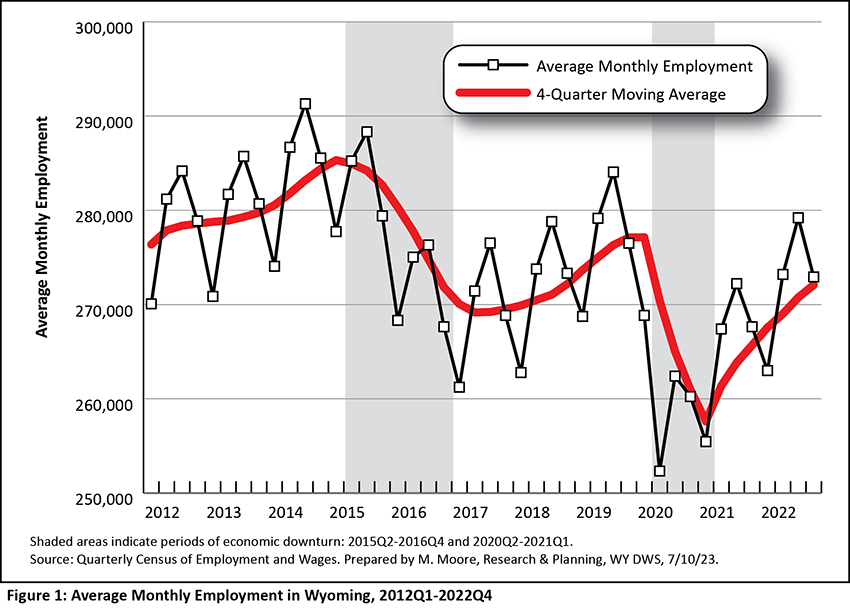
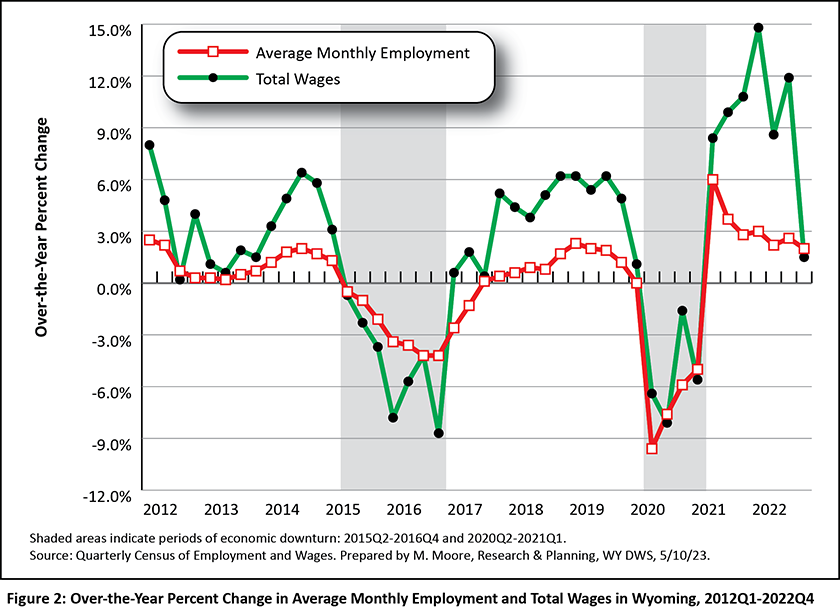
Wyoming employment typically dips during the fourth quarter after peaking in the warm summer months during the two prior quarters (see Figure 1). The shaded areas in Figure 1 and Figure 2 and other figures in this article represent periods of economic downturn. The Research & Planning (R&P) section of the Wyoming Department of Workforce Services has defined an economic downturn as a period of at least two consecutive quarters of over-the-year decreases in average monthly employment and total wages based on data from the QCEW. Wyoming has endured three such economic downturns since 2009: 2009Q1 to 2010Q1, 2015Q2 to 2016Q4, and 2020Q2 to 2021Q1.
Wyoming’s most recent downturn was influenced by the COVID-19 pandemic and declines in the prices of and demand for the state’s energy resources. While each downturn had its own unique circumstances, declining energy prices preceded all three (Moore, 2019).
As previously mentioned, Wyoming has not returned to pre-pandemic employment levels. In 2022Q4, Wyoming had 3,577 fewer jobs (-1.3%) compared to 2019Q4 (see Table 2).
Industries are organized by the North American Industry Classification System (NAICS). A sample of the NAICS hierarchal structure for mining (NAICS 21) can be found in Box 1.
Table 3 shows employment and wages at the two-digit sector level. Most industries showed substantial over-the-year employment gains, led by mining, including oil & gas (1,454 more jobs, or 9.4%), leisure & hospitality (798, or 2.3%), professional & business services (728, or 3.6%), and manufacturing (509, or 5.1%). Nearly all industries showed over-the-year job growth, with the exception of construction (-153, or -0.7%) and agriculture (-51, or -1.9%).
State government lost 113 jobs (-0.9%), while federal government gained 26 (0.4%). Local government showed noticeable growth, adding 733 jobs (1.6%).
This article provides detailed employment and wage information on Wyoming's mining sector, which is a key factor in the strength of the state's economy. In addition, the article also looks at local government and identifies which industries within local government saw the greatest job growth.
Similar tables and figures are available for each industry at https://doe.state.wy.us/LMI/QCEW_OTY/toc.htm.
Across all industries, Wyoming's average weekly wage in 2022Q4 was $1,137 (see Figure 3). The highest weekly wages were found in mining, including oil & gas ($1,954), financial activities ($1,658), federal government ($1,536), and professional & business services ($1,511). The industries with the lowest average weekly wages were leisure & hospitality ($510), retail trade ($695), and educational services ($833).
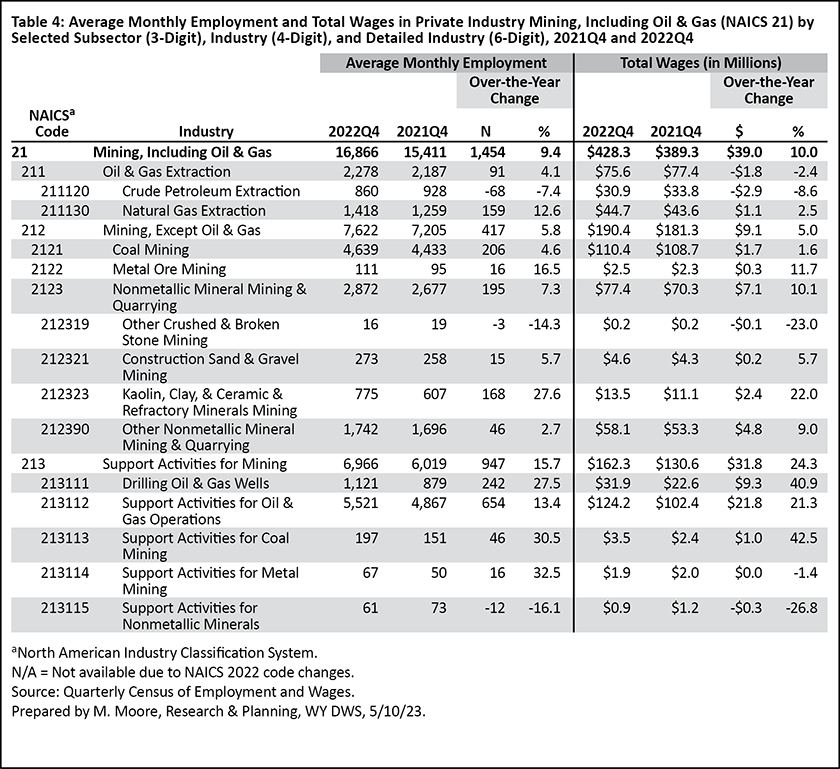
Mining, Including Oil & Gas (NAICS 21)
As previously mentioned, Wyoming's recent downturns were preceded by declining energy prices and driven by job losses in mining. While employment in Wyoming's mining sector has not returned to pre-pandemic levels, over-the-year job growth has been seen for the last six quarters (see Figure 4 and Figure 5).
Wyoming's mining sector (NAICS 21) is comprised of three subsectors (see Table 4): oil & gas extraction (NAICS 211), mining, except oil & gas (NAICS 212), and support activities for mining (NAICS 213). All three subsectors added jobs from 2021Q4 to 2022Q4.
Overall, Wyoming's mining sector added 1,454 jobs from 2021Q4 to 2022Q4, an increase of 9.4%. Of the three subsectors, the greatest over-the-year employment increase was found in support activities for mining (947 new jobs, or 15.7%). Within this subsector, the largest job growth occurred in support activities for oil & gas operations (654, or 13.4%), drilling oil & gas wells (242, or 27.5%), and support activities for coal mining (46, or 30.5%).
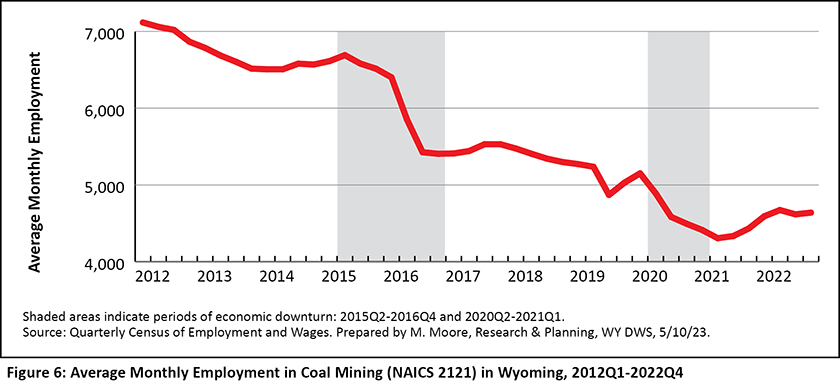
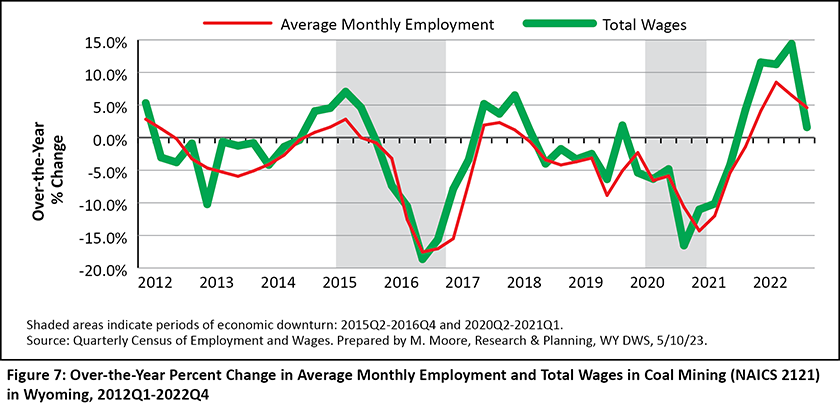
Mining, except oil & gas added 417 new jobs over the year, an increase of 5.8%. This subsector includes coal mining, which added 206 new jobs, an increase of 4.6%. In fact, 2022Q4 marked the fourth consecutive quarter of over-the-year job growth in coal mining (see Figure 6 and Figure 7). The last time coal mining experienced four consecutive quarters of over-the-year job growth was from 2011Q3 to 2012Q2 (Research and Planning, 2023a).
Oil & gas extraction added 91 jobs over the year, a 4.1% increase. Job gains in natural gas extraction were partially offset by job losses in crude petroleum extraction.
Mining has historically contributed more wages to the statewide total than any other industry. For example, Bullard (2015) noted that in 2015Q1, mining paid 19.0% of the state's total wages, or approximately $1 of every $5 of total payroll. However, total wages in mining have decreased substantially since the 2015-2016 economic downturn. Total wages in mining peaked at $637.4 million in 2014Q4, and fell to a decade low of $310.8 million in 2020Q3 (Research and Planning, 2023b). In 2022Q4, mining's total wages of $428.3 million accounted for 10.6% to the state's total wages, or approximately $1 of every $10 of total payroll.
As previously mentioned, mining had the highest average weekly wage of all industries in 2022Q4 ($1,954 compared to $1,137 across all industries). High wages in mining have remained consistent over the last decade.
Local Government
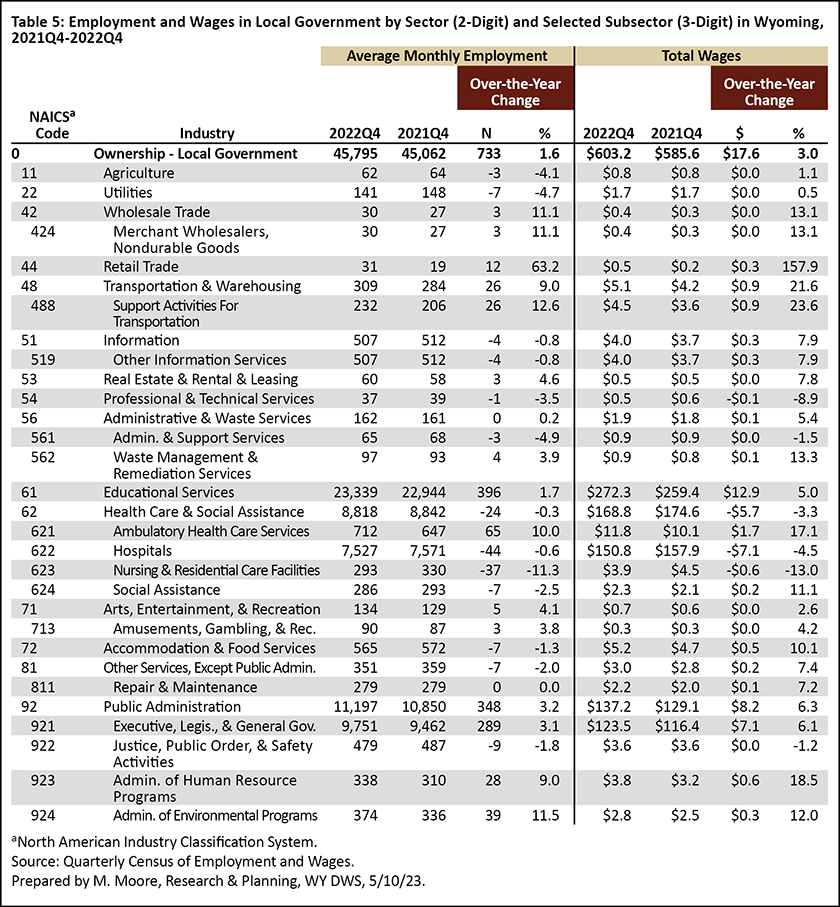
Local government is comprised of employment and wages in Wyoming's counties, cities, towns, school districts, community colleges, tribal governments, and other municipalities. A variety of industries and services can be found within local government in Wyoming, from public administration, schools, and hospitals to accommodation & food services and transportation & warehousing (see Table 5).
In 2022Q4, there were 45,795 jobs and $603.2 million in total wages in local government in Wyoming (see Table 5). Over the year, local government added 733 jobs (1.6%) and $17.6 million (3.0%) in total wages. Local government contributed 16.8% of all jobs and 14.9% of the state's total wages.
Approximately half of all jobs in local government were found in educational services (23,339). Public administration and health care & social assistance also contributed a large number of jobs in local government (11,197 and 8,818, respectively).
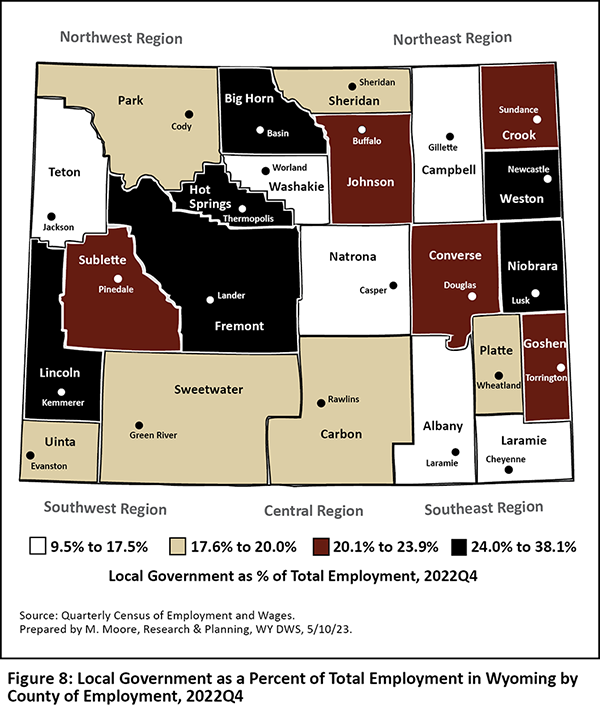
Local government often represents a smaller share of total employment in Wyoming's most populous counties and larger share of total employment in less populous rural counties. For example, local government accounted for approximately one in 10 jobs in Albany (9.5%), Teton (10.6%), and Natrona (11.1%) counties in 2022Q4, but approximately one in three jobs in Niobrara (38.1%), Fremont (29.4%), and Big Horn (29.4%) counties (see Figure 8).
A seasonal trend can be seen in local government employment, as employment dips noticeably each year during the third quarter before picking up again in the fourth quarter (see Figure 9). This is largely due to public schools being closed during the summer months.
As illustrated in Figure 8 and Figure 9, local government employment fell substantially during the recent Covid-related economic downturn. Employment has remained steady over the last two years, but has not returned to pre-pandemic levels.
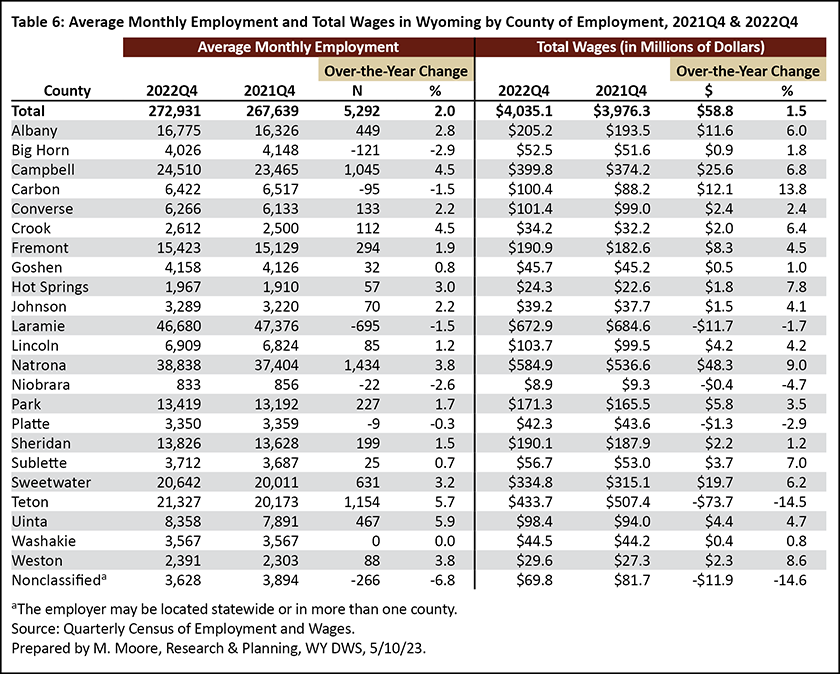
All but six of Wyoming's 23 counties experienced over the-year job growth in 2022Q4 (see Table 6). The counties with the greatest increases in average monthly employment included Natrona (1,434, or 3.8%), Teton (1,154, or 5.7%), Campbell (1,045, or 4.5%), and Sweetwater (631, or 3.2%).
Laramie County saw the greatest over-the-year job losses (-695, or -1.5%), followed by Big Horn (-121, or -2.9%) and Carbon (-95, or -1.5%) counties. The decline in employment in Laramie County was largely due to job losses in construction (Research and Planning, 2023c).
Of Wyoming's 23, counties, 19 saw over-the-year increases in total wages. The greatest increases were seen in Natrona ($48.3 million, or 9.0%), Campbell ($25.6 million, or 6.8%), Sweetwater ($19.7 million, or 6.2%), and Carbon ($12.1 million, or 13.8%). The substantial decrease in total wages in Teton County was "related to large bonuses paid in fourth quarter 2021, but not repeated in 2022" (Bullard, 2023).
Wyoming added more than 5,000 jobs and nearly $60 million in total wages from 2021Q4 to 2022Q4, marking the state's seventh consecutive quarter of over-the-year job growth. The industries that added the most jobs included mining, leisure & hospitality, professional & business services, and manufacturing.
Quarterly employment and wage data for Wyoming from the QCEW are available online at https://doe.state.wy.us/LMI/toc_202.htm. Data for 2023Q1 will be released on August 3, 2023, with a feature article planned for the October 2023 issue of Wyoming Labor Force Trends.
References
Bullard, D. (2015). Local jobs and payroll in Wyoming in First Quarter 2015: Job losses appear in the oil & gas sector. Wyoming Labor Force Trends, 10(52). Research & Planning, WY DWS. Retrieved June 21, 2023, from https://doe.state.wy.us/LMI/trends/1015/1015.pdf
Bullard, D. (2023, May). Wyoming employment and payroll: Strong job growth in the mining sector in fourth quarter 2022. Research & Planning, WY DWS. Retrieved June 21, 2023, from https://doe.state.wy.us/LMI/QCEW/22Q4.pdf
Moore, M. (2019, May). Chapter 1: Introduction — Driven by demographics and downturns: Wyoming’s 2018 labor market at a glance. 2019 Wyoming Workforce Annual Report. Research & Planning, WY DWS. Retrieved June 21, 2023, from https://doe.state.wy.us/LMI/annual-report/2019/2019_Annual_Report.pdf
Research & Planning. (2023a, April). Wyoming QCEW summary statistics by industry, 2001-2022 — coal mining. Retrieved June 21, 2023, from https://doe.state.wy.us/LMI/QCEW_OTY/coal_mining_OTY.htm
Research & Planning. (2023b, April). Wyoming QCEW summary statistics by industry, 2001-2022 — mining. Retrieved June 21, 2023, from https://doe.state.wy.us/LMI/QCEW_OTY/mining_OTY.htm
Research & Planning. (2023c, April). Wyoming Quarterly Census of Employment and Wages (QCEW), fourth quarter 2022 — Laramie County. Retrieved June 21, 2023, from https://doe.state.wy.us/LMI/22Q4_QCEW/t15.htm

 Wyoming at Work