"Labor Market Information (LMI) is an applied science; it is the systematic collection and analysis of data which describes and predicts the relationship between labor demand and supply."
The States' Labor Market Information Review, ICESA, 1995, p. 7.
2022 Wyoming Workforce Annual Report
The Federal Government reserves a paid-up, nonexclusive and irrevocable license to reproduce, publish or otherwise use, and to authorize others to use for federal purposes: i) the copyright in all products developed under the grant, including a subgrant or contract under the grant or subgrant; and ii) any rights of copyright to which the recipient, subrecipient or a contractor purchases ownership under an award (including but not limited to curricula, training models, technical assistance products, and any related materials). Such uses include, but are not limited to, the right to modify and distribute such products worldwide by any means, electronically or otherwise. Federal funds may not be used to pay any royalty or license fee for use of a copyrighted work, or the cost of acquiring by purchase a copyright in a work, where the Department has a license or rights of free use in such work, although they may be used to pay costs for obtaining a copy which is limited to the developer/seller costs of copying and shipping. If revenues are generated through selling products developed with grant funds, including intellectual property, these revenues are program income. Program income must be used in accordance with the provisions of this grant award and 2 CFR 200.307.
This article provides an overview of Wyoming’s employment and wages in fourth quarter 2021, as the state saw over-the-year increases in employment and wages for the third consecutive quarter. The data presented in this article are from the Quarterly Census of Employment and Wages, available online at https://doe.state.wy.us/LMI/toc_202.htm.
Fourth quarter 2021 (2021Q4) marked the third consecutive quarter of over-the-year growth in average monthly employment and total wages in Wyoming as the state continued to recover from its most recent economic downturn. Wyoming added more than 7,000 jobs and $382.5 million in total wages from 2020Q4 to 2021Q4 (see Table 1).
This article compares data from 2021Q4 to data from the prior year at the industry and county levels. In addition, this article also compares current employment and wages to pre-pandemic years. This analysis helps provide a better understanding of how different industries and counties are recovering from economic disruptions caused by the COVID-19 pandemic and job losses in the energy sector.
Wyoming’s average monthly employment in 2021Q4 was 267,251, an increase of 7,017 jobs (2.7%) compared to 2020Q4 (see Table 2). Total wages increased from $3.6 billion to $4.0 billion over the year ($382.5 million, or 10.7%).
Wyoming’s average weekly wage in 2021Q4 was $1,143, compared to $1,061 the prior year ($82, or 7.8%). Wages are often highest in fourth quarter due to end-of-the year bonuses.
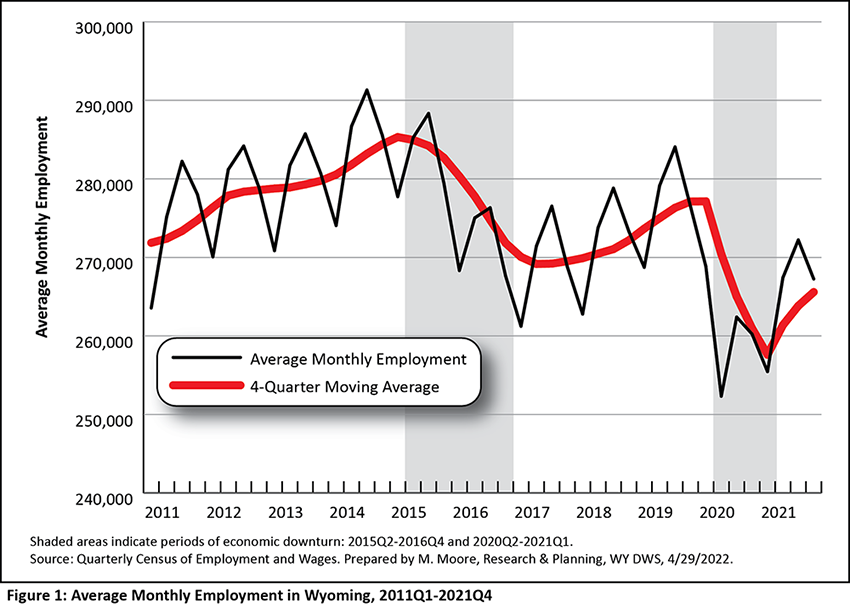
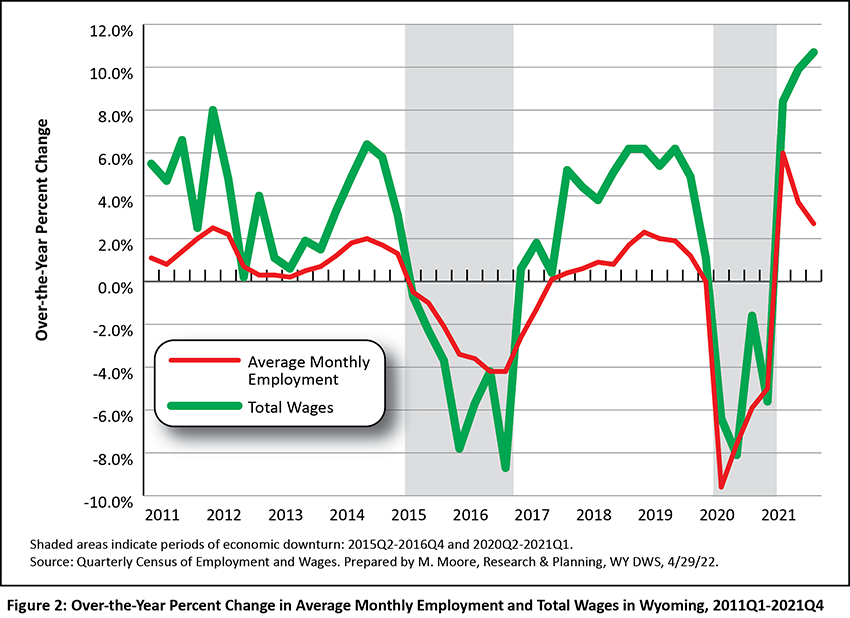
Since 2009, Wyoming has endured three periods of economic downturn, defined by the Research & Planning (R&P) section of the Wyoming Department of Workforce Services as a period of at least two consecutive quarters of over-the-year decrease in average monthly employment and total wages based on data from the QCEW (see Figure 1 and Figure 2). The two prior downturns occurred from 2009Q1 to 2010Q1 and from 2015Q2 to 2016Q4.
Wyoming’s most recent downturn was driven by the COVID-19 pandemic and declines in the prices of and demand for the state’s energy resources, and lasted from 2020Q2 (the pandemic started in March 2020, just prior to second quarter) to 2021Q1. All three recent economic downturns were preceded by declining energy prices (Moore, 2019a).
Wyoming’s average monthly employment remained substantially lower compared to pre-pandemic levels despite recent job gains. Wyoming had 9,257 fewer jobs (-3.3%) compared to the 2019Q4 average monthly employment of 276,508. However, statewide total wages of $4.0 billion surpassed the 2019Q4 total of $3.6 billion ($324.0 million, or 8.9%).
Industries
Industries are organized by the North American Industry Classification System (NAICS). A sample of the NAICS hierarchal structure for mining (NAICS 21) can be found in Box 1.
Employment and wages at the two-digit sector level are shown in Table 3. Most industries showed substantial over-the-year gains in employment, with the greatest increases seen in leisure & hospitality (2,555, or 8.0%), professional & business services (1,289, or 6.9%), construction (945, or 4.6%) and mining, including oil & gas (840, or 5.8%). There were relatively few job losses in Wyoming's private sector, including health care & social assistance (-226, or -0.9%) and agriculture (-21, or -0.8%). Employment in total government fell by 614 jobs (-0.9%), with job losses seen in federal, state, and local government.
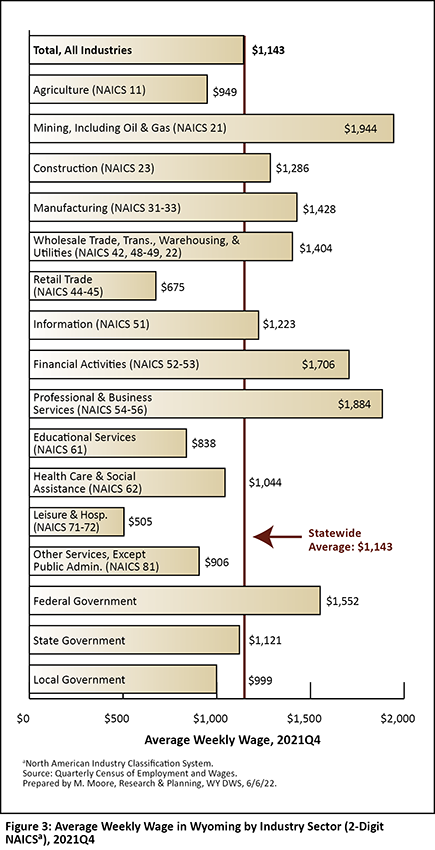
The private industries with the highest average weekly wage in 2021Q4 included mining ($1,944), professional & business services ($1,884), and financial activities ($1,706; see Figure 3). The lowest average wages were found in leisure & hospitality ($505) and retail trade ($675). Federal government had a higher average wage ($1,552) than state ($1,121) and local ($999) government.
In order to provide a better understanding of where job growth occurred in Wyoming in 2021Q4, more detailed tables are included in this article that show data for selected subsectors (three-digit), industry groups (four-digit), and detailed national industries (six-digit).
The industries chosen for this article were mining, construction, professional & business services, and leisure & hospitality, as these four sectors showed the greatest over-the-year employment increases of all industries.
Mining, Including Oil & Gas (NAICS 21)
As noted by Manning (2016), mining (coal, oil, and natural gas) is a “major economic engine of the Wyoming economy, both in direct employment and all industries that stem from this activity.”
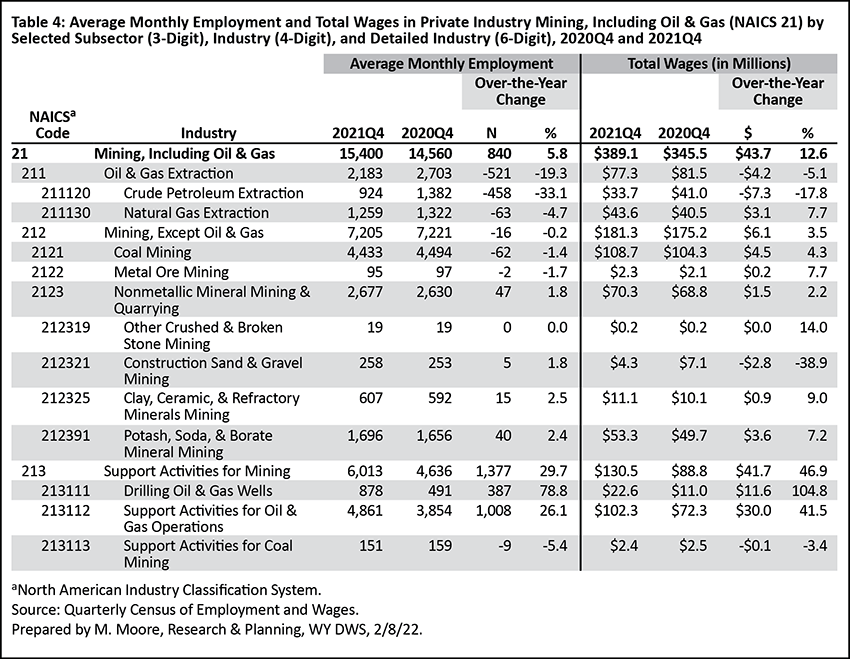
Employment in mining increased from 14,560 in 2020Q4 to 15,400 in 2021Q4 (see
Table 4).
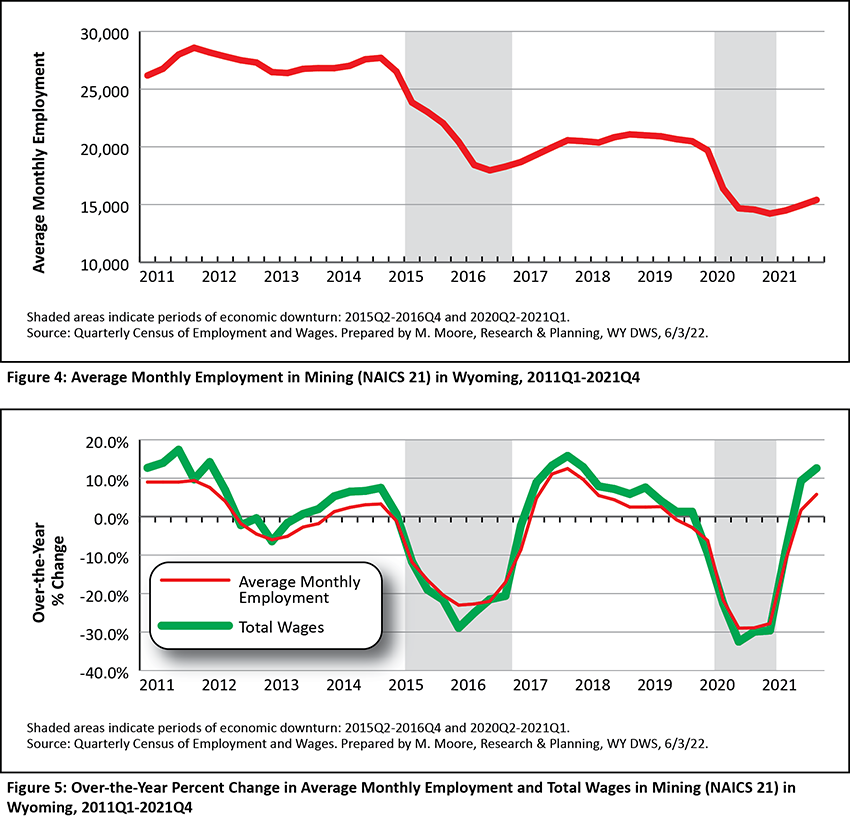
This marked just the second consecutive quarter of over-the-year increase in employment in mining since 2019Q2 (see Figures 4-5). Employment in mining dropped to historically low levels during the most recent economic downturn and remains a long way from returning to pre-pandemic levels.
Job gains in mining were primarily driven by the support activities for mining subsector, which added 1,377 jobs (29.7%). The U.S. Bureau of Labor Statistics (2022) has assigned support activities for mining the NAICS code of 213, noting the following:
"Industries in the support activities for mining subsector group establishments primarily providing support services, on a contract or fee basis, required for the mining and quarrying of minerals and for the extraction of oil and gas. Establishments performing exploration (except geophysical surveying and mapping) for minerals, on a contract or fee basis, are included in this subsector. Exploration includes traditional prospecting methods, such as taking core samples and making geological observations at prospective sites.
"The activities performed on a contract or fee basis by establishments in the Support Activities for Mining subsector are also often performed in-house by mining operators."
Within the support activities for mining subsector, the greatest job gains were seen in support activities for oil & gas operations (1,008, or 26.1%) and drilling oil & gas wells (387, or 78.8%).
Job losses were seen in mining's other two subsectors, as oil & gas extraction lost 521 jobs (-19.3%) and mining, except oil & gas lost 16 jobs (-0.2%).
Total wages in mining increased from $345.5 million in 2020Q4 to $389.1 million in 2021Q4 ($43.7 million, or 12.6%).
Mining contributed 5.8% of all jobs and 9.8% of total wages in Wyoming in 2021Q4. In comparison, in 2015Q1, just prior to the start of the previous economic downturn (2015Q2-2016Q4) mining contributed 9.6% of the state’s total employment (one in 10 jobs) and 19.0% of total wages ($1 of every $5 in payroll; Research & Planning, 2021).
Construction (NAICS 23)
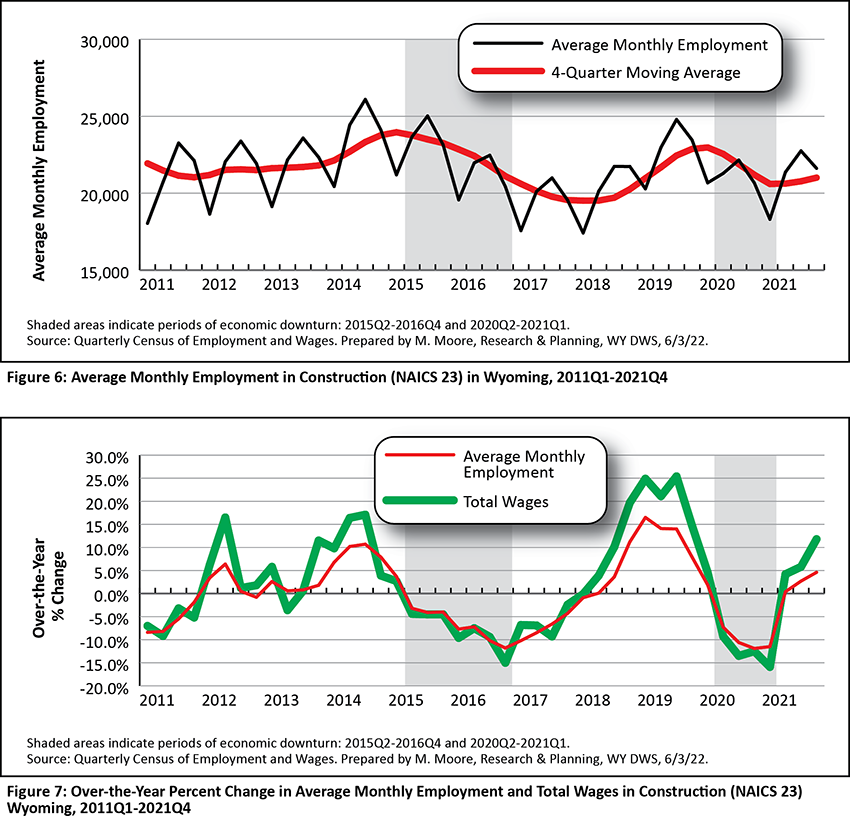
Average monthly employment in Wyoming's construction sector increased from 20,668 in 2020Q4 to 21,612 in 2021Q4 (945 jobs, or 4.6%; see Table 5).
Wyoming’s construction sector showed over-the-year job growth for the third consecutive quarter in 2021Q4 (see Figures 6 and 7). Prior to the pandemic, construction experienced substantial growth driven by temporary oil & gas pipeline construction jobs.
Over-the-year job growth was seen in all three construction subsectors in 2021Q4. Specialty trade contractors added 469 jobs (4.2%), heavy & civil engineering construction added 317 (5.9%), and construction of buildings grew by 158 (3.8%).
Total wages in construction increased from $323.1 million to $361.2 million ($38.2 million, or 11.8%). Heavy & civil engineering showed the greatest over-the-year growth in total wages ($23.6 million, or 25.2%), followed by specialty trade contractors ($7.9 million, or 4.7%).
Construction accounted for 8.1% of all jobs and 9.1% of the state’s total wages in 2021Q4, consistent with most quarters over the last 20 years (Research & Planning, 2021).
Professional & Business Services (NAICS 54-56)
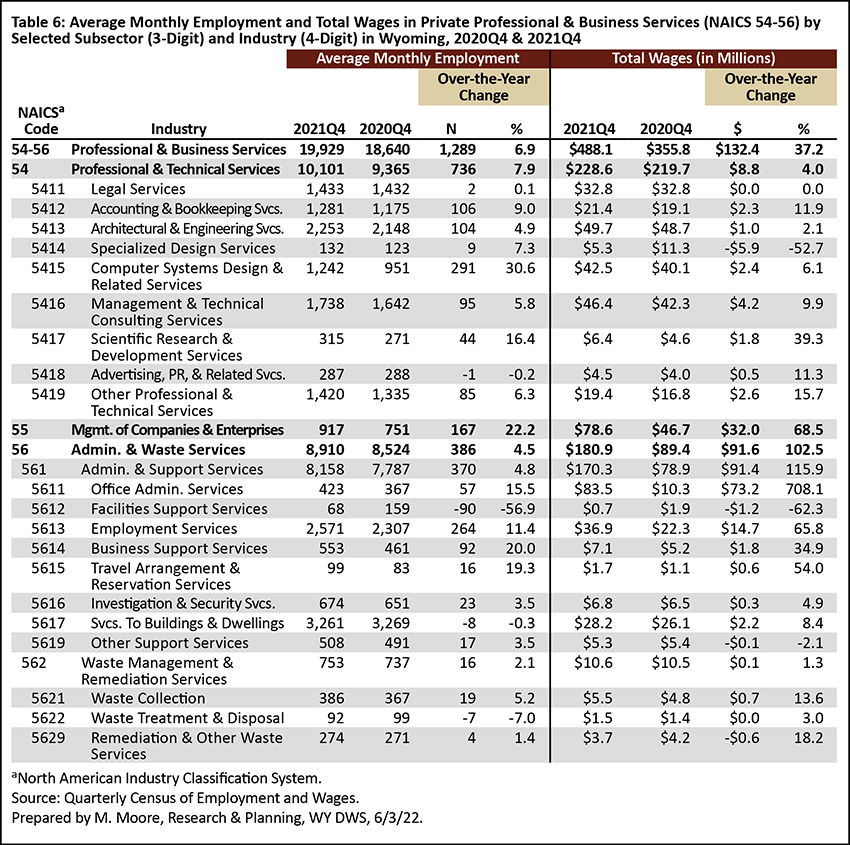
Professional & business services is a supersector comprised of three sectors: professional & technical services (NAICS 54), management of companies & enterprises (NAICS 55), and administrative & waste services (NAICS 56).
Average monthly employment increased from 18,640 in 2020Q4 to 19,929 in 2021Q4 (1,289, or 6.9%; see Table 6). This marked the second largest over-the-year increase of all industries in 2021Q4, behind leisure & hospitality.
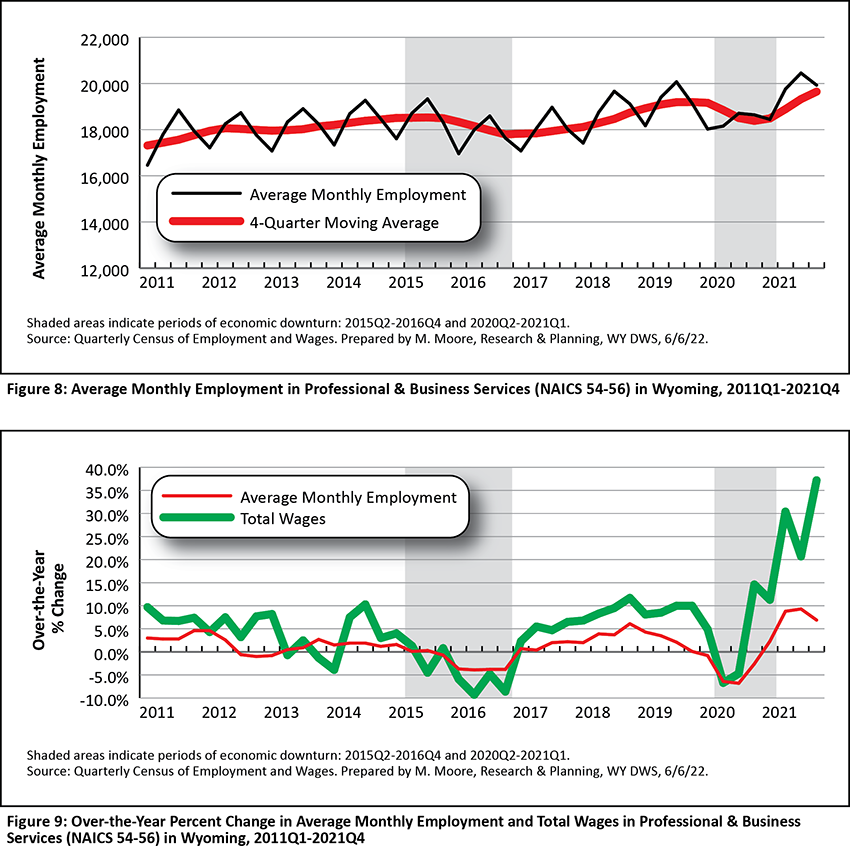
Professional & business services saw over-the-year job growth for the fourth consecutive quarter. Prior to the pandemic, professional & business services showed steady growth for 11 quarters, or nearly three years, from 2017Q2 to 2019Q4 (see Figures 8 and 9). Average monthly employment in professional & business services was higher than at any other point over the last 20 years in 2021Q3, but decreased slightly in 2021Q4 (Research & Planning, 2021).
Job growth was seen in all three sectors. Professional & technical services added 736 jobs, or 7.9%. Within this sector, computer systems design & related services grew by 30.6%, or 291 jobs. Administrative & waste services added 386 jobs (4.5%), and management of companies & enterprises added 167 jobs (22.2%).
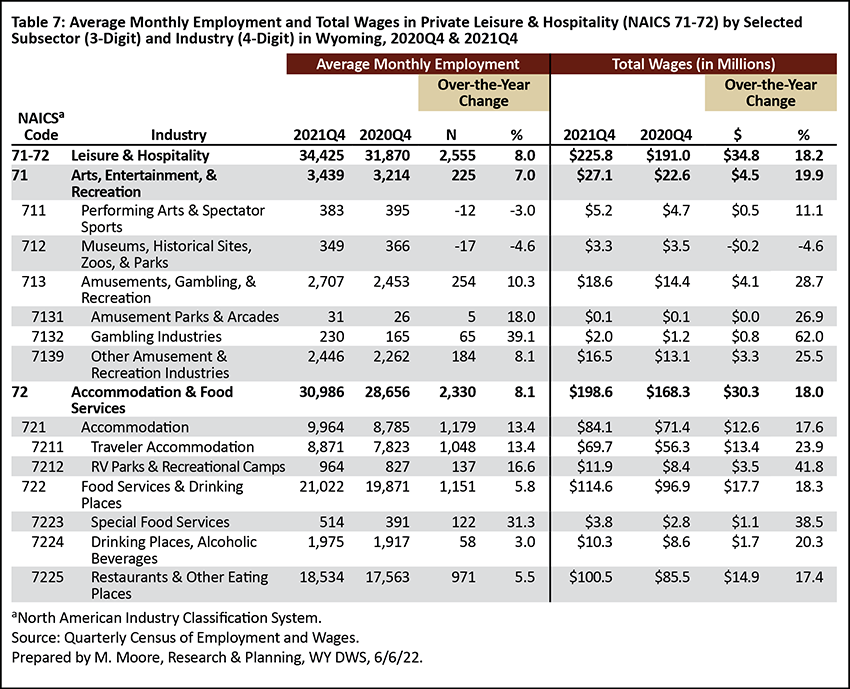
Total wages in professional & business services increased from $355.8 million to $488.1 million ($132.4 million, or 37.2%). As shown in Figure 9, total wages in professional & busines services have increased substantially over each of the last six quarters.
Professional & business services accounted for 7.5% of all jobs and 12.3% of the state’s total wages in 2021Q4. This industry has contributed an increasing percentage of Wyoming’s employment and wages over the last few years, and in 2021Q4 contributed more wages than any other sector.
Leisure & Hospitality (NAICS 71-72)
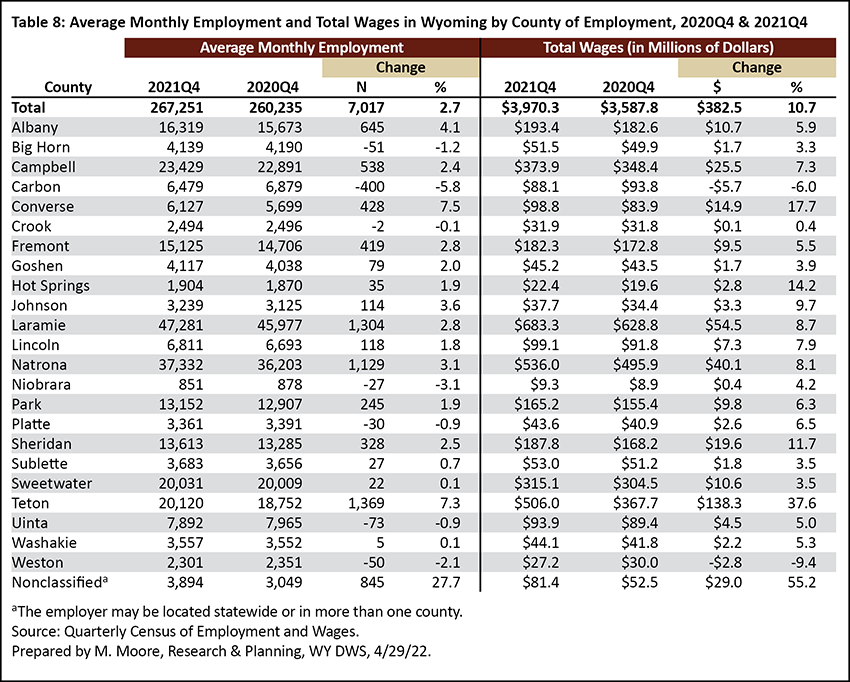
The leisure & hospitality supersector is comprised of two sectors: arts, entertainment, & recreation (NAICS 71) and accommodation & food services (NAICS 72; see Table 7). Leisure & hospitality added the greatest number of jobs of all industries in 2021Q4 (2,555, or 8.0%).
Wyoming’s leisure & hospitality sector was hit harder than any other industry at the start of the pandemic (see Figures 10 and 11), with average monthly employment dropping to a 20-year low in 2020Q2 (Moore, 2021). Leisure & hospitality has continued to lead all other industries in job growth over the last three quarters.
Within leisure & hospitality, the greatest increase in employment was seen in accommodation (1,179 jobs, or 13.4%), followed by food services & drinking places (1,151, or 5.8%) and amusements, gambling, & recreation (254, or 10.3%).
Total wages in leisure & hospitality increased from $191.0 million in 2020Q4 to $225.8 million in 2021Q4 ($34.8 million, or 18.2%).
Leisure & hospitality accounted for 12.9% of all jobs in 2021Q4, but only 5.7% of the state’s total wages. This discrepancy is due in large part to the number of lower paying jobs in leisure & hospitality.
Counties
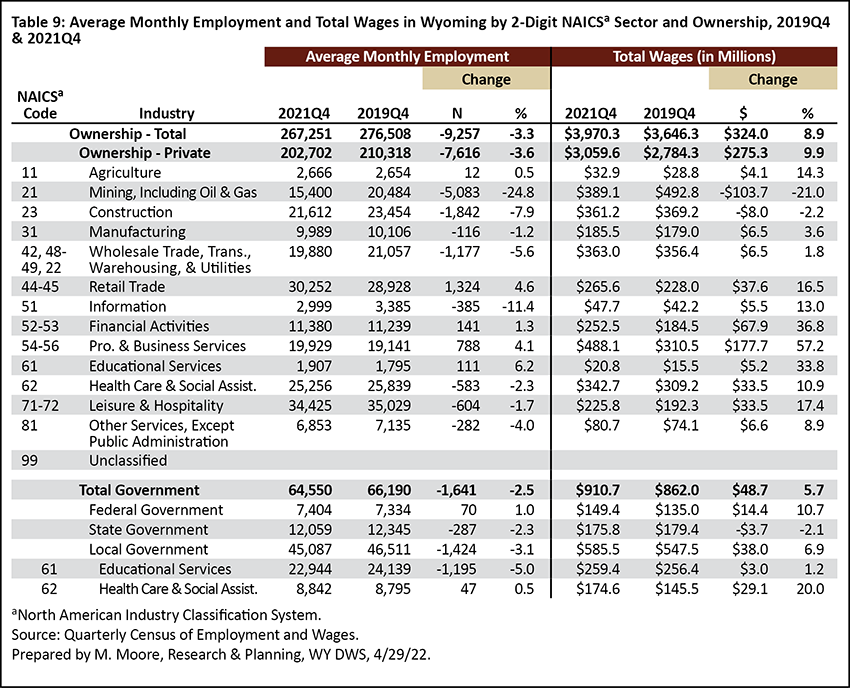
Most counties experienced over the-year job gains in 2021Q4, with the greatest increases seen in Teton (1,369 jobs, or 7.3%), Laramie (1,304, or 2.8%), Natrona (1,129, or 3.1%), Albany (645, or 4.1%), and Campbell (538, or 2.4%) counties (see Table 8). Over-the-year job losses were seen in seven counties, including Carbon (-400, or -5.8%), Uinta (-73, or -0.9%), Big Horn (-51, or -1.2%), and Weston (-50, or -2.1%) counties. The large job losses in Carbon County likely were the result of large scale, short-term construction projects coming to an end.
Most counties also saw increases in total wages over the year, led by Teton ($138.3 million, or 37.6%), Laramie ($54.5 million, or 8.7%), Natrona ($40.1 million, or 8.1%), and Campbell ($25.5 million, or 7.3%) counties.
Pre-Pandemic Levels
As previously mentioned, Wyoming has not returned to pre-pandemic employment levels despite recent job gains. The state’s average monthly employment of 267,251 in 2021Q4 remained 3.3% lower (-9,257 jobs) than the 276,508 in 2019Q4 (see Table 9).
Employment was substantially lower compared to pre-pandemic levels in several industries, including mining (-5,083, or -24.8%), construction (-1,842, or -7.9%), wholesale trade, transportation, & utilities (-1,177, or -5.6%), and leisure & hospitality (-604, or -1.7%). Total government had 1,641 fewer jobs (-2.5%) than in 2019Q4, with the greatest job losses found in local government (-1,424, or -3.1%).
Some industries surpassed their pre-pandemic employment levels in 2021Q4. For example, retail trade added 1,324 jobs (4.6%) from 2019Q4to 2021Q4. Other industries that saw employment increases compared to 2019Q4 included professional & business services (788, or 4.1%), financial activities (141, or 1.3%), and educational services (111, or 6.2%). Employment in federal government increased by 70 jobs (1.0%).
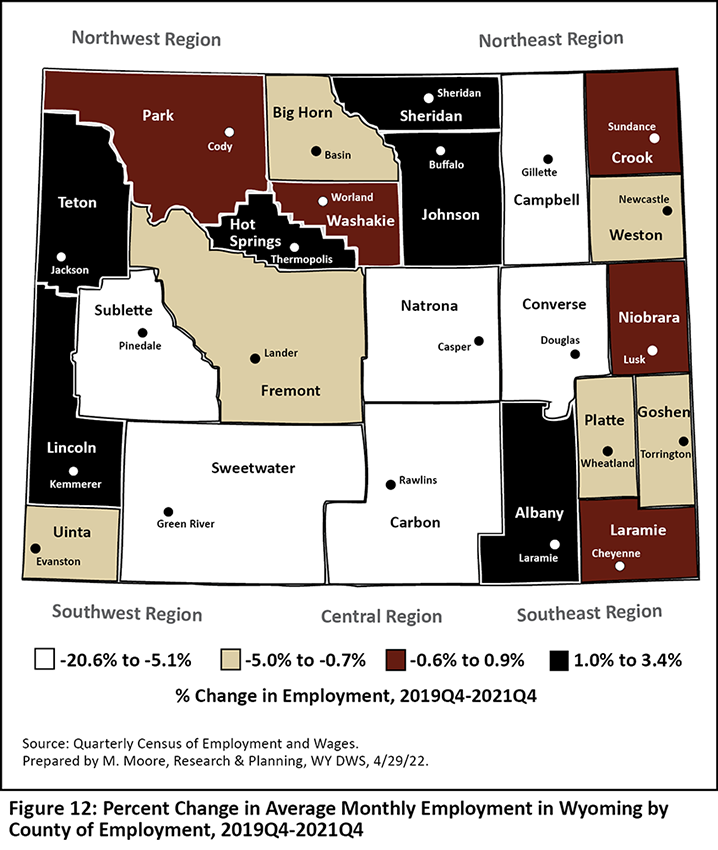
More than half (14) of Wyoming’s 23 counties remained lower than their pre-pandemic employment levels. Many of the counties with the greatest differences compared to pre-pandemic levels were those with a large presence of mining jobs. For example, Natrona County's employment was 5.7% lower in 2021Q4 than in 2019Q4 (see Figure 12). Other counties with noticeably lower employment compared to 2019Q4 included Campbell (-7.8%), Sweetwater (-9.0%), and Converse (-20.6%) counties. Counties that exceeded their 2019Q4 employment in 2021Q4 included Albany (2.8%), Teton (1.7%), and Lincoln (3.4%) counties.
Conclusion
Wyoming continued to recover from its recent economic downturn in 2021Q4, and added jobs and wages for the third consecutive quarter. Average monthly employment increased by more than 7,000 jobs (2.7%), while total wages increased by $382.5 million (10.7%). Substantial employment increases were seen in leisure & hospitality, professional & business services, construction, mining, and other industries.
Quarterly employment and wage data for Wyoming from the QCEW are available online at https://doe.state.wy.us/LMI/toc_202.htm. Data for 2022Q1 will be released on August 12, 2022, with a feature article planned for the October 2022 issue of Wyoming Labor Force Trends.
References
Manning, P. (2016, April). Chapter 2: Global demand for oil, gas and coal. Workforce Planning Report 2016, Wyoming Labor Force Trends (53)4. Research & Planning, WY DWS. Retrieved June 9, 2022, from https://doe.state.wy.us/LMI/trends/0416/a2.htm
Moore, M. (2019a, May). Chapter 1: Introduction — Driven by demographics and downturns: Wyoming’s 2018 labor market at a glance. 2019 Wyoming Workforce Annual Report. Research & Planning, WY DWS. Retrieved June 9, 2022, from https://doe.state.wy.us/LMI/annual-report/2019/2019_Annual_Report.pdf
Moore, M. (2021, April). 2020Q3 quarterly update: Wyoming job losses continue in third quarter 2020. Wyoming Labor Force Trends, 58(4). Retrieved June 9, 2022, from https://doe.state.wy.us/LMI/trends/0421/0421.pdf
Research & Planning. (2022). Wyoming QCEW summary statistics by industry, 2001-2021: Total, all industries. Retrieved June 9, 2022, from https://doe.state.wy.us/LMI/QCEW_OTY/toc.htm
U.S. Bureau of Labor Statistics (2022, June). Industries at a glance: Support activities for mining - NAICS 213). Retrieved June 9, 2022, from https://www.bls.gov/iag/tgs/iag213.htm
Information for Job Seekers
The following are some of the specific locations on our website that may have useful information for you as you consider your employment options:


 Wyoming at Work
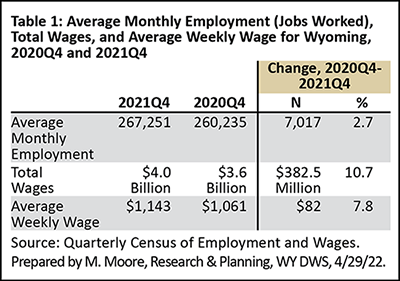