Occupations, Earnings, and Career Opportunities
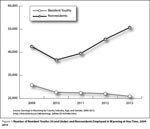 |
More than half (51.5%) of all businesses in Wyoming in 2011 had just one to three employees. Some of these micro-sized firms provided higher annual wages on average in their industries than larger firms. Larger Wyoming employers (those with 50 or more employees) made up just 4.1% of all businesses but contributed 57.0% of the state's jobs and 63.4% of Wyoming's total wages in 2011.
Related Tables and Figures
Continue Reading →
Also inside June Trends:
Survey of Occupational Injuries and Illnesses for 2012
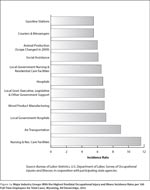 |
This article summarizes the 2012 Wyoming Survey of Occupational Injuries and Illnesses results. The data include estimates of incidence rates by industry and the nature of the injury or illness. Also included are some worker demographics, such as age and gender. State and local government data are discussed briefly. An estimated 2,410 nonfatal occupational injury and illness cases with days away from work occurred in private industry in Wyoming in 2012, with an incidence rate of 3.5.
Continue Reading →
Related article: BLS Tool Lets Companies Calculate and Compare
Injury/Illness Rates to Industry by Geographic Area
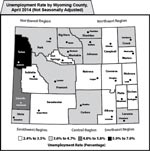
Wyoming Unemployment Rate Falls to 3.7% in April 2014
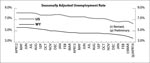 |
The Research & Planning section of the Wyoming Department of Workforce Services reported that the state’s seasonally adjusted unemployment rate fell from 4.0% in March to 3.7% in April. Wyoming’s unemployment rate was significantly lower than its year-ago level of 4.7% and the current U.S. unemployment rate of 6.3%. Seasonally adjusted employment of Wyoming residents increased, rising by 1,657 individuals (0.6%) from March to April.
Continue Reading →
Table of Contents
- PDF Version
- Credits
- Youths and Nonresidents in Wyoming’s Labor Force, Part 3:
Occupations, Earnings, and Career Opportunities - Survey of Occupational Injuries and Illnesses for 2012
- BLS Tool Lets Companies Calculate and Compare
Injury/Illness Rates to Industry by Geographic Area - Wyoming Unemployment Rate Falls to 3.7% in April 2014
- Current Employment Statistics (CES) Estimates and Research & Planning's Short-Term Projections, April 2014
- Unemployment Rates by State, April 2014 (Seasonally Adjusted)
- Unemployment Rates by State, April 2014 (Not Seasonally Adjusted)
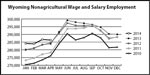
- Wyoming Nonagricultural Wage and Salary Employment
- Campbell County
- Sweetwater County
- Teton County
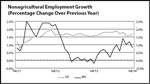
- Nonagricultural Employment Growth Graph
- Nonagricultural Wage and Salary Employment Graph
- Economic Indicators
- Wyoming Total Nonfarm Employment
- Selected U.S. Employment Data
- Multiple Jobholders
- Discouraged Workers
- Part-Time for Economic Reasons
- Consumer Price Index
- Wyoming Building Permits
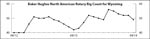
- Baker Hughes Rig Count
- Wyoming County Unemployment Rates
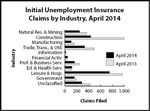
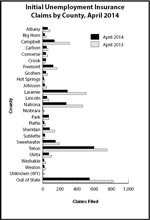
- Wyoming Normalized Unemployment Insurance Statistics: Initial Claims
- Statewide
- Laramie County
- Natrona County
- Statewide by Industry Graph
- Statewide by County Graph
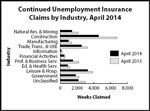
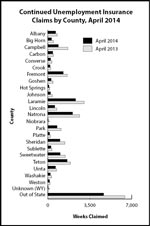
- Wyoming Normalized Unemployment Insurance Statistics: Continued Claims
- Statewide
- Laramie County
- Natrona County
- Statewide by Industry Graph
- Statewide by County Graph
- Map of Wyoming Regions, Counties, and County Seats with County Unemployment Rates