Wyoming Labor Force Trends
May 2026 | Volume 63, No. 5
Click Here for PDF
Return to Table of Contents
UI Claims Increase Again in 2025, but Remain Relatively Low
by: Matthew Halama, Senior Economist
Even though Unemployment Insurance (UI) claims and the amount of benefits paid increased from 2024 to 2025, UI claims remained lower than pre-pandemic levels.
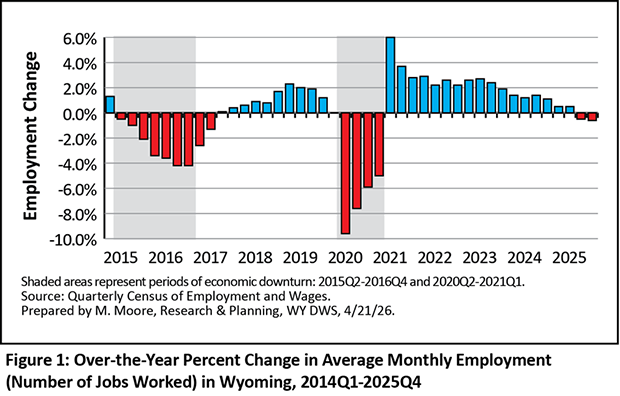
Wyoming job growth slowed in 2025, with employment levels falling below prior-year levels during the last two quarters (see Figure 1).
The number of individuals receiving Unemployment Insurance (UI) benefits increased for the second consecutive year, but remained below pre-pandemic levels dating back to at least 1997, the first year for which comparable data are available (see Figure 2). The total amount of benefits paid increased for the third consecutive year.
This article examines selected UI statistics and provides analysis for a better understanding of Wyoming’s UI claims and how they affect the current economy. Weekly, monthly, and annual UI claims data are available at https://doe.state.wy.us/LMI/UI.htm.
UI Benefit Recipients and Exhaustees
In 2025, 11,753 unemployed workers received UI benefits in Wyoming, an increase of 781 (7.1%) from 2024 (see Figure 2). The number of UI recipients who exhausted their regular benefits increased from 1,982 in 2024 to 2,078 in 2025 (96, or 4.8%). The exhaustion rate (number of benefit exhaustees divided by the total number of recipients) decreased from 18.1% to 17.7%.
Two counties in Wyoming experienced over-the-year decreases in UI recipients, while 20 counties had an increase from 2024 to 2025 (see Table 1). Lincoln County was unchanged. The largest over-the-year increases were in Sweetwater (130, or 17.7%), Campbell (87, or 12.2%), and Fremont (74, or 11.1%) counties. The over-the-year decreases were seen in Weston (-4, or -5.0%) and Johnson (-3, or -3.0%) counties.
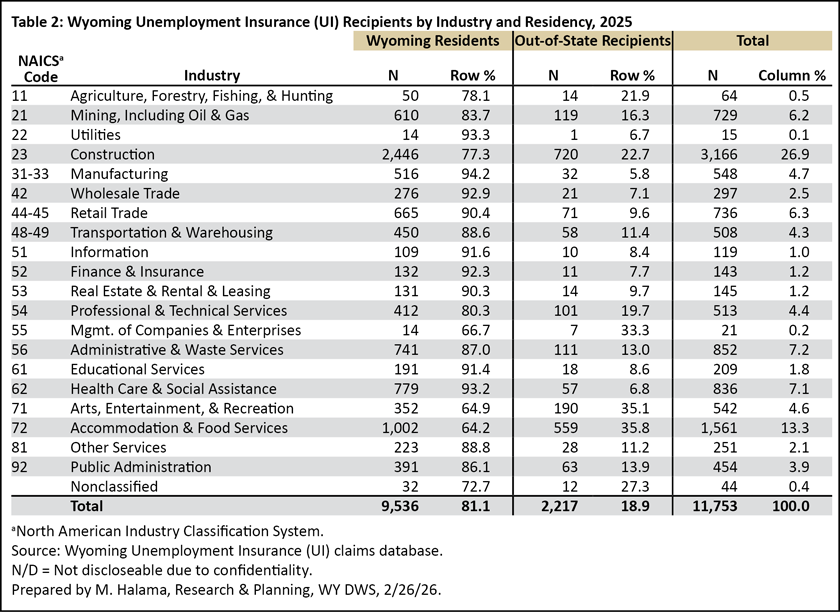
The number of out-of-state UI benefit recipients increased from 2,051 to 2,216 (an increase of 165, or 8.0%). Out-of-state benefit recipients made up 18.9% of all benefit recipients in 2025 (nearly one in five), larger than any single county. Laramie and Natrona counties accounted for the greatest share of UI recipients with 13.6% and 13.0%, respectively.
At the industry level, construction accounted for more than one in four of all UI recipients in 2025 (3,166, or 26.9%; see Table 2). This was followed by accommodation & food services (1,561, or 13.3%), administrative & waste services (852, or 7.2%), and health care & social assistance (836, or 7.1%). Construction also accounted for the largest number of out-of-state UI recipients (720, or 22.7%), followed by accommodation & food services (559, or 35.8%), and arts, entertainment, & recreation (190, or 35.1%).
From 2024 to 2025, most industries saw increases in benefit recipients (see Table 3). The largest over-the-year increase was in construction (334, or 11.8%), followed by public administration (72, or 18.8%), and arts, entertainment, & recreation (69 or 14.6%). The largest over-the-year decreases were in information (-20 or -14.4%), finance & insurance (-11 or -7.1%), and accommodation & food services (-10 or -0.6%).
Twelve industries had higher benefit exhaustion rates in 2025 compared to 2024. The highest exhaustion rates in 2025 were in utilities (33.3%), management of companies & enterprises (28.6%), and information (26.1%). The lowest exhaustion rates were in construction (12.9%), other services (except public administration; 15.1%), and accommodation & food services (15.7%).
The average number of weeks claimed increased slightly, from 10.1 in 2024 to 10.4 in 2025. In general, the industries that had the highest exhaustion rates also had the largest numbers of weeks claimed, including utilities (15.2), management of companies & enterprises (13.0), finance & insurance (12.3), and information (12.1). In general, higher average weeks claimed and exhaustion rates usually indicate that benefit recipients from a particular industry had a more difficult time finding new employment after job losses. In contrast, UI benefit recipients from industries with lower exhaustion rates and fewer weeks claimed — such as construction and accommodation & food services — had an easier time finding work.
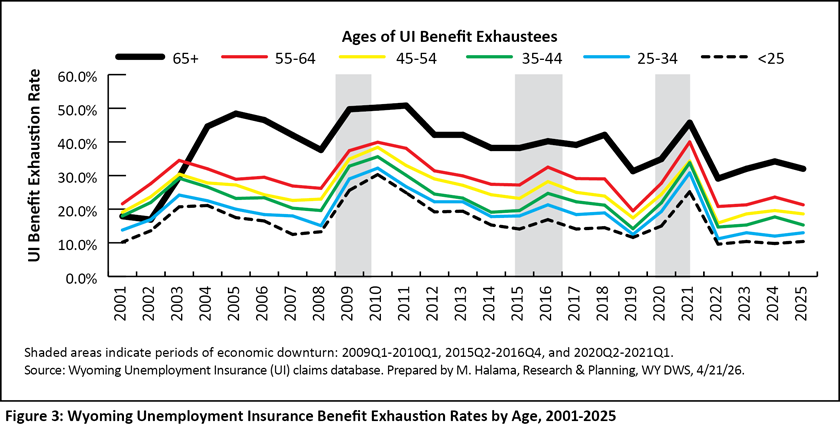
Table 4 provides further insight on which subsets of the population receive UI benefits. In general, older workers tend to have a higher UI benefit exhaustion rate than younger workers. For example, individuals ages 65 and older had the highest benefit exhaustion rate of 32.4% in 2025, compared to lower exhaustion rates for individuals 16-24 (11.2%), 25-34 (13.2%), 35-44 (16.8%), 45-54 (19.2%), and 55-64 (21.2%). This is also illustrated in Figure 3.
In addition, Table 4 shows that 20.3% of females exhausted their benefits in 2025, compared to 16.4% of males. Females had higher exhaustion rates than males each year dating back to 2001, with the exception of 2020 (Halama, 2024).
A higher pre-layoff wage and longer-term employment would qualify a claimant for more weeks of UI benefits, with a maximum of 26 weeks. In other words, individuals with more eligible weeks of UI benefits had more time to find re-employment, and were less likely to exhaust their benefits than those with fewer weeks of eligibility. For example, 13.7% of recipients who were eligible for the maximum 26 weeks exhausted their benefits, compared to 40.0% of those eligible for 10-14 weeks and 29.1% of those eligible for 15-19 weeks. Similarly, 12.8% of those who earned $60,000 or more before they were laid off exhausted their benefits, compared to 25.9% of those who made between $10,000 and $19,999 per year.
Statewide UI Benefits
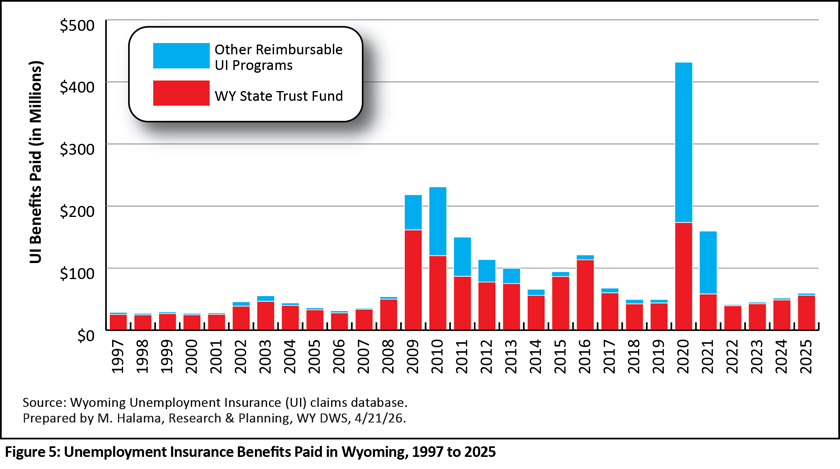
In 2025, UI benefit recipients in Wyoming were paid a total of $59.5 million, including $56.2 million from the state UI trust fund and $3.3 million from other UI funds (see Figure 5). Total benefits paid increased from $51.7 million in 2024, an increase of $7.8 million, or 15.1%.
At the industry level, construction accounted for more than one-fourth of all benefits paid ($16.7 million, or 28.0%; see Table 5). This was followed by accommodation & food services ($6.3 million, or 10.6%); mining, including oil & gas ($4.5 million, or 7.6%); administrative & waste services ($4.4 million, or 7.4%); and health care & social assistance ($3.8 million, or 6.4%).
Industries that saw large over-the-year increases in UI benefits paid included construction ($2.3 million, or 16.3%), manufacturing ($856,185, or 38.9%), and mining ($749,315, or 20.0%).
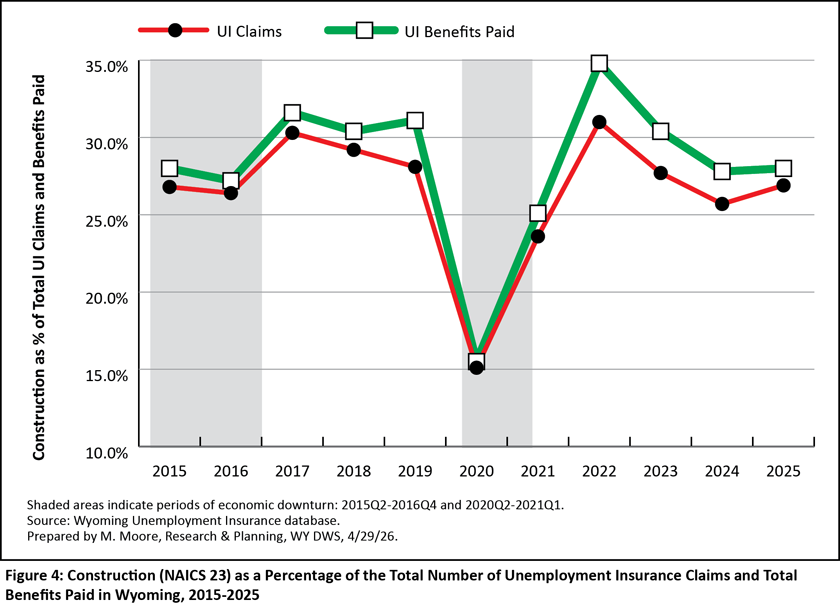
Construction usually accounts for approximately 28% of all UI claimants and benefits paid annually in Wyoming (see Figure 4), more than any other industry. Since 1997, the only exception was 2020, when leisure & hospitality lost a record number of jobs due to the Covid-19 pandemic (Moore, 2021) and surpassed construction in both the number of claims and total benefits paid.
Annual Unemployment Insurance Claims Data for Wyoming
Now Available
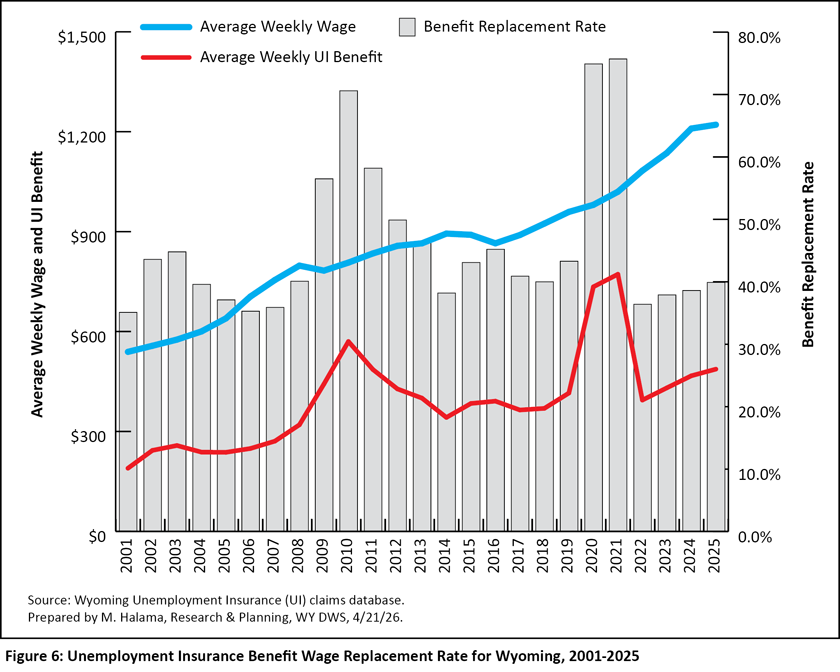
Unemployment insurance benefit wage replacement refers to how much of an individual’s average weekly wages were covered by UI benefits, and is calculated by dividing the average weekly benefit by the average weekly wage from the QCEW. Wage replacement rates were higher than usual in 2020 and 2021, due to federal Cares Act funding (Halama, 2024). The average wage replacement rate across all industries was 39.9% in 2025, up slightly over the last few years but consistent with past years excluding periods of economic downturn (see Figure 6).
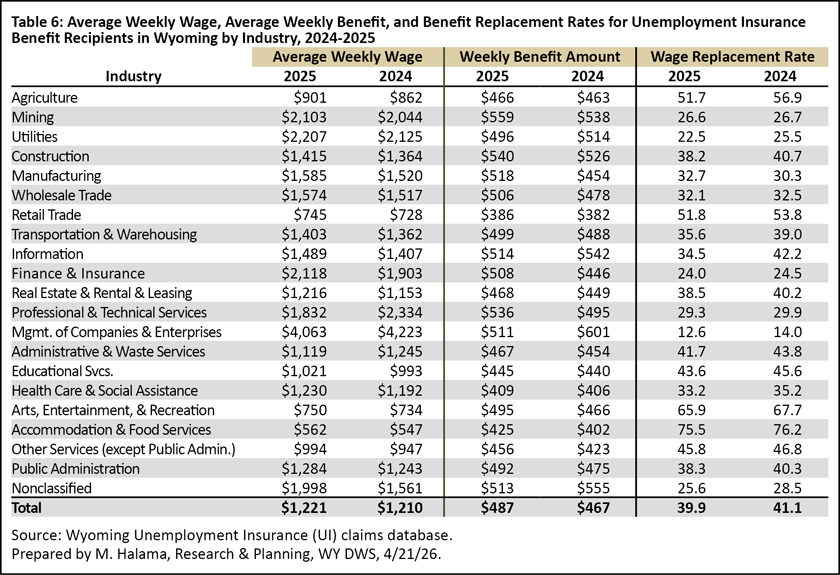
In general, industries with low wages tend to have higher wage replacement rates. In 2025, accommodation & food services had the lowest average weekly wage of $562 and the highest wage replacement rate of 75.5% (see Table 6). Other industries with high wage replacement rates included arts, entertainment, & recreation (65.9%); retail trade (51.8%); and agriculture (51.7%).
Industries with higher wages typically had lower wage replacement rates, such as management of companies & enterprises (12.6%), utilities (22.5%), finance & insurance (24.0%), and mining (26.6%).As previously mentioned, construction had the largest number of UI benefit recipients in 2025 (3,166); the average wage replacement rate in this industry was 38.2%, or just over one-third of the average weekly wage of $1,415.
Table 7 shows UI benefit expenses by county for 2024 and 2025. Most counties experienced double-digit percentage increases in benefits paid from 2024 to 2025. Out-of-state recipients saw the largest increase ($2.1 million, or 20.7%), followed by Sweetwater ($1.0 million, or 28.7%), Campbell ($629,017, or 18.8%), Uinta ($577,442, or 52.9%), and Natrona ($567,458, or 8.1%) counties. Johnson County had the only over-the-year decrease among all counties (-$60,612, or -14.3%).
Approximately $1 of every $5 of all benefit expenses were paid to out-of-state claimants ($12.5 million, or 21.0%), more than any single Wyoming county. Laramie County had the greatest single amount of UI benefits paid in 2025 ($7.9 million, or 13.3%), followed by Natrona ($7.5 million, or 12.7%), Sweetwater ($4.6 million, or 7.8%) and Campbell ($4.0 million, or 6.7%) counties.
Conclusion
Wyoming saw a 7.1% over-the-year increase in UI benefit recipients from 2024 to 2025, as well as a 15.1% increase in benefits paid. In addition, the average exhaustion rate decreased from 18.1% to 17.7%, and the average number of weeks claimed increased from 10.1 to 10.4. Some industries saw relatively large increases in UI exhaustion rates, such as utilities (20.8% to 33.3%), management of companies & enterprises (17.6% to 28.6%), and mining (13.2% to 17.8%); this could indicate that those who lost employment had a harder time finding re-employment in their respective industries.
References
Halama, M. (2024, June). Chapter 5: Unemployment Insurance claims. 2024 Wyoming Workforce Annual Report. Research & Planning, WY DWS. Retrieved March 27, 2026, from https://doe.state.wy.us/LMI/annual-report/2024/2024_Annual_Report.pdf#page=30
Moore, M. (2021, January). 2020Q2 quarterly update: Covid-19 pandemic forces historic job losses in 2020Q2. Wyoming Labor Force Trends, 58(1). Research & Planning, WY DWS. Retrieved April 29, 2026, from https://doe.state.wy.us/LMI/trends/0121/0121.pdf

 Hire Wyo