Wyoming Labor Force Trends
February 2026 | Volume 63, No. 2
Click Here for PDF
Return to Table of Contents
Identifying Seasonal Trends in Continued UI Claims in Wyoming
by: Michael Moore, Research Supervisor
Weekly Unemployment Insurance claims in Wyoming have followed a very consistent pattern for many years. These patterns can help jobseekers, employers, policymakers, and others identify periods of peak activity for Wyoming's UI system.
The Research & Planning (R&P) section of the Wyoming Department of Workforce Services publishes Unemployment Insurance (UI) claims data on a weekly basis. Claims data are available for several variables, such as industry, county of employment, sex, and age.
R&P publishes weekly initial and continued UI claims data. An initial claim is filed by an unemployed individual after a separation from an employer. The claim requests a determination of basic eligibility for the Unemployment Insurance benefits. An unemployed individual who has already filed an initial claim and who has experienced a week of unemployment and then files a continued claim to obtain benefits for that week of unemployment; these are referred to as continued claims or continued weeks claimed.
As noted by Leonard (2010), Wyoming’s UI system “provides partial temporary replacement of income in the event of job loss, supports the search for new jobs, and sustains consumer spending when the economy is contracting.” To qualify for benefits, claimants must meet the following criteria (WY DWS, 2025):
- Unemployed for reasons beyond their control (such as layoffs).
- Physically able to work.
- Available and actively looking for a suitable job.
Recipients may receive full unemployment benefits up to 26 weeks, ranging from $47 to $651 a week. A person’s weekly benefit amount and number of weeks of benefits available are determined by a variety of factors, such as that person’s UI-covered employment time before the layoff and base-period wage.
The purpose of this article is to illustrate how UI claims generally tend to follow consistent, predictable patterns with few exceptions. This article will largely focus on continued claims from 2023 to 2025, with a particular focus on the variables that drive the seasonal patterns: the construction and leisure & hospitality industries, selected counties, out-of-state workers, and the differences in males and females receiving UI benefits. In addition, this article looks at events that have disrupted normal patterns in continued UI claims.
Figure 1 shows weekly claims data from 2023 to 2025 to illustrate how continued UI claims tend to follow the same general pattern: they peak in weeks one through eight in January and February, and then decline consistently from weeks nine to 22 during the spring months as the weather warms up and more jobs become available. Continued weeks claimed are at their lowest during weeks 23 through 40 from June to September, and then consistently increase in weeks 41 through 52 from October through December as temporary summer jobs go away and displaced workers apply for and receive continued UI benefits. The number of continued weeks claimed generally increased each year from 2023 to 2025, but still followed the same pattern.
Two industries regularly contribute the largest number of continued weeks claimed: construction and leisure & hospitality. In 2024, for example, construction accounted for more than one in four UI benefit recipients (25.8%), and leisure & hospitality accounted for 18.6% (Halama, 2025). Together, these two industries were responsible for 44.4% of all UI benefit recipients, or nearly half. These two industries provide a large number of temporary, seasonal jobs in Wyoming, so when those jobs are finished, individuals are able to apply for UI benefits.
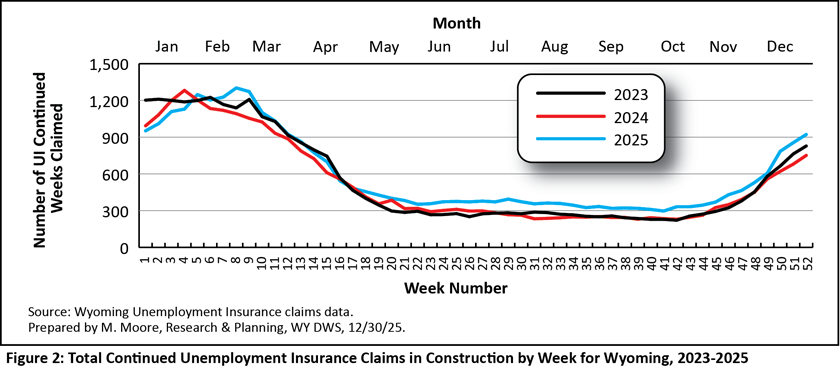
As shown in Figure 2, continued claims in construction follow the same general pattern as the overall total presented in Figure 1. Because the construction industry contributes such a large number of continued UI claims, it generally sets the path of the overall continued claims.
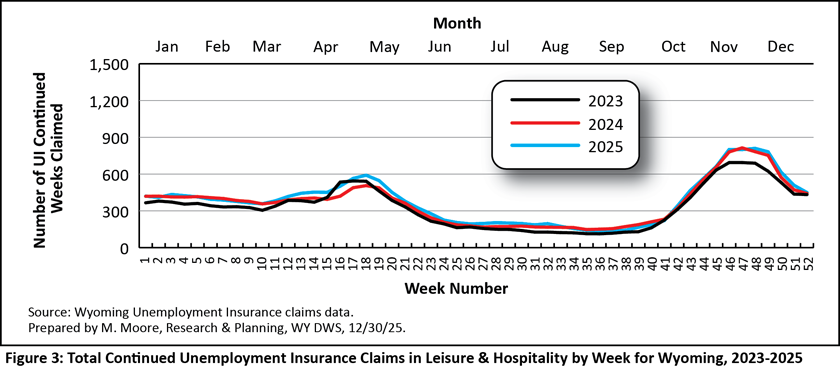
Continued claims in leisure & hospitality tend to follow a somewhat different pattern (see Figure 3), due to employment peaks in both winter and summer. Continued claims hover around 400 each week from weeks one through 14, and then increase during weeks 15 through 19 in April and May. The springtime bump in continued claims in leisure & hospitality is due to jobs being lost as the winter tourism and ski seasons come to an end. Like construction, continued claims in leisure & hospitality are at their lowest during the warm summer months from weeks 24 to 39, when employment is at its highest. Continued claims in leisure & hospitality consistently increase from weeks 40 to 45 during September to October as temporary summer jobs end, and then peak and plateau during weeks 46 through 49 in November.
Wyoming has historically relied on a large number of nonresident workers (those from another state or country) to fill jobs, particularly seasonal and temporary jobs in industries like construction and leisure & hospitality. In 2024, for example, nonresidents accounted for 34.0% of all individuals working in construction and 32.9% of those working in leisure & hospitality (Moore, 2025). Across all industries, nonresidents made up 15.9% of all persons working in Wyoming in 2024.
Because of these factors, out-of-state individuals usually account for a larger share of UI benefit recipients than any single Wyoming county. In 2024, out-of-state claimants made up 18.7% of all UI benefit recipients (Halama, 2025). Wyoming’s two most populous counties, Laramie and Natrona, accounted for 14.4% and 13.7% of all UI benefit recipients, respectively.
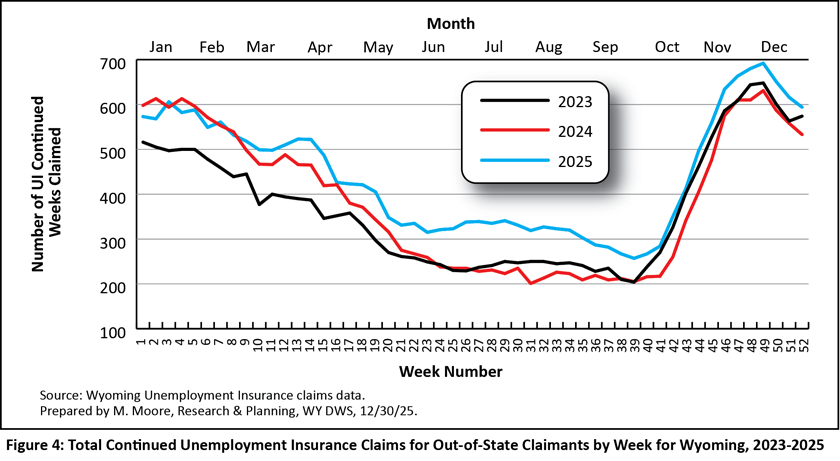
The number of weeks claimed by out-of-state individuals is at its highest at the end of the calendar year, peaking in week 49 in late November or early December (see Figure 4). After this, continued claims for out-of-state benefit recipients gradually decline through week 20 in the spring, level off through the summer, and then increase again beginning in week 41 in October as seasonal jobs in leisure & hospitality and construction come to an end.
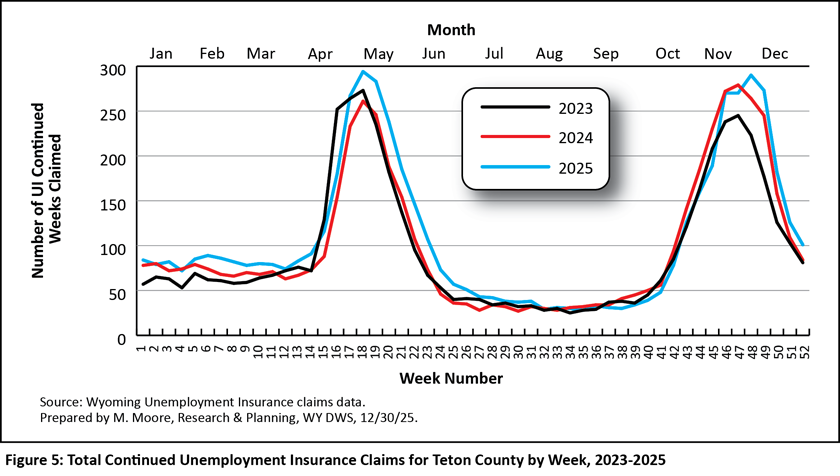
Teton County has very unique but very consistent patterns of employment and UI claims, due to the large number of leisure & hospitality jobs (see Figure 5). In 2024, leisure & hospitality made up more than one in three jobs (36.8%) in Teton County (Research & Planning, 2025). As previously mentioned, continued UI claims in leisure & hospitality have two peaks because of the increase in jobs in summer and winter.
This is clearly visible for Teton County in Figure 5: continued claims remain relatively low from week one through week 13 during the winter tourism season from January to April, then increase substantially during weeks 14 to 19. Continued claims decline rapidly from weeks 20 to 24 in May and June, and then plateau at their lowest level from weeks 25 to 40 from June to September during the height of the summer tourist season. Continued claims then increase rapidly from week 41 to 45 in October and November, and then peak during weeks 46 to 49. Continued claims then rapidly decrease during the final weeks of the year as the winter tourism season picks up.
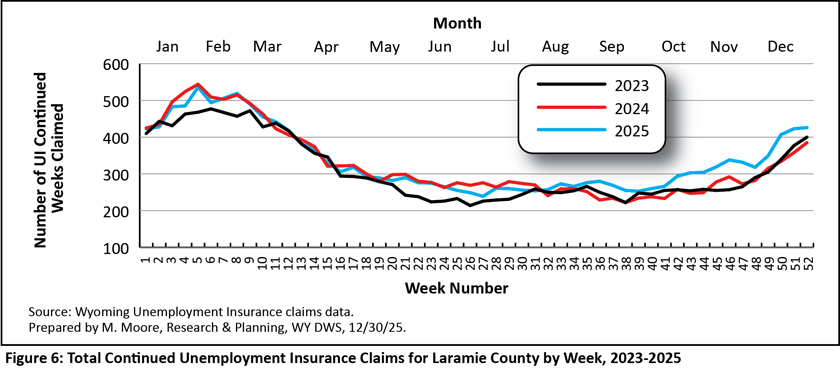
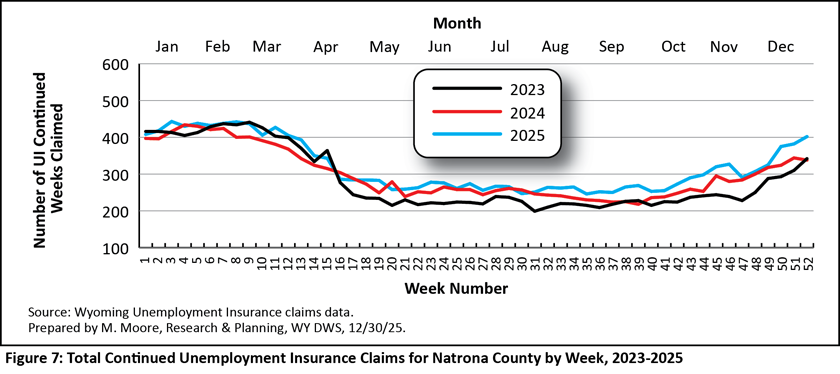
Continued claims for Laramie and Natrona counties follow the same general pattern as the statewide total presented in Figure 1: peaking during the first three months of the calendar year, decreasing during the summer months, and then increasing again in the fall. Laramie County (see Figure 6) likely follows this pattern due to the large presence of local and state government jobs, which add jobs during the warm summer months, just like construction and leisure & hospitality. While continued claims in Natrona County follow the same general trend, the ups and downs are less pronounced (see Figure 7). For example, in 2025, continued claims peaked at 443 in week three and were at their lowest at 246 in week 35. The less pronounced highs and lows could be indicative of fewer seasonal jobs in Natrona County compared to other counties.
Economic Downturns
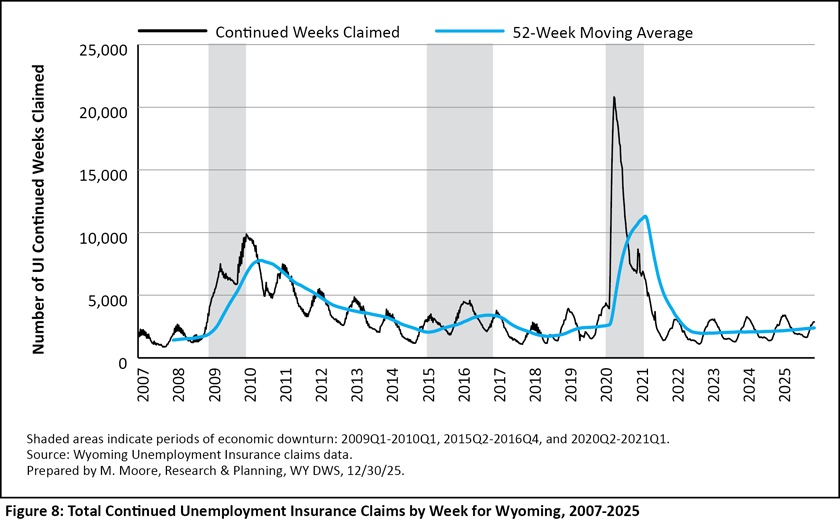
While patterns in Wyoming's UI claims data generally go back decades, certain events have disrupted those patterns — most notably periods of extended economic downturn. R&P has defined an economic downturn as a period of at least two consecutive quarters of over-the-year decline in average monthly employment and total wages based on data from the Quarterly Census of Employment and Wages (QCEW). Since 2009, Wyoming has endured three such economic downturns: 2009Q1 to 2010Q1, 2015Q2 to 2016Q4, and 2020Q2 to 2021Q1. While each downturn had its own unique circumstances, declining energy prices preceded all three (Moore, 2019).
The effect that each downturn had on continued UI claims in Wyoming is illustrated in Figure 8. Because of job losses during the first downturn, continued claims increased substantially throughout 2009, and peaked at 9,884 in week two of 2010. To put that increase in perspective, the total number of continued weeks claimed in week two of 2008 was 2,353. In other words, the total number of continued weeks claimed increased by 7,531 (or 320.1%) in two years.
Despite a substantial increase in job losses during the 2015-2016 downturn, continued UI claims did not show as great of an increase. During that downturn, continued weeks claimed peaked at 4,577 in week 16 of 2016, less than half of the peak from the previous downturn. The biggest difference between these two periods is that the 2009-2010 downturn coincided with the national Great Recession, while the 2015-2016 downturn was more specific to Wyoming. In 2015 and 2016, Wyoming’s surrounding states had growing economies and added jobs. With more job opportunities in neighboring states like Colorado and Utah, individuals who lost jobs in Wyoming in 2015 or 2016 may have moved to another state for work rather than filing a UI claim.
Continued claims reached an all-time high during the 2020-2021 downturn, which was preceded by a decline in energy prices and was caused in large part by the Covid-19 pandemic. Continued claims peaked at 20,827 in week 19 of 2020 during the height of the pandemic, an over-the-year increase of 820.7% and more than double the previous high of 9,884 in week two of 2010.
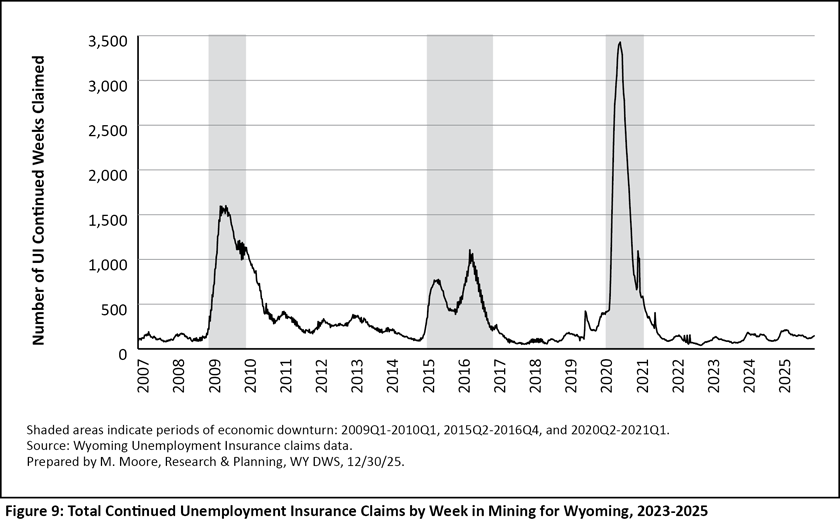
During most years, Wyoming has relatively few UI claims from its mining sector. In 2024, for example, mining accounted for just 6.3% of all UI benefit recipients (Halama, 2025). However, as previously mentioned, all three of Wyoming’s economic downturns were preceded by declining energy prices. All three downturns included substantial job losses in Wyoming’s mining sector, which resulted in increases in continued UI claims during each downturn (see Figure 9).
During the 2009-2010 downturn, continued claims in mining peaked at 1,599 in 2009 week 24. A year earlier in week 24 of 2008, mining had only 127 claims — in other words, in one year continued claims in mining increased by 1,259.1%.
Although the 2015-2016 downturn lasted longer, increases in continued claims were less pronounced. During that downturn, continued UI claims in mining reached a high of 1,106 in 2016 week 16. In contrast, the 2020-2021 downturn lasted for a shorter period of time, but UI claims climbed to historical highs. In particular, mining peaked with 3,428 continued claims in 2020 week 28.
Conclusion
Weekly UI claims in Wyoming have followed a very consistent pattern for many years, and understanding these patterns can be beneficial for many of Wyoming’s stakeholders, including policymakers, jobseekers, and employers. Outside of periods of economic downturn, continued claims tend to be at their lowest during the warm summer months, increase in the fall, and peak in January and February. During each year from 2023 to 2025, the number of UI continued weeks claimed peaked from weeks four through eight in late January through February. Likewise, continued claims were at their lowest each year during weeks 37 through 40 during September.
Unemployment Insurance claims data are published weekly and are available at https://doe.state.wy.us/lmi/UI/weekly_UI_TOC.htm.
References
Halama, M. (2025, June). Unemployment Insurance claims rise in 2024. Wyoming Labor Force Trends, 62(6). Research & Planning, Wyoming DWS. Retrieved December 31, 2025, from https://doe.state.wy.us/LMI/trends/0625/a1.htm
Leonard, D. (2010, November). Tracking workers' re-employment after job loss. Wyoming Labor Force Trends, 47(11). Research & Planning, Wyoming DOE. Retrieved December 31, 2025, from https://doe.state.wy.us/LMI/1110/a1.htm
Moore, M. (2019, May). Chapter 1: Introduction — Driven by demographics and downturns: Wyoming’s 2018 labor market at a glance. 2019 Wyoming Workforce Annual Report. Research & Planning, WY DWS. Retrieved December 31, 2025, from https://tinyurl.com/426yehdh
Moore, M. (2025, June). Chapter 2: Construction drives Wyoming job growth in 2024. 2025 Wyoming Workforce Annual Report. Research & Planning, Wyoming DWS. Retrieved December 31, 2025, from https://doe.state.wy.us/LMI/annual-report/2025/2025_Annual_Report.pdf#page=8
Research & Planning. (2025, May). Wyoming Quarterly Census of Employment and Wages (QCEW), 2024 annual data — Teton County. Retrieved February 3, 2026, from https://doe.state.wy.us/LMI/2024_QCEW/t24.htm.
Wyoming Department of Workforce Services. (2025). Unemployment Insurance frequently asked questions. Retrieved December 31, 2025, from https://dws.wyo.gov/dws-division/unemployment-insurance/claimants/
 Hire Wyo
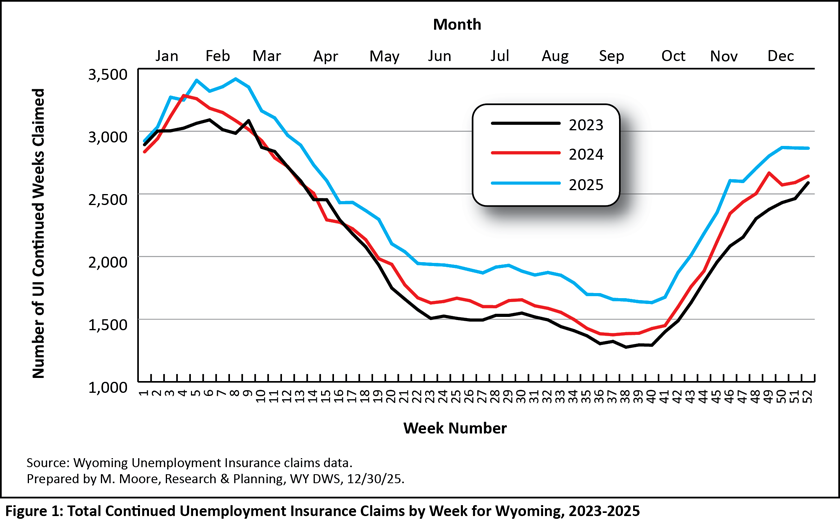