Wyoming Labor Force Trends
February 2025 | Volume 62, No. 2
Click Here for PDF
Return to Table of Contents
Why do People Save? Exploring the Personal Savings Rate
by: David Bullard, Senior Economist
The personal savings rate is an important economic indicator. It represents the percentage of people’s incomes saved (rather than spent) each month. The Bureau of Economic Analysis (BEA) publishes this rate as part of its monthly personal income news release. The full name of the data series is “personal saving as a percentage of disposable personal income.” One reason that personal savings is important is that it allows for capital formation. A higher level of capital formation boosts productivity and economic growth (Kotlikoff, 1993).
Figure 1 shows the U.S. personal savings rate from January 1959 to August 2024. It ranged from a low of 1.5% in July 2005 to a high of 32.0% in April 2020. The savings rate generally trended down from the late 1970s to the mid-2000s.
Several spikes are seen in the series. The largest spike occurred in April 2020, at the start of the Covid-19 pandemic. Other notable spikes occurred in May 1975, December 2012, and March 2021.
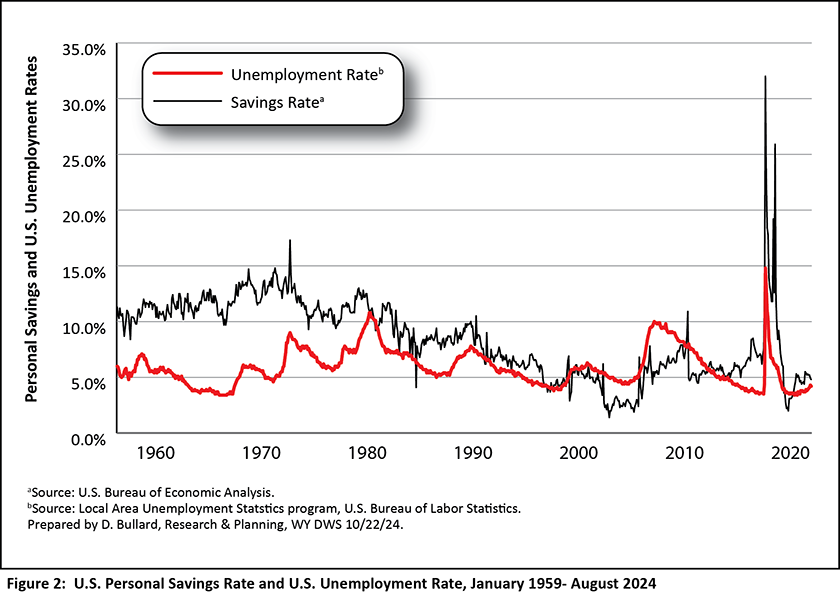
What could cause people to spend less and save more in a given month? Figure 2 shows the U.S. unemployment rate along with the personal savings rate from January 1959 to August 2024. One reason people might choose to save more is if they believe they will lose their jobs or if they face a high level of economic uncertainty. The sudden increase in savings in May 1975 (17.3%) coincided with a spike in the unemployment rate (9.0%). Similarly, the savings spike in April 2020 (32.0%) coincided with a spike in the unemployment rate (14.8%). The personal savings rate rose sharply in September 2001, likely as a result of the economic uncertainty related to the September 11 terrorist attacks.
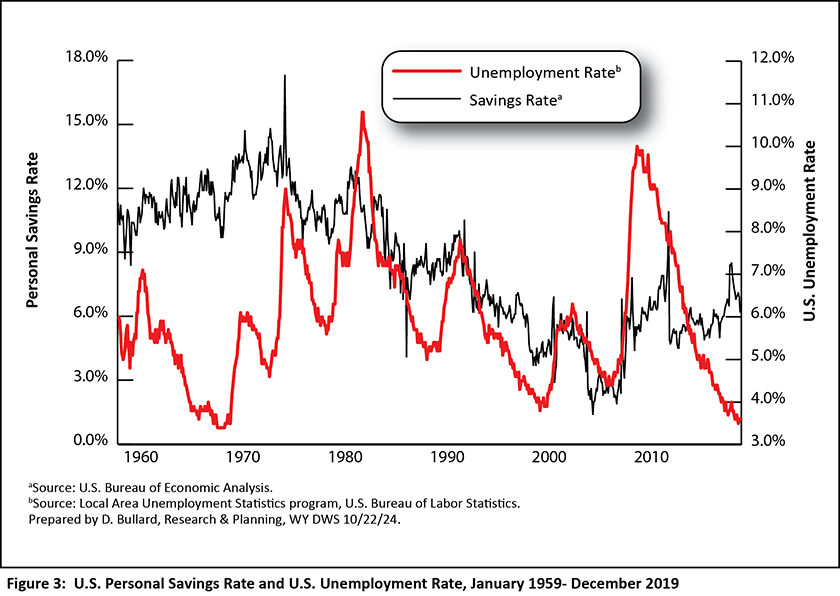
Figure 3 is similar to Figure 2, except it is limited to the pre-pandemic period. This allows us to zoom-in and see more detail. In November 1981, the savings rate jumped to 13.0% and the unemployment rate was 8.3%. For the next 12 months, the unemployment rate continued to increase, until it reached 10.8% in November 1982. In December 1992, the savings rate peaked at 10.5%. Technically, the recession ended in March 1991, but the jobless recovery was not providing much relief from high unemployment (NBER, 2023).
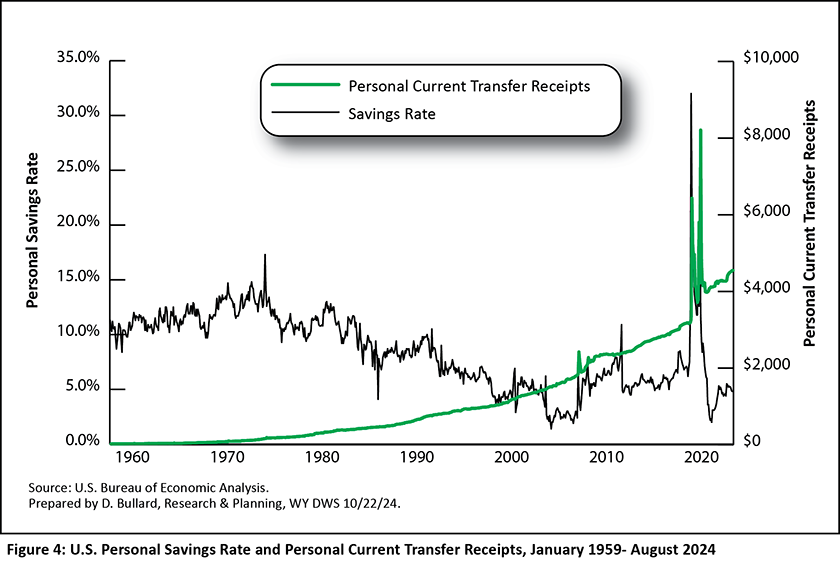
It is important to note, however, that the one-month jumps in savings in January 2021 and March 2021 occurred when the unemployment rate was trending down. In Figure 4, personal current transfer receipts are graphed against the savings rate. Transfer receipts are defined by the BEA (2019) as “payments by business and government to persons for which no current services are performed.” Transfer receipts include “social security benefits, medical benefits, veteran’s benefits, and unemployment insurance benefits. They also include stimulus payments to individuals during the pandemic. Sudden increases in transfer receipts are visible in April 2020, January 2021, and March 2021. The data in Figure 4 suggest that when people received large stimulus payments during the pandemic, a lot of money went into savings. Then, the savings rate fell to very low levels during much of 2022.
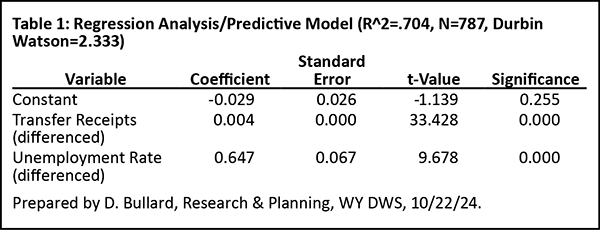
In order to better understand the relationship between the personal savings rate, the unemployment rate, and personal current transfer receipts, a regression model was developed. To avoid problems with serial correlation, first differences were taken of each variable. The results of the model are shown in Table 1. According to the model, more than two-thirds (70.4%) of the variation in the personal savings rate can be explained by the unemployment rate and personal current transfer receipts. The coefficients for both of the independent variables are positive and highly significant. This means that, all else equal, a higher unemployment rate will result in a higher personal savings rate, and that higher personal transfer receipts will also result in a higher savings rate.
In summary, the data presented in this article suggest that during times of economic uncertainty, when the unemployment rate is high, people save a larger percentage of their incomes. Additionally, when individuals receive transfer payments (such as pandemic relief stimulus payments), they will tend to save more than they otherwise would.
References
Kotlikoff, L.J. (1993) “Saving” in D.R. Henderson (Ed.), The Fortune Encyclopedia of Economics, pages 230-235. Warner Books.
National Bureau of Economic Research. (2023). U.S. business cycle expansions and contractions. Retrieved October 25, 2024, from https://www.nber.org/research/data/us-business-cycle-expansions-and-contractions
U.S., Bureau of Economic Analysis. (November 2019). Glossary: National income and product accounts. Retrieved October 25, 2024, from https://www.bea.gov/resources/methodologies/nipa-handbook/pdf/glossary.pdf
 Hire Wyo
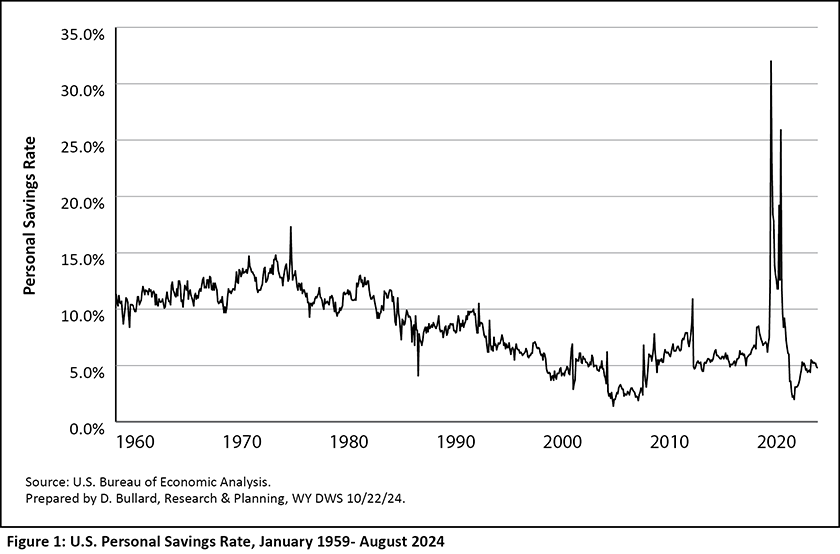