Wyoming Labor Force Trends
February 2024 | Volume 61, No. 2
Click Here for PDF
Return to Table of Contents
Wyoming New Business Formation in 2021 and 2022
by: Matthew Halama, Senior Economist
The number of new businesses in Wyoming increased from 3,476 firms in 2021 to 3,761 in 2022, both historical highs. More than half of all industries in Wyoming showed an over-the-year increase in the number of new businesses. Telework opportunities may be partially responsible for this large increase.
New business formation and the rate of business formation are important indices of economic growth. The entrepreneurs creating new businesses represent new ideas and with that are new sources of jobs, wages, and tax revenues for the state and local communities. Since 1995, the Research & Planning (R&P) section of the Wyoming Department of Workforce Services has been conducting new business formation research (Yu, 1995).
This research provides information on the number of new businesses formed and the job opportunities provided in Wyoming during the past two years (2021 and 2022). The analysis also looks at where new firms set up by industry and county, since economic development may be targeted to certain areas. Lastly, the research examines Wyoming business survival rates by county, industry, and employer size class.
For purposes of this research, a new business is defined as a business not existing before, but now actively providing goods or services and hiring employees and paying wages. New branches of existing firms or the reopening of firms after temporarily closing are not considered new firms. The research presented in this article focuses on 2022 data and utilizes tables and charts from 2021 and prior years for comparison purposes.
Statewide New Business Formation
A total of 3,761 new firms started their businesses in Wyoming in 2022, up from 3,476 in 2021 (an increase of 285 firms, or 8.2%; see Figure 1). New business formation was at historical highs in 2021 and 2022. From 2020 to 2022, the number of new firms increased by 1,190, or 46.3%. One explanation for the historically large increase may be due to teleworking. During the Covid-19 pandemic, companies were more lax in rules regarding office attendance, leading to an increase in employees working from home. If being physically present at the office is a non-issue as long as the tasks assigned are completed, then a company’s employment pool extends nationwide. This could lead to out-of-state firms hiring employees residing in Wyoming and having to register the business within the state for Unemployment Insurance (UI) purposes.
The statewide new business formation rate for the private sector (number of new private sector firms divided by total private sector firms) in Wyoming was 13.1% in 2022, up from 12.6% in 2021. Wyoming’s new business formation level ranged from a low of 7.8% in 2009 to a new high of 13.1% in 2022. Further discussion on new business formation rates can be found on pages 9-11.
New firms contributed 11,477 initial jobs in 2021 and 11,571 in 2022, which accounted for 4.3% and 4.2% of the state's average employment, respectively. New businesses also contributed $518.9 million in total wages in 2021 and $484.5 million in wages in 2022, accounting for 3.7% and 3.2% of the state's total wages, respectively.
The average new firm size in 2021 was 3.3 employees (see Table 1), which decreased to 3.1 employees for 2022. The average new firm size was largest in 1999 with 4.8 employees and smallest in 2015 with 3.0 employees on average.
New Business Formation by Region and County
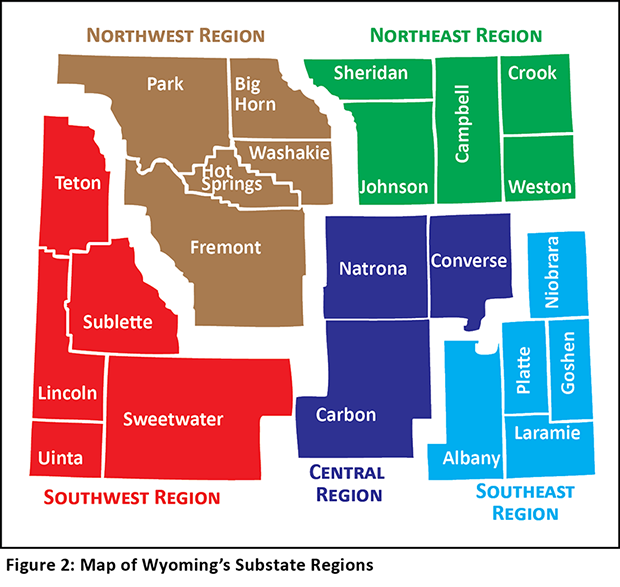
A map of Wyoming's counties and sub-state regions is shown in Figure 2.
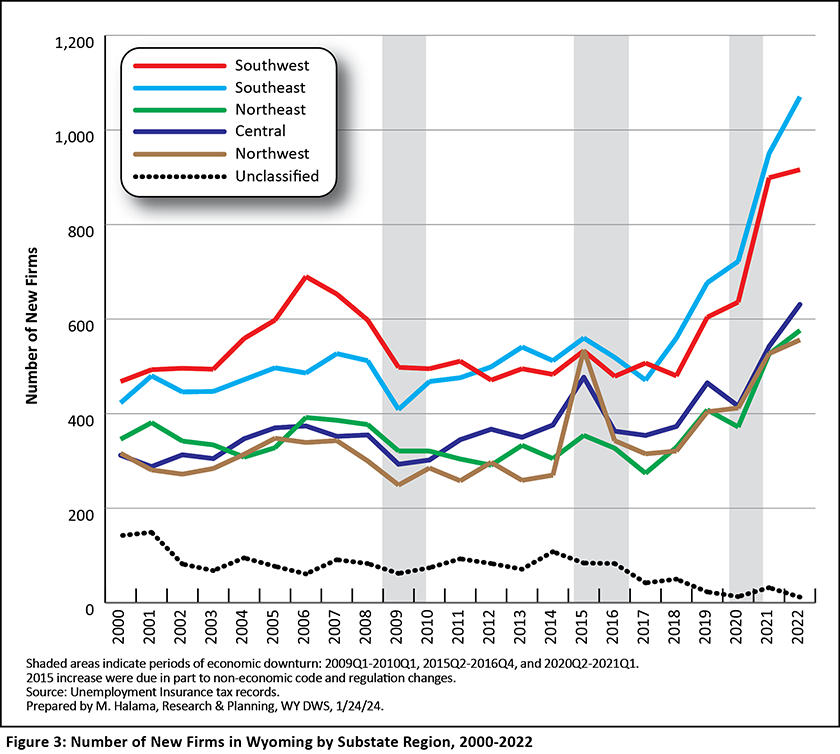
With the exception of 2017, Wyoming's southeast region added the greatest number of new businesses each year from 2012 to 2022 (see Figure 3). From 2000 to 2011, the southwest region saw the greatest growth in new businesses.
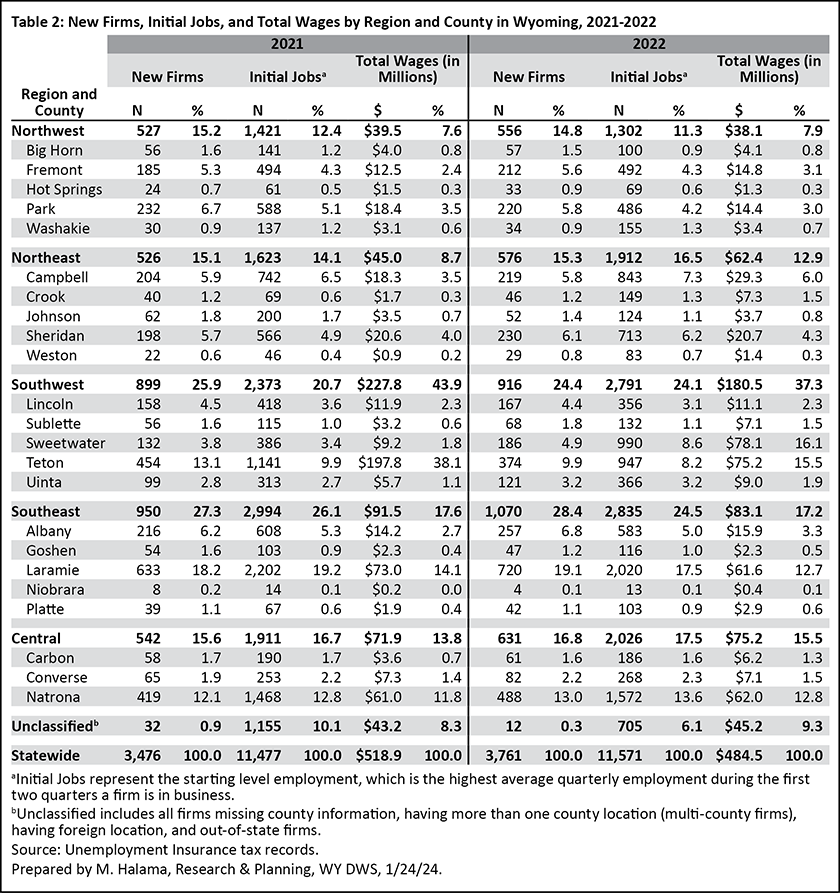
More than one-fourth of all new firms in Wyoming (1,070 new firms, or 28.4%) were found in the southeast region in 2022 (see Table 2). The southwest region added 916 new firms (24.4% of the total), followed by the central region with 631 (16.8%). The northeast and northwest regions shared similar numbers of new businesses, with 576 (15.3%) and 556 (14.8%), respectively.
Among counties, Laramie added the largest number of new firms (720, or 19.1%) in 2022, followed by Natrona (488, or 13.0%) and Teton (374, or 9.9%) counties. New businesses in Laramie County added the greatest number of initial jobs (2,020, or 17.5% of the statewide total), followed by new businesses in Natrona (1,572, or 13.6%), Sweetwater (990, or 8.6%), and Teton (947, or 8.2%) counties. However, new firms located in Sweetwater County contributed the greatest total wages ($78.1 million, or 16.1% of the total), followed by Teton ($75.2 million, or 15.5%), Natrona ($62.0 million, or 12.8%), and Laramie ($61.6 million, or 12.7%) counties.
Among counties with fewer new jobs but higher total wages, it is likely that counties such as Sweetwater and Teton counties added a larger proportion of higher paying jobs.
Decisions by entrepreneurs can rapidly change the structure of new business formation, as was the case with Teton County. From 2021 to 2022, new firms' total wages decreased from $197.8 million to $75.2 million — a drop of $122.6 million, or 62.0%.
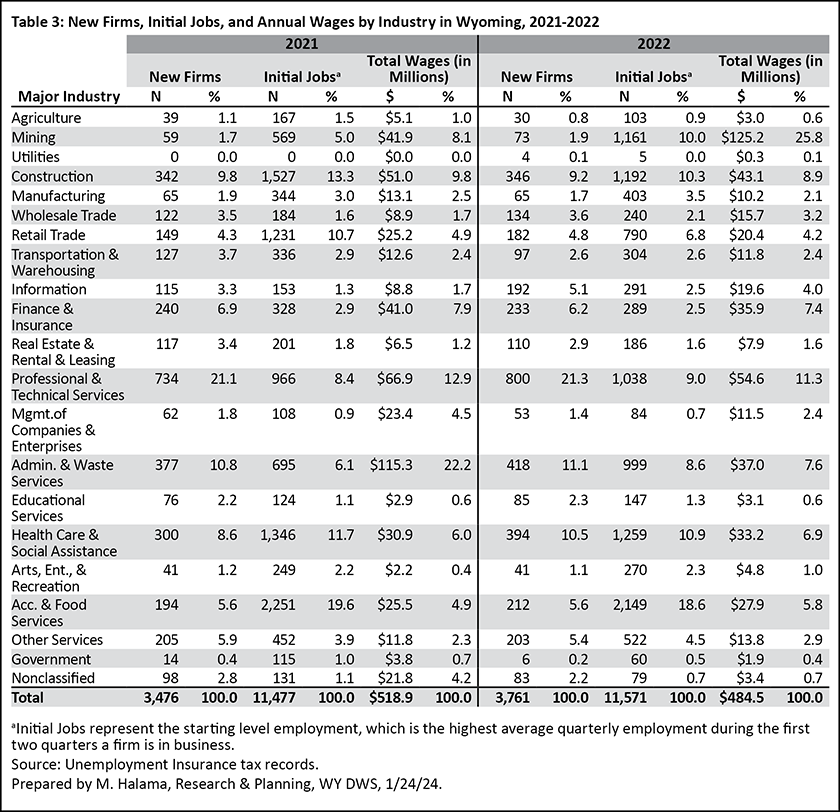
In 2022, there were four industries in Wyoming that gained more than 300 new firms (see Table 3). Those industries were professional & technical services (800 new firms, or 21.3%), administrative & waste services (418, or 11.1%), health care & social assistance (394, or 10.5%), and construction (346, or 9.2%).
Accommodation & food services added the greatest number of new jobs in 2022 (2,149, or 18.6% of the total), followed by health care & social assistance (1,259, or 10.9%), and construction (1,192, or 10.3%).
Business Formation by Industry
In 2022, Wyoming's mining sector (including oil & gas) added 73 new firms (1.9% of the total) and 1,161 jobs (10.0%), but also contributed the greatest amount of new wages, with $125.2 million, or 25.8% of total new wages. Professional & technical services added the second most total wages ($54.6 million, or 11.3%), followed by construction ($43.1 million, or 8.9%).
Dating back to 2000, construction led all industries in new business formation for 17 years (see Figure 4). New business formation in construction peaked with 614 new firms in 2007 and dropped to half its peak (310) by 2011. Since then, construction has added between 300 and 400 new businesses each year with the exception of 2017, when it dropped to a low of 279.
Since 2017, professional & technical services has added the most new firms each year. As previously mentioned, new business growth may be due in large part to recent increases in teleworking; this likely affected professional & technical services more than any other industry, as many businesses in this industry are likely to engage in telework.
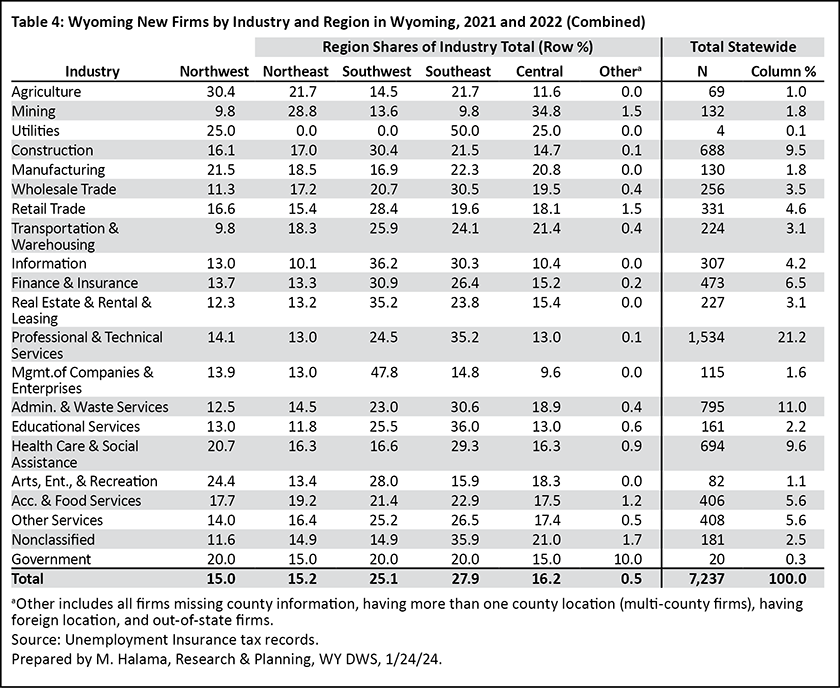
In order to provide more detailed information on the distribution of new firms by industry and sub-state region, R&P combined data for 2021 and 2022 (see Table 4). More than half (53.0%) of the 7,237 new firms established in 2021 and 2022 were located in two regions of the state: southeast (27.9%) and southwest (25.1%). However, the industry distribution among the different regions in the state was expected. Natural resources, transportation conditions, geographic location, population, and special projects such as pipeline, windmill, and highway construction are some factors that cause large uneven industry distributions in Wyoming.
More than one-third of new firms in mining were located in the central region (34.8%), while 9.8% were located in the northwest region. On the other hand, more than one-fourth (29.3%) of new businesses in health care & social assistance opened in the southeast region, while 16.3% were found in the central region. Half of all new businesses in utilities (50.0%) were located in the southeast, and nearly half (47.8%) of businesses engaged in management of companies & enterprises were located in the southwest region.
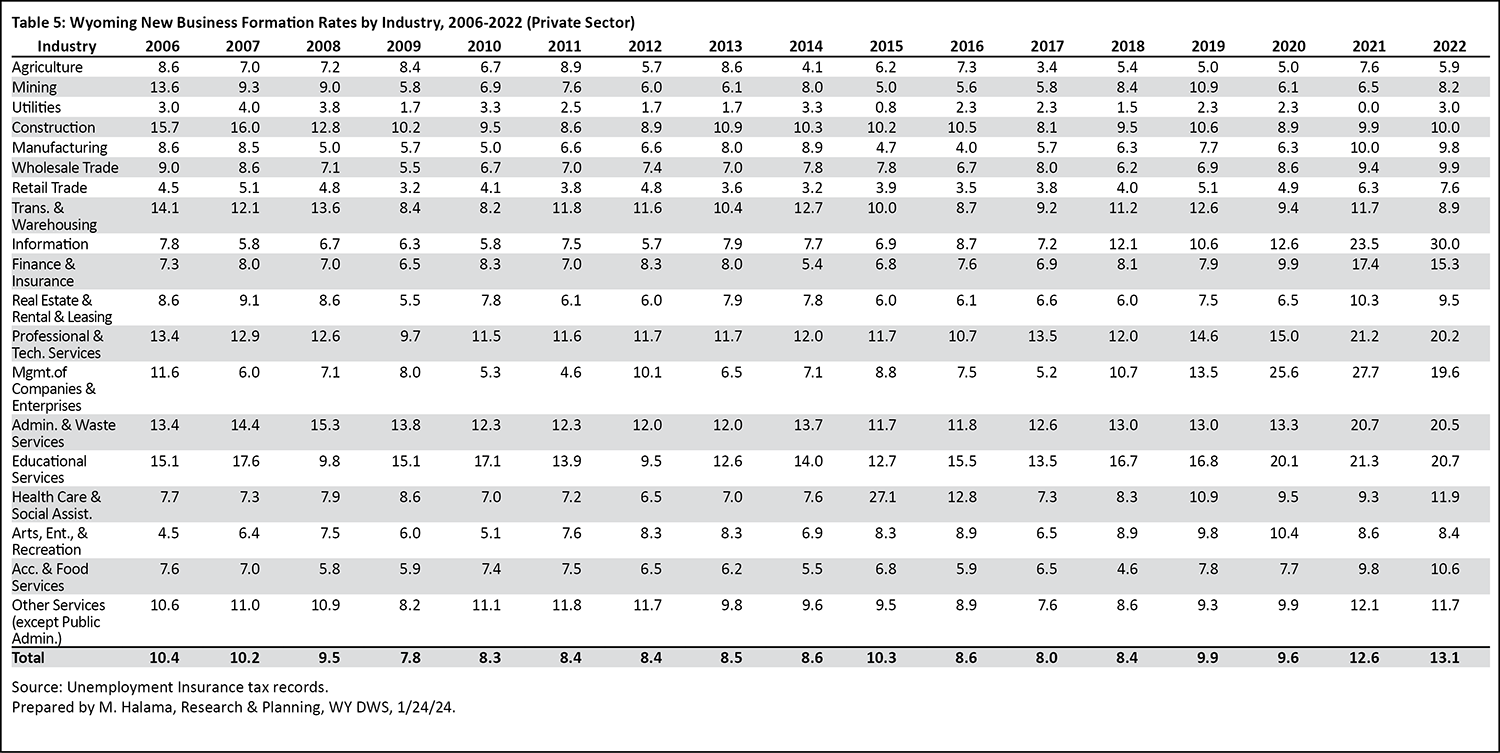
Formation rate by industry is calculated by dividing the number of new businesses in an industry in a given year by the total number of businesses in that industry for the same year.
Table 5 shows that some industries’ formation rates fluctuated largely from year to year. For example, mining had new business formation rates of 13.6% in 2006 and 5.0% in 2015, while educational services had rates of 21.3% in 2021 and 9.5% in 2012. In 2022, 10 industries had new business formation rates of 10% or greater: information (30.0%), educational services (20.7%), administrative & waste services (20.5%), professional & technical services (20.2%), management of companies & enterprises (19.6%), finance & insurance (15.3%), health care & social assistance (11.9%), other services (11.7%), accommodation & food services (10.6%), and construction (10.0%).
Initial Firm Size
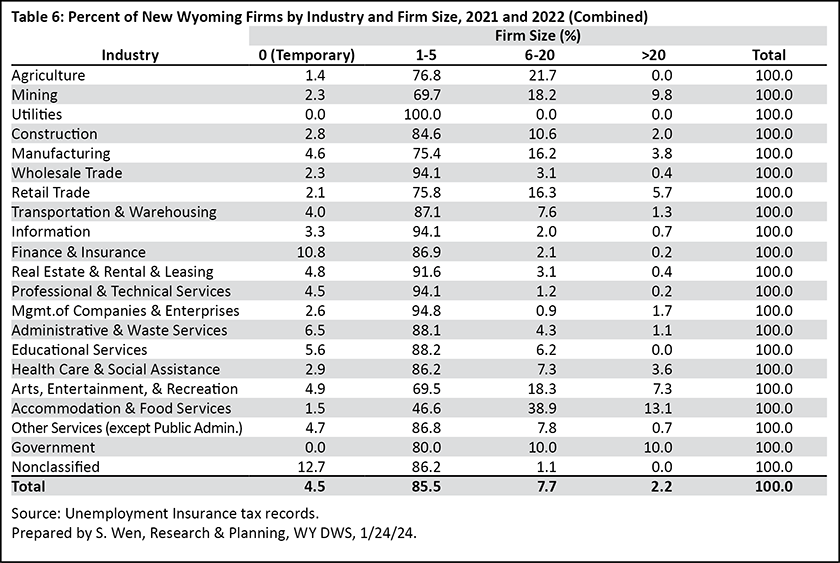
Initial firm size refers to the number of employees a business had upon formation. The vast majority (85.5%) of the new firms that opened in 2021 and 2022 were small-sized, with five or fewer employees (see Table 6). An additional 7.7% had six to 20 employees (medium-sized), while 2.2% had more than 20 employees (large-sized).
The remaining 4.5% had zero employees, or only hired temporary employees for the first two quarters in operation. These firms had an average quarterly employment of zero for both beginning quarters, but their wage data showed that they paid someone during these two quarters.
The similar distribution pattern of firm sizes has been consistent since 1993. Among private industries, 13.1% of new businesses in accommodation & food services were large-sized, followed by mining (including oil & gas) at 9.8%.
More than one-third (38.9%) of new firms in accommodation & food and more than one-fifth (21.7%) in agriculture were considered medium-sized. Interestingly, 10.8% of new firms in finance & insurance used only temporary or part-time employees in their first two quarters of business.
Business Survival
Information about the prospects of a business surviving in a given industry and location can help individuals who are planning to open a business. This type of information may also help the Wyoming Business Council and other public and private funding sources for new ventures to develop practical strategies to ensure greater return on investment when choosing to back an entrepreneur’s new firm.
Due to the limited information on business transitions such as selling, merging, and dividing, R&P only considers firm survival relative to the original owners in this research. Some firms may still operate but have changed ownership and those firms would not be included in these survival counts.
A firm’s survivability depends on many factors, such as the sustained availability of supply for a product or service, sustained demand for a given product or service, competition from similar businesses, government policies and regulations, labor negotiation, and location.
For this research, a business still reporting employment and wage information to the UI Tax Division of the Wyoming Department of Workforce Services one year after opening is considered having survived one year. The one-year survival rate is calculated by dividing the number of one-year survivals by the total number of new firms. The same method is used to determine the two-, three-, four-, five-, and 10-year business survivals and survival rates. In order to obtain a general pattern of survival rates in Wyoming and avoid variation in individual years, all records since the fourth quarter 1992 that met the specific requirement for each survival rate were used in this analysis.
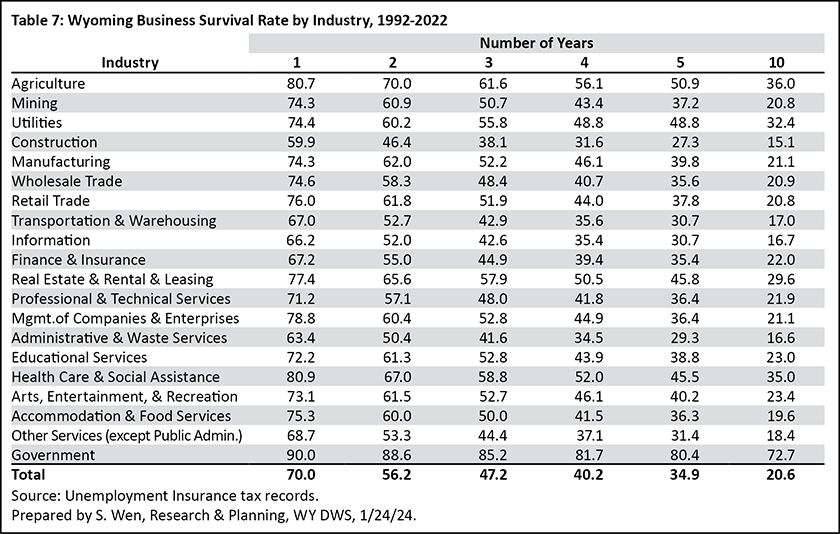
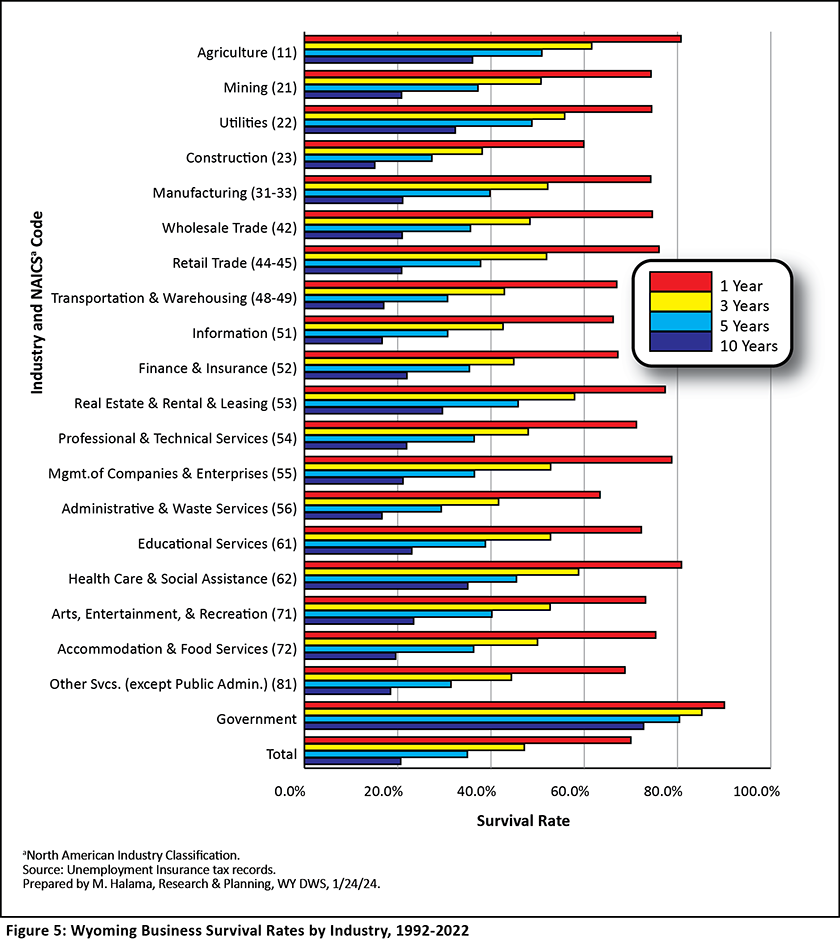
Statewide, more than two-thirds (70.0%) of new firms survived one year after opening and more than one-third (34.9%) were still active after five years (see Table 7 and Figure 5). Survival rates tend to get smaller as the number of years in business increase.
Industries face different challenges in their operations and their survival rates could vary largely. For example, among all private industries, 61.6% of new firms in agriculture were still in business three years after opening, while only 38.1% in construction were still in operation. Construction had the lowest survival rates recorded across all years observed. This could be directly related to the large portion of temporary projects such as roads, oil and gas pipelines, and buildings. Over half of the firms in agriculture (50.9%) and nearly half of the firms in utilities (48.8%), real estate & rental & leasing (45.8%), and health care & social assistance (45.5%) survived five years after opening. Over one-third of new firms in agriculture (36.0%) and health care & social assistance (35.0%), and nearly one-third of new firms in utilities (32.4%) were still active after 10 years in business.
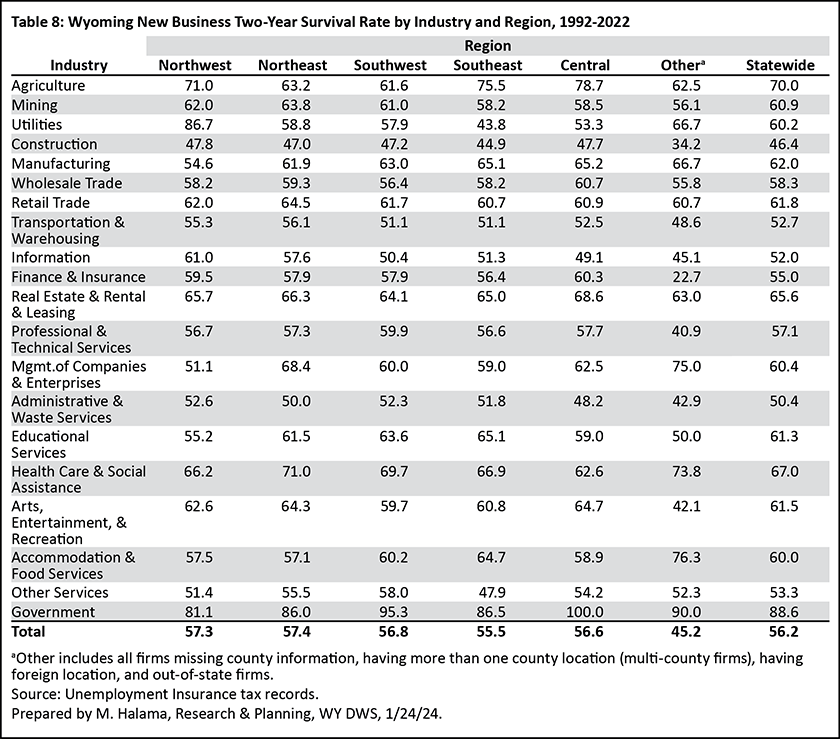
A firm’s location could be a very important factor to survivability. For example, 86.7% of new firms in utilities in Wyoming's northwest region were still in business after two years, while 43.8% were in business after two years in the southeast region (see Table 8). Firms in management of companies & enterprises had a two-year survival rate of 68.4% in the northeast region compared to 51.1% in northwest. Some industries had very similar two-year survival rates in all five regions of the state, such as construction, which ranged from 44.9% to 47.8%, and administrative & waste services, which ranged from 48.2% to 52.6%.
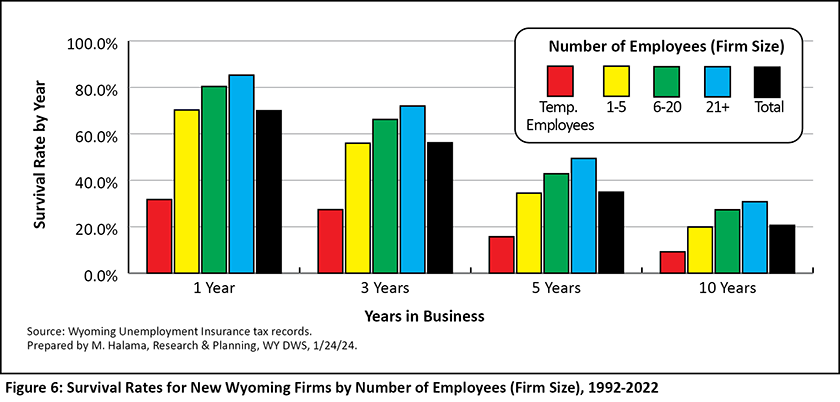
New firms’ survival rates vary largely by firm size. In general, larger sized firms had higher survival rates than the middle and small sized firms (see Figure 6). Firms that started with only temporary employees had the lowest survival rates. For example, 85.3% of larger-sized firms were still in business one year after opening and nearly half (49.4%) survived after five years. By comparison, among firms that started with only temporary hires, 31.7% survived one year and 15.7% survived five years. Larger firms with economies of scale will have competitive advantages over other sized firms, which could explain higher business survival rates.
Summary
A total of 3,761 new firms started businesses in Wyoming in 2022, an increase of 8.2% compared to 2021. Both years marked historical highs dating back to 1993, the first year for which research of this type is available.
Reference
Yu, S. (1995, June). New business formation: An economic development indicator. Wyoming Labor Force Trends, 55(6). Retrieved January 30, 2024, from https://doe.state.wy.us/LMI/0695/0695a1.htm
 Hire Wyo