Wyoming Labor Force Trends
January 2023 | Volume 60, No. 1
Click Here for PDF
Return to Table of Contents
2022Q2 Quarterly Update:
Mining, Leisure & Hospitality Drive Job Growth in Wyoming
by: Michael Moore, Research Supervisor
This article provides an overview of Wyoming’s employment and wages in second quarter 2022, as the state saw over-the-year increases in employment and wages for the fifth consecutive quarter. The data presented in this article are from the Quarterly Census of Employment and Wages, available online at https://doe.state.wy.us/LMI/toc_202.htm.
Introduction
Wyoming continued to recover from its most recent economic downturn in second quarter 2022 (2022Q2), adding more than 5,000 new jobs and nearly $300 million in total wages compared to the prior year (see Table 1). While average monthly employment and total wages increased from prior-year levels for the last five consecutive quarters, Wyoming has not yet returned to pre-pandemic employment levels.
This article compares data from 2022Q2 to data from the prior year at the county and industry levels, with special emphasis on Wyoming's mining and leisure & hospitality sectors. This article also compares current employment and wages to pre-pandemic years in order to obtain a better understanding of how different industries and counties are recovering from economic disruptions caused by the COVID-19 pandemic and job losses in the energy sector.
The data in this article are from the Quarterly Census of Employment and Wages (QCEW). Data from 2022Q2 are available at https://doe.state.wy.us/LMI/22Q2_QCEW/toc.htm.
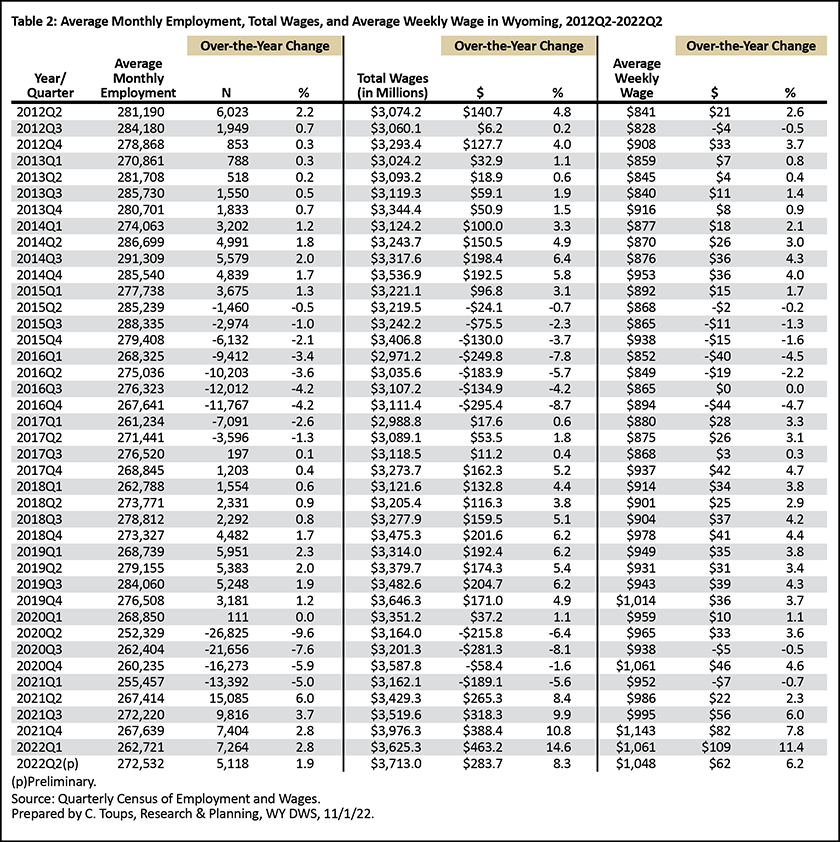
Wyoming’s average monthly employment in 2022Q2 was 273,532, an increase of 5,118 jobs (1.9%) compared to 2021Q2 (see Table 2). Total wages increased from $3.4 billion to $3.7 billion over the year ($283.7 million, or 8.3%) while the state's average weekly wage increased from $986 to $1,048 ($62, or 6.2%).
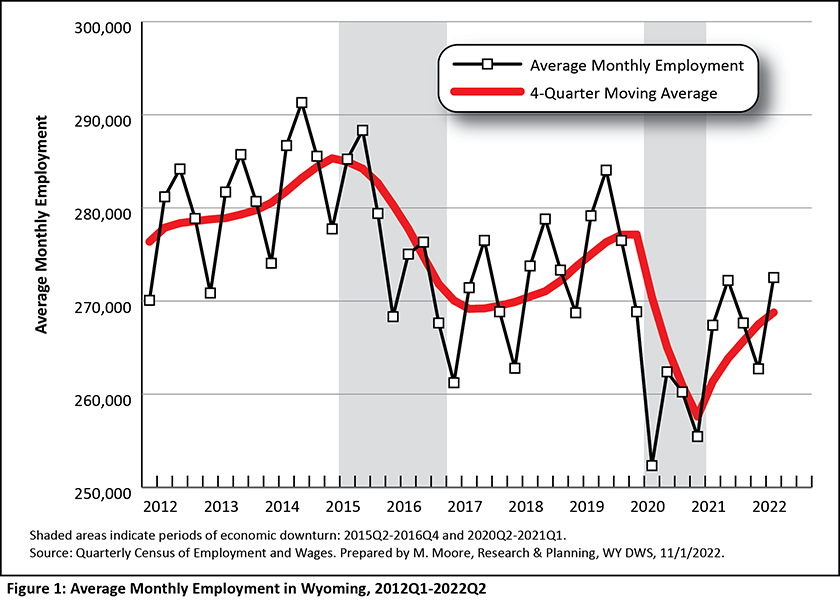
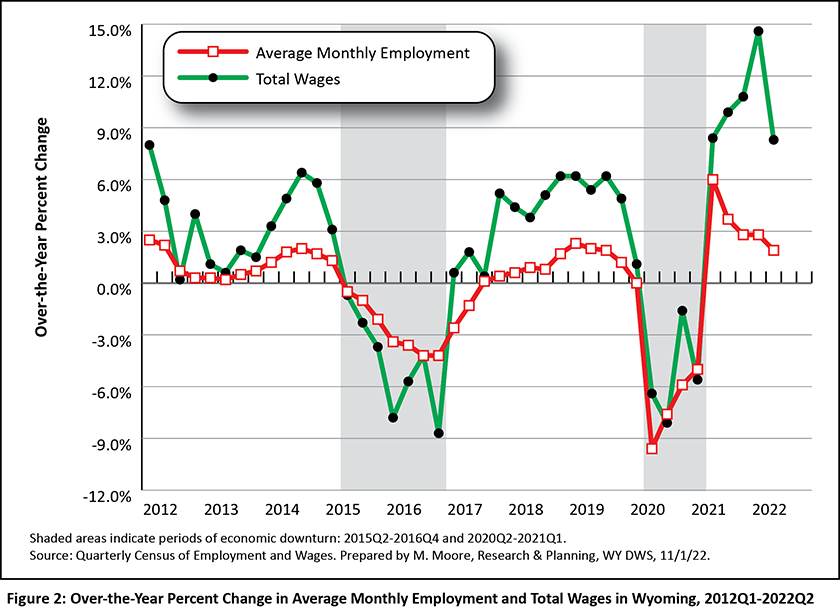
The Research & Planning (R&P) section of the Wyoming Department of Workforce Services has defined an economic downturn as a period of at least two consecutive quarters of over-the-year decrease in average monthly employment and total wages based on data from the QCEW (see Figure 1 and Figure 2). Wyoming has endured three such economic downturns since 2009: 2009Q1 to 2010Q1, 2015Q2 to 2016Q4, and 2020Q2 to 2021Q1. Wyoming’s most recent downturn was influenced by the COVID-19 pandemic and declines in the prices of and demand for the state’s energy resources. While each downturn had its own unique circumstances, declining energy prices preceded all three (Moore, 2019).
Wyoming has yet to return to pre-pandemic employment levels. In 2022Q2, the state's average monthly employment remained 2.3% lower compared to 2019Q2, or approximately 6,600 fewer jobs. Some industries, however, have exceeded their pre-pandemic employment levels, such as retail trade (Bullard, 2022a) and leisure & hospitality.
Industry
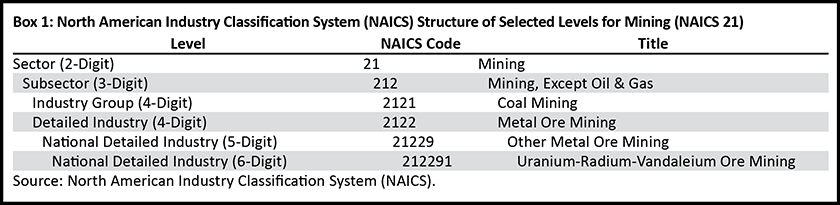
Industries are organized by the North American Industry Classification System (NAICS). A sample of the NAICS hierarchal structure for mining (NAICS 21) can be found in Box 1.
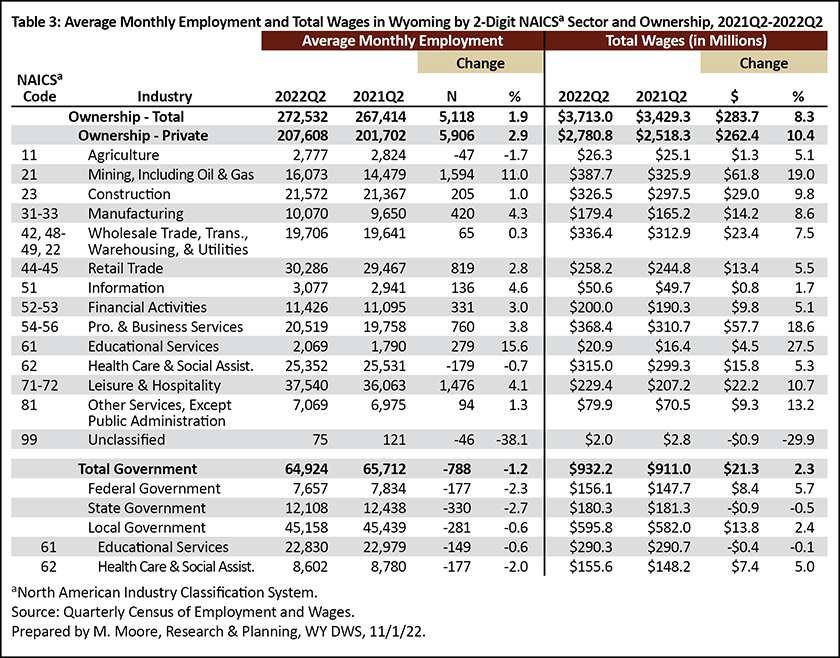
Table 3 shows employment and wages at the two-digit sector level. Nearly all private industries showed substantial over-the-year employment gains, led by mining, including oil & gas (1,594 more jobs, or 11.0%) and leisure & hospitality (1,476, or 4.1%). In fact, of the 5,118 new jobs from 2021Q2 to 2022Q2, approximately six in 10 (59.9%) were in one of these two industries. Other industries with substantial over-the-year job gains included retail trade (819, or 2.8%), professional & business services (760, or 3.8%), and manufacturing (420, or 4.3%). Job losses were seen in Wyoming's health care & social assistance (-179, or -0.7%) and agriculture (-47, or -1.7%) industries.
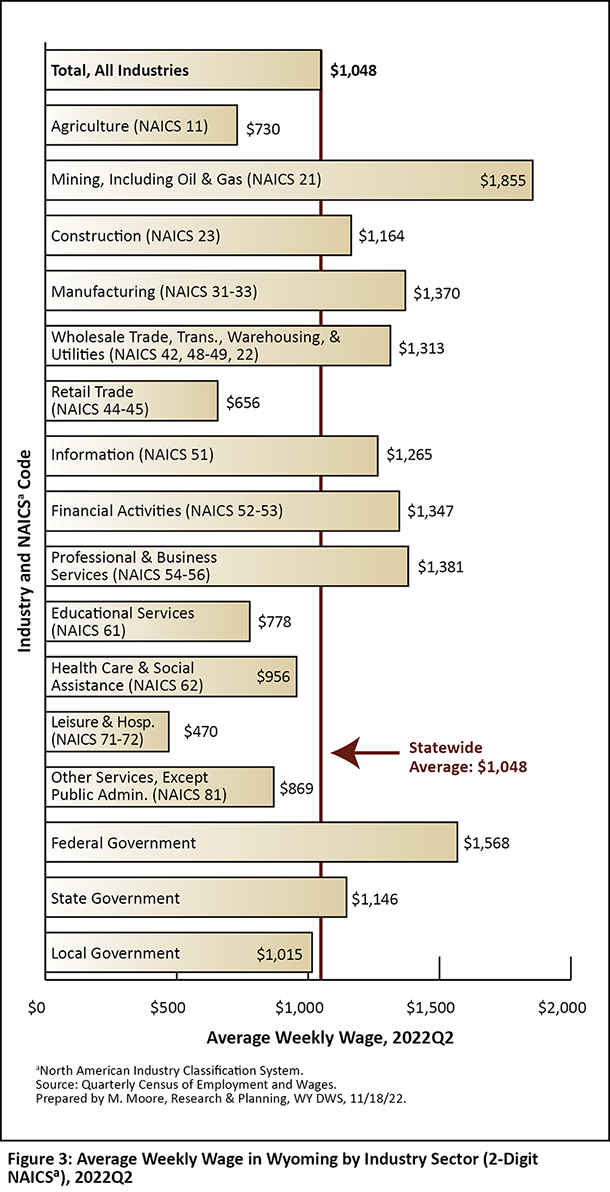
Wyoming's public sector also saw job losses, as employment in total government fell by 788 jobs (-1.2%). State government saw the greatest over-the-year decrease in employment (-330, or -2.7%), followed by local (-281, or -0.6%) and federal (-177, or -2.3%) government. Across all industries, Wyoming's average weekly wage in 2022Q2 was $1,048 (see Figure 3). The highest weekly wages were found in mining, including oil & gas ($1,855), federal government ($1,568), professional & business services ($1,381), and manufacturing ($1,370). The industries with the lowest weekly wages were leisure & hospitality ($470), retail trade ($656), and agriculture ($730).
As previously mentioned, nearly 60% of all new jobs from 2021Q2 to 2022Q2 were found in mining and leisure & hospitality. This article provides detailed information for these two industries for selected subsectors (three-digit), industry groups (four-digit), and detailed national industries (six-digit). Figures 4, Figure 5, and Figure 6 illustrate employment and wage trends in mining and leisure & hospitality over the last 10 years. The data used to construct these three figures are available online at https://doe.state.wy.us/LMI/QCEW_OTY/toc.htm.
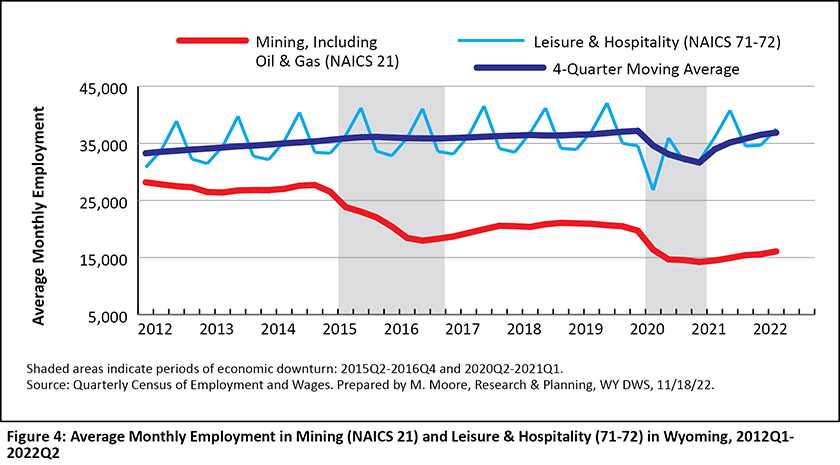
Wyoming's mining industry saw substantial job losses during the two most recent economic downturns (see Figure 4). As noted by Gallagher (2016), the downturn that lasted from 2015Q2 to 2016Q4 was driven by the “substantial decline in the prices of oil, an extended period of low natural gas prices, and the erosion in the price of coal." Employment in mining fell from 26,527 in 2015Q1 just prior to the downturn to 17,961 in 2016Q3 (-8,566 jobs, or -32.3%). In other words, Wyoming lost approximately one-third of its mining jobs during that downturn. Mining experienced moderate job growth from 2017 to 2019; however, job losses in mining preceded the COVID-19 pandemic by three quarters, and employment fell to a decade low of 14,216 in 2021Q1. Mining employment continued to decrease from prior-year levels through 2021Q2, but has since increased during each of the last four quarters. However, mining employment has not returned to pre-pandemic levels.
In contrast, Wyoming's leisure & hospitality sector experienced slow, steady growth from 2012 through 2019 and was largely unaffected by the 2015-2016 downturn. However, leisure & hospitality was hit harder than any other industry during the COVID-19 pandemic, and lost more than one-fourth of its jobs (-10,255, or -27.6%) from 2019Q2 to 2020Q2 (Moore, 2021). Employment in leisure & hospitality dropped to a 20-year low during the pandemic, but increased during the last two years and surpassed pre-pandemic levels.
Employment in leisure & hospitality has historically been greater compared to mining (see Figure 4). However, the gap has widened considerably over the last decade because of substantial mining job losses. In 2012Q2, the 27,830 jobs in mining accounted for nearly one in 10 (9.9%) of the state's total, while the 33,728 leisure & hospitality jobs made up 12.0% (Research & Planning, 2022). In 2022Q2, mining contributed closer to one in 20 jobs (5.9%) to the statewide total, while leisure & hospitality accounted for 13.8%.
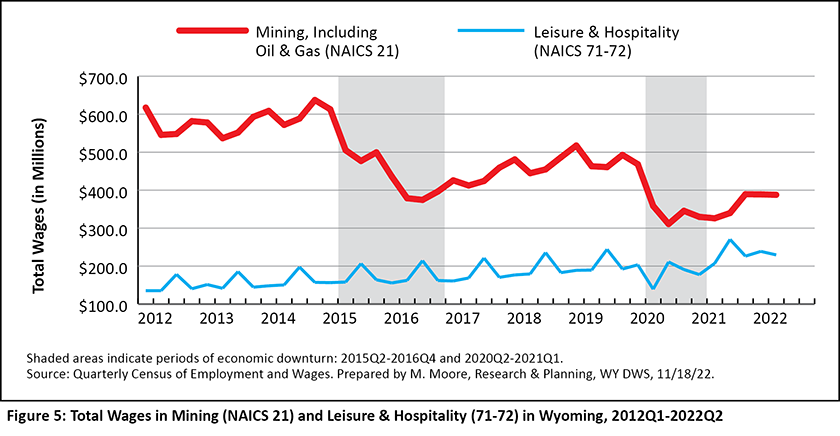
Mining historically contributed more wages to the statewide total than any other industry. For example, Bullard (2015) noted that in 2015Q1, mining paid approximately $1 of every $5 of Wyoming's total wages. But as illustrated in Figure 5, total wages in mining have decreased substantially since the 2015-2016 economic downturn, and fell to a decade low during the 2020-2021 downturn. Total wages in mining peaked at $637.4 million in 2014Q4, and fell to a decade low of $245.4 million in 2020Q3.
As the gap in average monthly employment between mining and leisure & hospitality widened over the last decade, the difference in total wages in those two industries narrowed. In 2021Q2, the $545.5 million in total wages in mining accounted for 17.7% of the state's total wages, while the $135.2 million in total wages in leisure & hospitality made up just 4.4% of the total. In 2022Q2, mining contributed 10.4% of Wyoming's total wages ($229.4 million), while leisure & hospitality contributed 6.2% ($229.4 million).
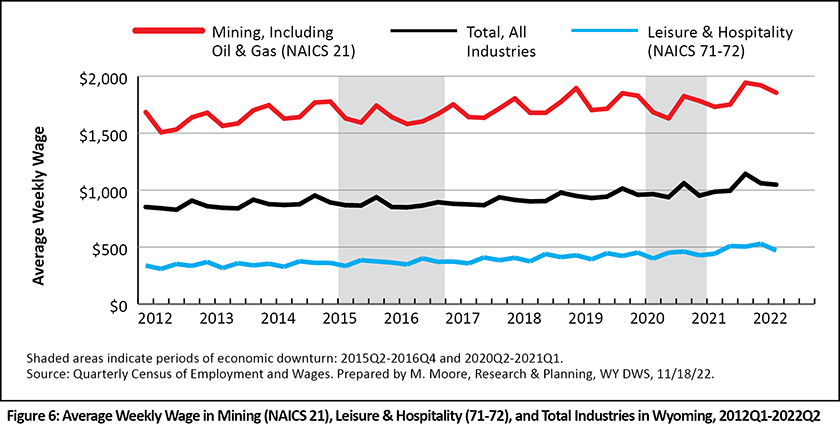
As mentioned earlier in this article, mining had the highest average weekly wage in 2022Q2, while leisure & hospitality had the lowest. As shown in Figure 6, this has not changed much over time.
Mining, Including Oil & Gas (NAICS 21)
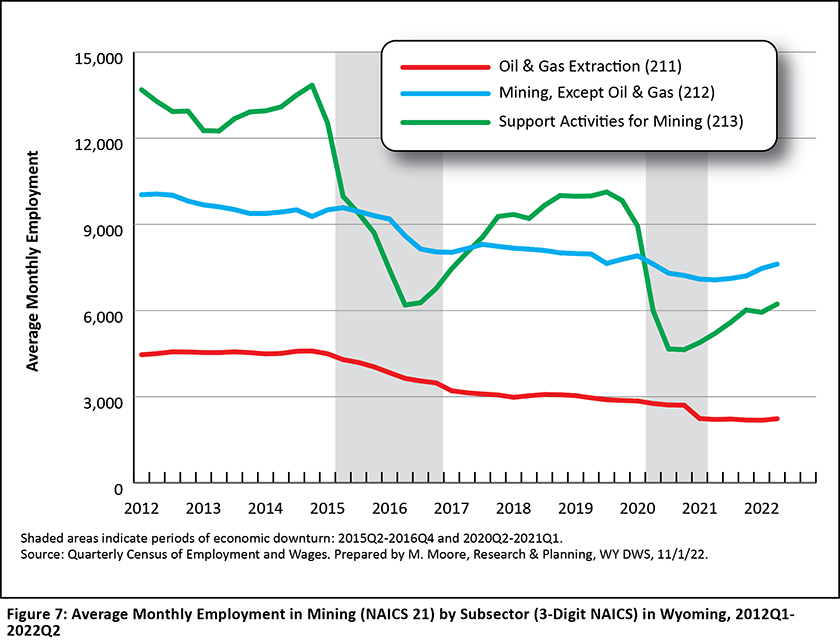
Wyoming's mining sector (NAICS 21) is comprised of three subsectors: oil & gas extraction (NAICS 211), mining, except oil & gas (NAICS 212), and support activities for mining (NAICS 213).
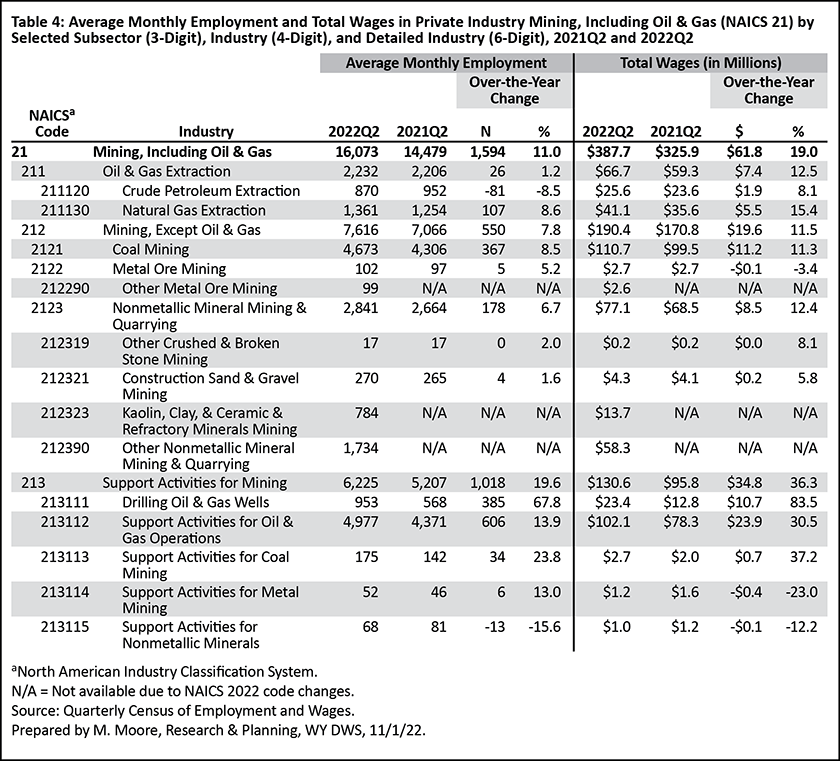
Of the three subsectors, the greatest job increases in 2022Q2 were found in support activities for mining (1,018 new jobs, or 19.6%; see Table 4). Within this subsector, the bulk of the new jobs were found in support activities for oil & gas operations (606, or 13.9%) and drilling oil & gas wells (385, or 67.8%).
The volatility in terms of employment in support activities for mining can be seen in Figure 7, with substantial job losses during periods of economic downturn. For example, during the 2015-2016 downturn, support activities for mining lost nearly 9,000 jobs. This subsector gained back about half of those jobs after 2016, but employment fell to a decade low 4,636 jobs in 2020Q4 during the most recent economic downturn.
More information on support activities for mining can be found in the related article in this month's issue of Wyoming Labor Force Trends.
Mining, except oil & gas added 550 new jobs over the year, an increase of 7.8%. This subsector includes coal mining, which added 367 new jobs, an increase of 8.5%. This marked the second consecutive quarter of over-the-year job growth in coal mining and the largest growth since 2009Q1, when coal mining added 390 jobs from the prior year (Research & Planning, 2022). As shown in Figure 7, employment in this subsector steadily decreased over the last 10 years, though some job gains were seen in recent quarters.
Oil & gas extraction increased slightly from 2,206 in 2021Q2 to 2,232 in 2022Q2 (26 jobs, or 1.2%). Within this subsector, natural gas extraction added 107 jobs while crude petroleum extraction lost 81. Employment in oil & gas extraction consistently trended downward for the last 10 years, with substantial job losses seen during economic downturns.
Leisure & Hospitality (NAICS 71-72)
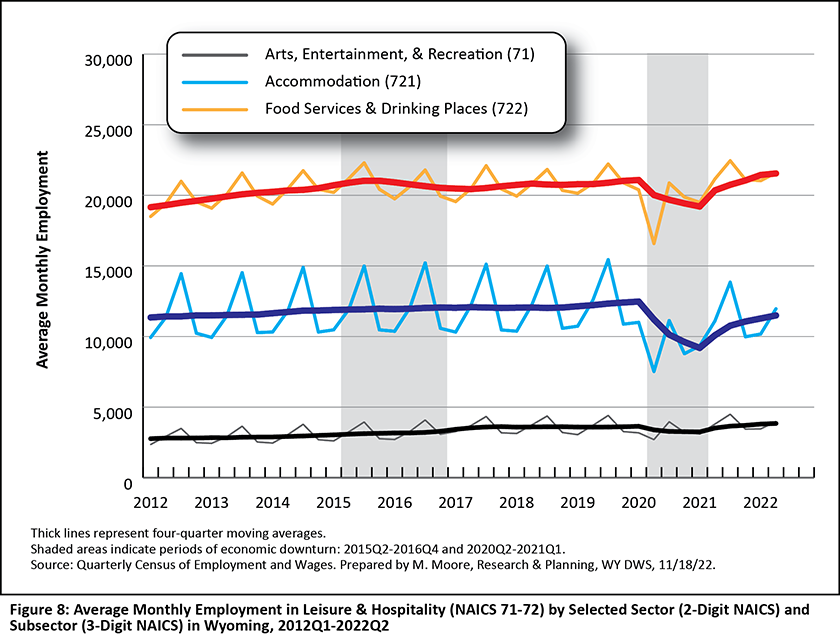
Leisure & hospitality is a supersector is comprised of two sectors: arts, entertainment, & recreation (NAICS 71) and accommodation & food services (NAICS 72). Leisure & hospitality added 1,476 jobs from 2021Q2 to 2022Q2, an increase of 4.1%. The majority of new jobs were found in accommodation (860, or 7.7%) and food services & drinking places (440, or 2.1%).
Figure 8 shows average monthly employment in leisure & hospitality broken out into the arts, entertainment, & recreation sector and the accommodation and food services & drinking places subsectors. As illustrated in Figure 8, employment in food services & drinking places reached a decade high in 2022Q2, while employment in accommodation had not returned to pre-pandemic levels despite over-the-year job growth in recent quarters.
The majority of jobs in this supersector are found in accommodation (such as traveler accommodation and RV parks & recreational camps) and restaurants & other eating places.
County
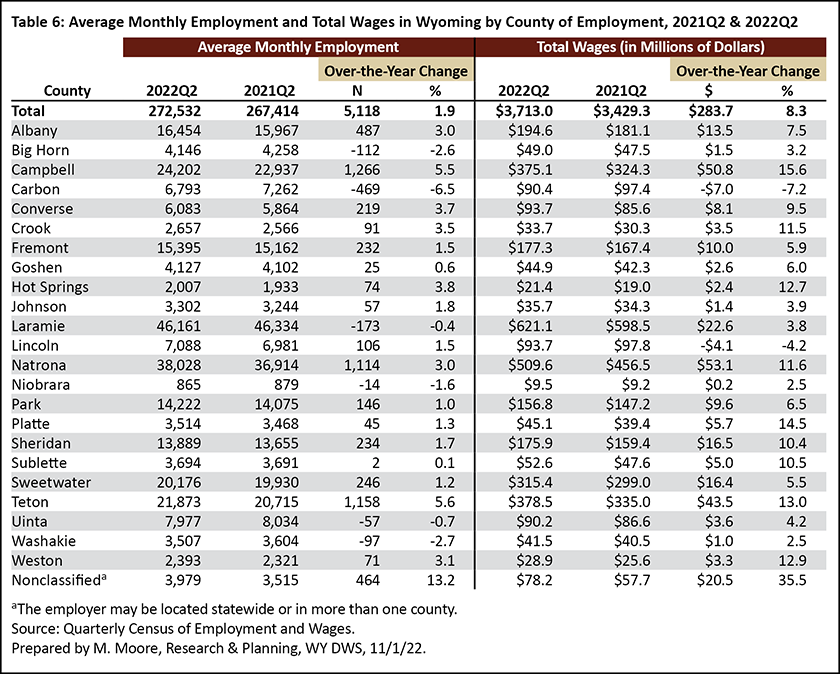
All but six of Wyoming's 23 counties experienced over the-year job growth in 2022Q2, with the greatest increases seen in Campbell (1,266 jobs, or 5.5%), Teton (1,158, or 5.6%), Natrona (1,114, or 3.0%), and Albany (487, or 3.0%) counties (see Table 6). The greatest job losses were seen in Carbon (-469, or -6.5%), Laramie (-173 jobs, or -0.4%), Big Horn (-112, or -2.6%), and Washakie (-97, or -2.7%) counties.
Every county saw an increase in total wages over the year. The greatest increases were found in Natrona ($53.1 million, or 11.6%), Campbell ($50.8 million, or 15.6%), Teton ($43.5 million, or 13.0%), and Laramie ($22.6 million, or 3.8%).
Pre-Pandemic Levels
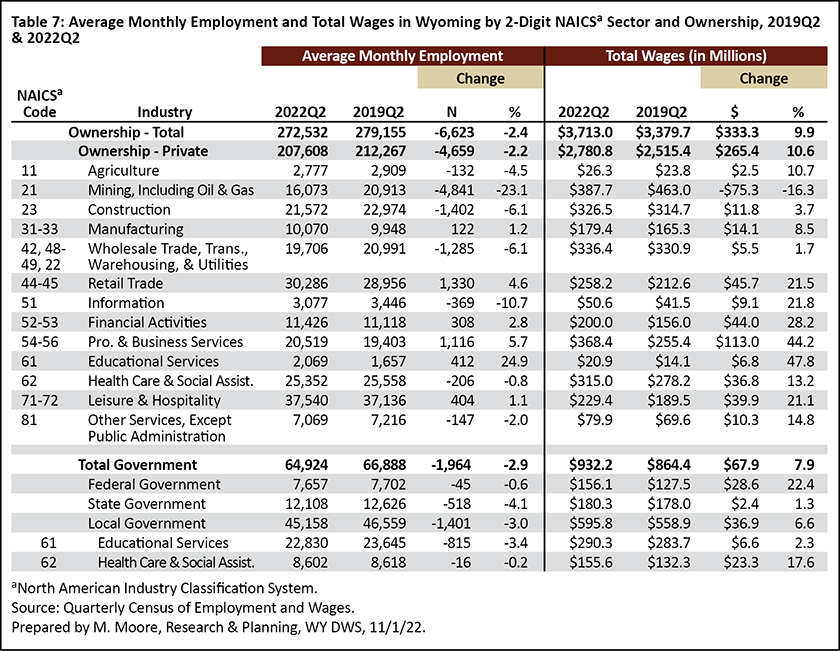
Despite five consecutive quarters of over-the-year job growth, Wyoming has not returned to pre-pandemic employment levels. There were approximately 6,600 fewer jobs in 2022Q2 compared to 2019Q2 (see Table 7). Employment in Wyoming's mining sector, for example, remained especially low, with nearly 5,000 fewer jobs (-23.1%). Other industries that continued to lag behind pre-pandemic employment levels included construction (-1,402 jobs, or -6.1%) and wholesale trade, transportation, & utilities (-1,285, or -6.1%).
Some industries have actually surpassed pre-pandemic employment levels from 2019Q2, including retail trade (1,330 more jobs, or 4.6%), professional & business services (1,116, or 5.7%), educational services (412, or 24.9%), and leisure & hospitality (404, or 1.1%). A recent Trends article looked at how Wyoming's retail trade industry has changed over the last 20 years (Bullard, 2022b). The article noted growth in subsectors such as building material & garden equipment & supplies dealers and sporting goods, hobby, book, & music stores, and job losses in subsectors such as nonstore retailers, gasoline stations, and general merchandise stores.
Total wages increased by $333.3 million (9.9%) from 2019Q2 to 2022Q2. Nearly all industries saw increases in total wages during this period. The greatest increases were found in professional & business services ($113.0 million, or 44.2%), retail trade ($45.7 million, or 21.5%), financial activities ($44.0 million, or 28.2%), and leisure & hospitality ($39.9 million, or 21.1%). The only decrease in total wages was found in mining (-$75.3 million, or -16.3%).
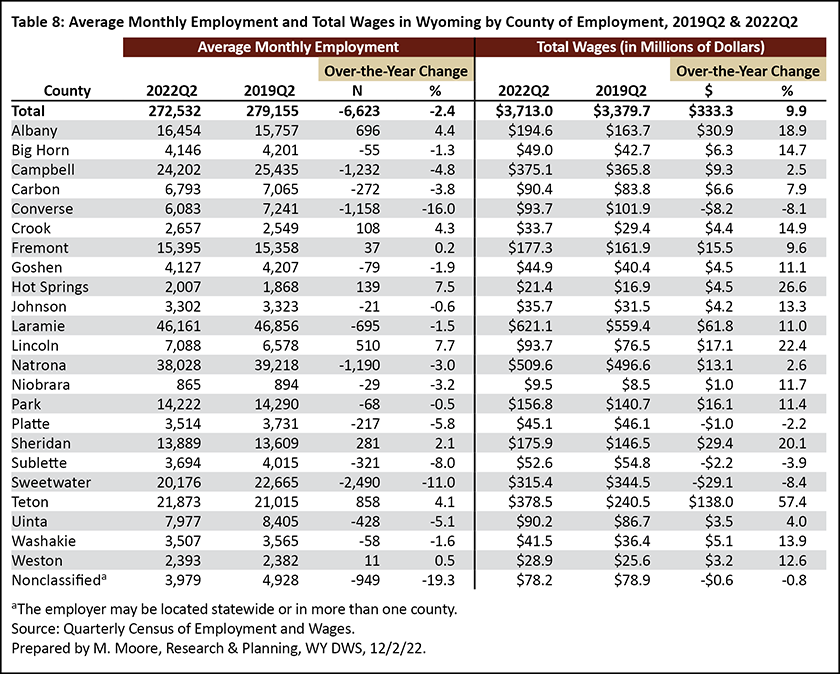
As shown in Table 8, employment was higher in eight of Wyoming's 23 counties in 2022Q2 compared to 2019Q2. The counties with the largest job growth included Teton (858 more jobs, or 4.1%), Albany (696, or 4.4%), Lincoln (510, or 7.7%), and Sheridan (281, or 2.1%). Employment remained lower compared pre-pandemic levels in the remaining 15 counties, such as Sweetwater (-2,490 jobs, or -11.0%), Campbell (-1,232, or -4.8%), Natrona (-1,190, or -3.0%), and Converse (-1,158, or -16.0%).
All but four counties saw increases in total wages, led by Teton ($138.0 million, or 57.4%), Laramie ($61.8 million, or 11.0%), Albany ($30.9 million, or 18.9%), and Sheridan ($29.4 million, or 20.1%). The greatest loss in total wages was found in Sweetwater County (-$29.1 million, or -8.4%).
Conclusion
Wyoming added more than 5,000 jobs and approximately $284 million in total wages from 2021Q2 to 2022Q2. Mining and leisure & hospitality experienced the greatest job growth, accounting for nearly two out of every three (59.9%) new jobs.
Despite five consecutive quarters of over-the-year job growth, Wyoming's employment did not return to pre-pandemic levels as of 2022Q2. Wyoming had approximately 6,600 fewer jobs (2.4% less) in 2022Q2 compared to 2019Q2.
Quarterly employment and wage data for Wyoming from the QCEW are available online at https://doe.state.wy.us/LMI/toc_202.htm. Data for 2022Q3 will be released on February 3, 2023, with a feature article planned for the April 2023 issue of Wyoming Labor Force Trends.
References
Bullard, D. (2015). Local jobs and payroll in Wyoming in First Quarter 2015: Job losses appear in the oil & gas sector. Wyoming Labor Force Trends, 10(52). Retrieved December 5, 2022, from https://doe.state.wy.us/LMI/trends/1015/1015.pdf
Bullard, D. (2022a, August). Pandemic job losses and recovery in Wyoming: A sector-by-sector review. Wyoming Labor Force Trends, (59)8. Research & Planning, WY DWS. Retrieved December 6, 2022, from https://doe.state.wy.us/LMI/trends/0822/a1.htm
Bullard, D. (2022b, November). Wyoming's changing retail trade sector, 2001-2021. Wyoming Labor Force Trends, (59)11. Research & Planning, WY DWS. Retrieved December 6, 2022, from https://doe.state.wy.us/LMI/trends/1122/a1.htm
Gallagher, T. (2016, April). Chapter 1: Economic analysis. Workforce Planning Report 2016, Wyoming Labor Force Trends, 53(4). Retrieved December 5, 2022, from https://doe.state.wy.us/LMI/trends/0416/a1.htm
Moore, M. (2019, May). Chapter 1: Introduction — Driven by demographics and downturns: Wyoming’s 2018 labor market at a glance. 2019 Wyoming Workforce Annual Report. Research & Planning, WY DWS. Retrieved December 6, 2022, from https://doe.state.wy.us/LMI/annual-report/2019/2019_Annual_Report.pdf
Moore, M. (2021, April). 2020Q3 quarterly update: Wyoming job losses continue in third quarter 2020. Wyoming Labor Force Trends, 58(4). Retrieved December 6, 2022, from https://doe.state.wy.us/LMI/trends/0421/0421.pdf
Research & Planning. (2022). Wyoming QCEW summary statistics by industry, 2001-2022: Total, all industries. Retrieved December 6, 2022, from https://doe.state.wy.us/LMI/QCEW_OTY/toc.htm


 Wyoming at Work
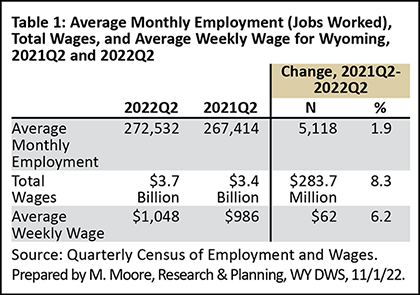