Wyoming Short-Term Industry and Occupational Employment Projections, 2025-2027
Click here to download Microsoft Excel file.
Click here to download the full publication (PDF).
Wyoming Projected to Add More than 6,000 Jobs from 2025-2027
by: Laura Yetter, Senior Economist
Wyoming is projected to gain more than 6,000 new jobs from second quarter 2025 (2025Q2) to second quarter 2027 (2027Q2), according to the newest short-term industry and occupational projections from the Research & Planning (R&P) section of the Wyoming Department of Workforce Services. This is a 2.1% increase in the number of jobs in Wyoming.
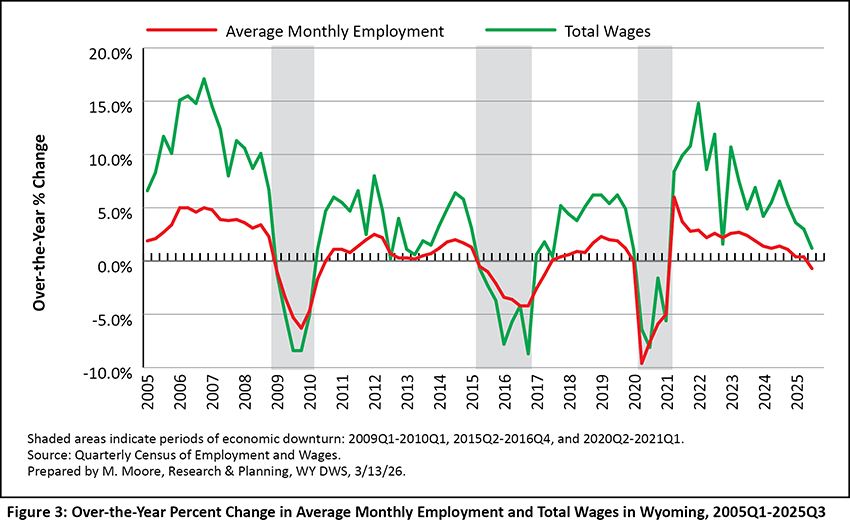
Projections are based on historical trends of how employment levels respond to market conditions. Wyoming experienced three periods of economic downturn over the last 15 years: 2009Q1 to 2010Q1, 2015Q2 to 2016Q4, and 2020Q2 to 2021Q1 (see Figure 2 and Figure 3). An economic downturn is defined by R&P as a period of at least two consecutive quarters of over-the-year decrease in average monthly employment and total wages based on data from the Quarterly Census of Employment and Wages (QCEW).
The projections discussed in this article were prepared during a period of increased employment and wage growth for Wyoming; as noted by Moore (2026), 2025Q2 marked the 17th consecutive quarter (or more than four years) of over-the-year job growth. However, Moore also noted that job growth slowed in recent quarters, and the over-the-year job growth of just 0.4% in each of the first two quarters of 2025 marked the slowest back-to-back job growth dating back to 2017Q3 and 2017Q4, when Wyoming was recovering from a lengthy economic downturn. The slowing employment increases can be seen in Figure 2 and Figure 3.
Accordingly, the short-term projections discussed in this article also indicate smaller projected job growth compared to the 2024-2026 short-term projections published in 2025 (Yetter). The 2024-2026 projections were prepared during a period of stronger job growth for Wyoming, and indicated that Wyoming would add approximately 8,000 jobs in that two-year period, an increase of 2.8%.
Industry Projections
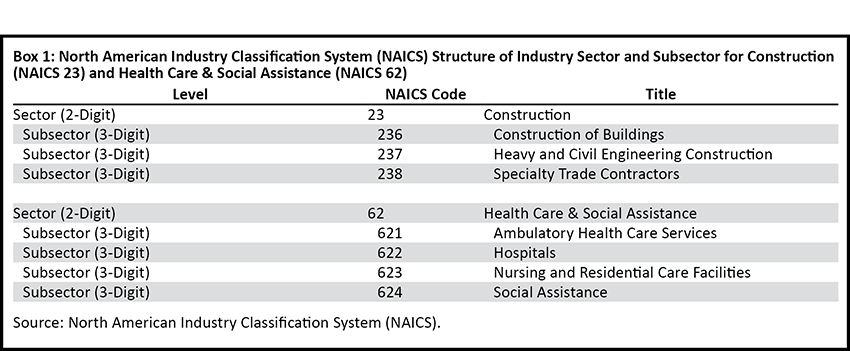
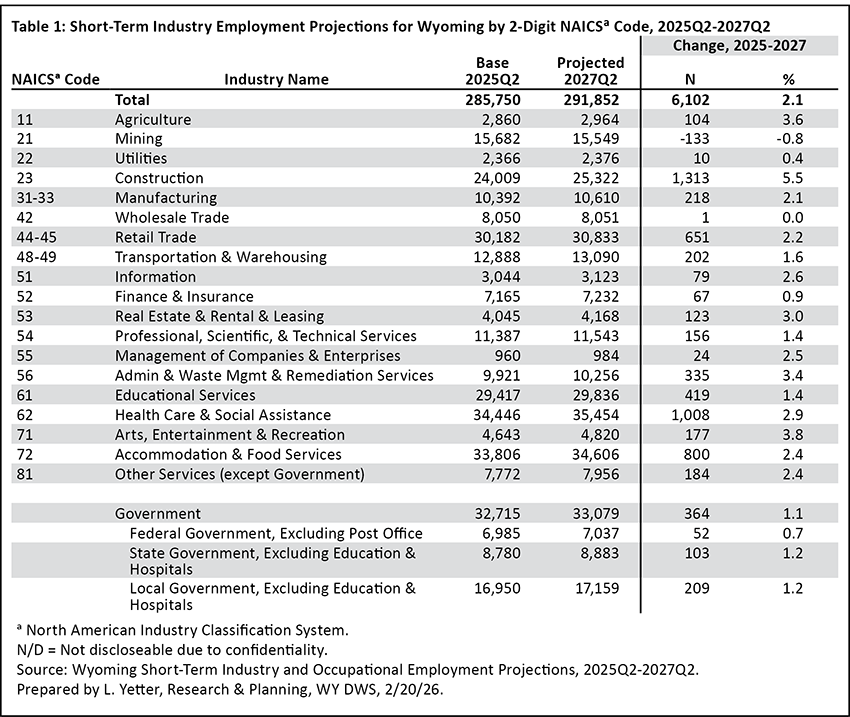
Industries are classified according to the North American Industry Classification System, (NAICS; see Box 1). The industry projections are developed at the three-digit NAICS subsector level and then summed to the two-digit major industries shown in Table 1. The full industry projections table with three-digit NAICS subsectors can be found in Table 6.
Short-term industry projections indicate that Wyoming’s employment is expected to increase by 2.1%, or 6,102 jobs. Construction is projected the see the greatest job growth, adding 1,313 jobs (5.5%). This is followed by health care & social assistance (1,008, or 2.9%), accommodation & food services (800, or 2.4%), and retail trade (651, or 2.2%).
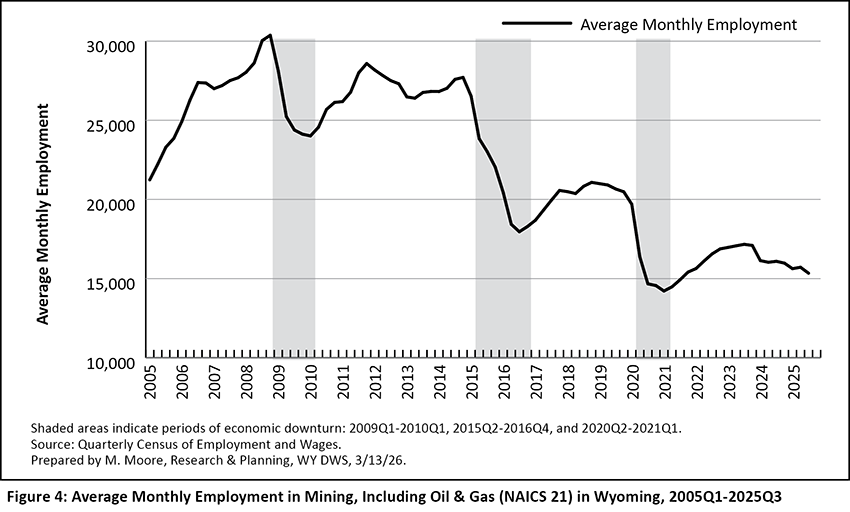
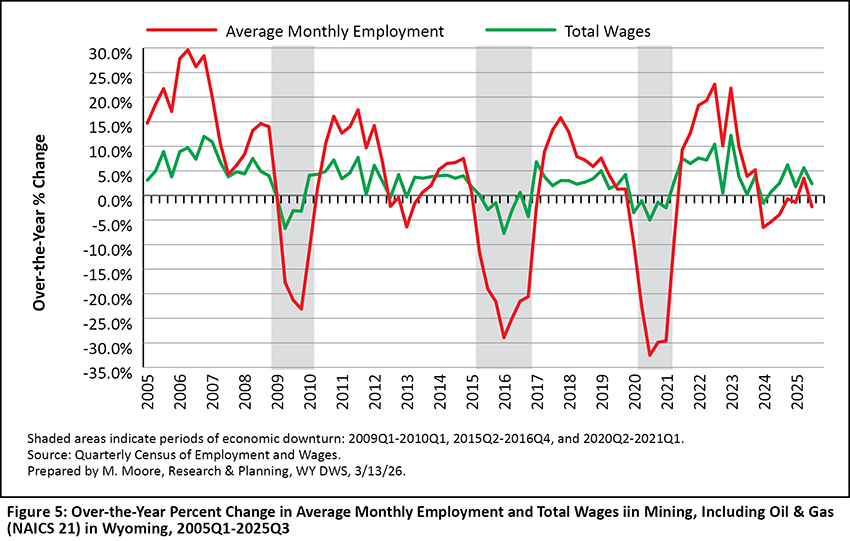
While nearly all industries are projected to add jobs over the next two years, Wyoming's mining sector is projected to lose 133 jobs (-0.8%). The job losses in mining are notable because this industry drives Wyoming's economy. Mining had three consecutive quarters of over-the-year job losses from 2024Q1 to 2024Q3, though some of those job losses were due to non-economic code changes (Moore, 2024). As previously mentioned, projections are developed based on recent historical trends. As illustrated in Figure 4 and Figure 5, Wyoming's mining sector saw six consecutive quarters of over-the-year job losses from 2024Q1 to 2025Q2.
Occupational Projections
Occupations are classified using the Standard Occupational Classification (SOC) system. This publication includes occupational projection tables for each two-digit major group (see Tables 7-29, pages 18-92) and by educational requirement (see Tables 30-36, pages 93-131).
The newest short-term occupational projections show Wyoming employment increasing by 6,547 jobs. This is slightly higher than the projected growth at the industry level, due to differences in the methodology. One key difference is that the industry projections are limited to wage and salary jobs, while the occupational projections also include estimates of the number of self-employed. The percent change of 2.1% is the same for both industry and occupational projections.
In addition to growth or decline, short-term occupational projections also take into consideration anticipated openings due to workers exiting the workforce (exits) or changing occupations (transfers) from 2025Q2 to 2027Q2. Total openings are the sum of projected growth or decline in the number of jobs in a given occupation, plus the number of exits and transfers.
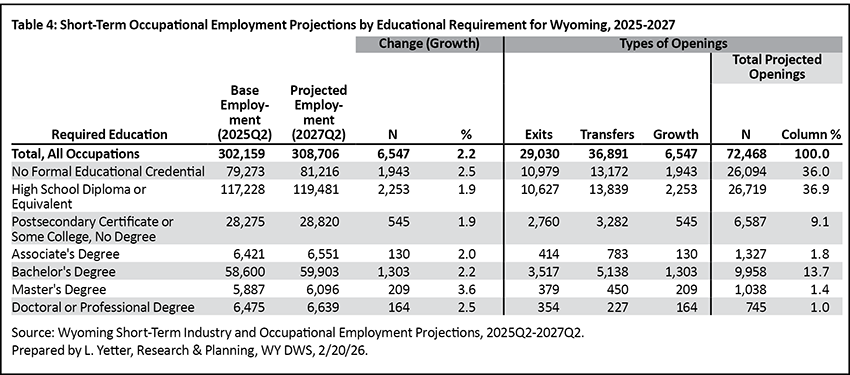
Projected growth or decline is a small component of total openings. In addition to approximately 6,500 job openings due to growth, Wyoming is projected to have 29,030 openings due to exits and 36,891 openings due to transfers, or 72,468 total openings.
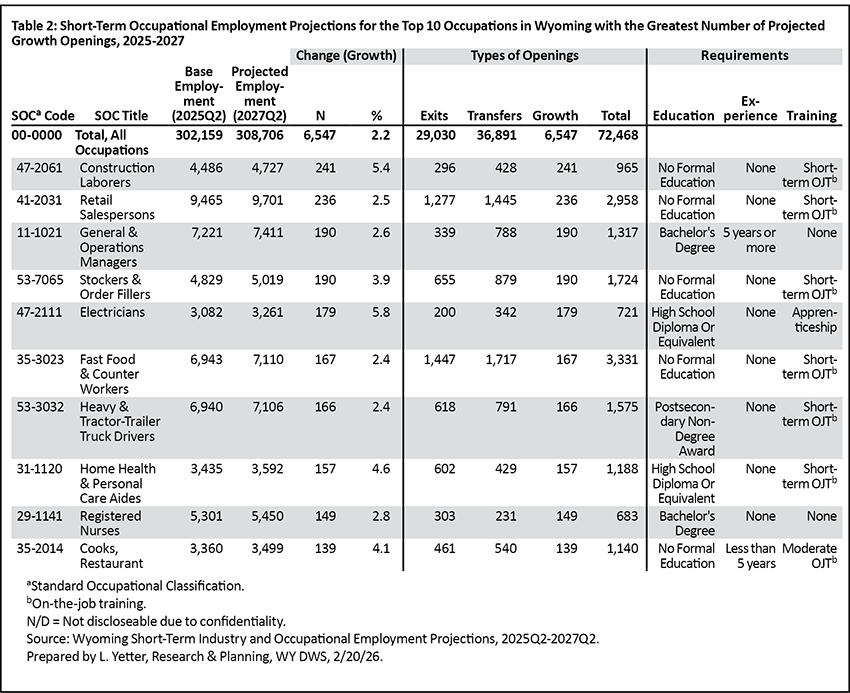
Table 2 shows the 10 occupations with the greatest number of openings due to growth. The greatest growth is projected for construction laborers (241, or 5.4%), followed by retail salespersons (236, or 2.5%), stockers & order fillers (190, or 3.9%), general & operations managers (190, or 2.6%), and electricians (179, or 5.8%). Of the 10 occupations with the greatest number of projected growth openings, three require more than a high school diploma: heavy & tractor-trailer truck drivers (post-secondary non-degree award), general & operations managers (bachelor's degree), and registered nurses (bachelor's degree). In addition, electricians require a high school diploma or equivalent and an apprenticeship.
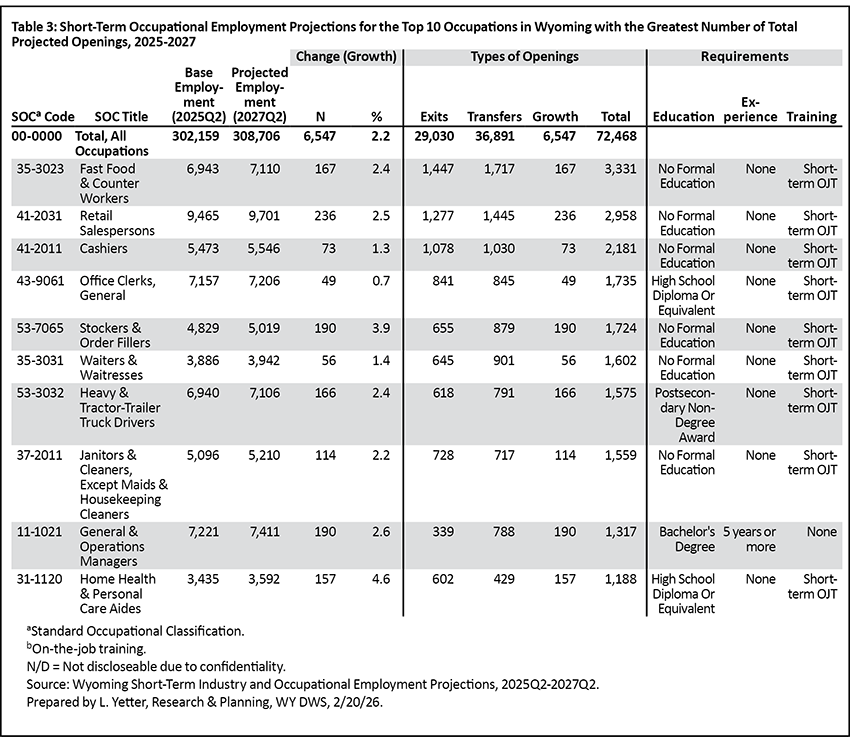
Table 3 shows the 10 occupations with the greatest number of total projected openings — the sum of exits, transfers, and growth. Many of these occupations are the same as those presented in Table 2, such as fast food & counter workers (3,331 total openings), retail salespersons (2,958), cashiers (2,1,81), and office clerks, general (1,735).
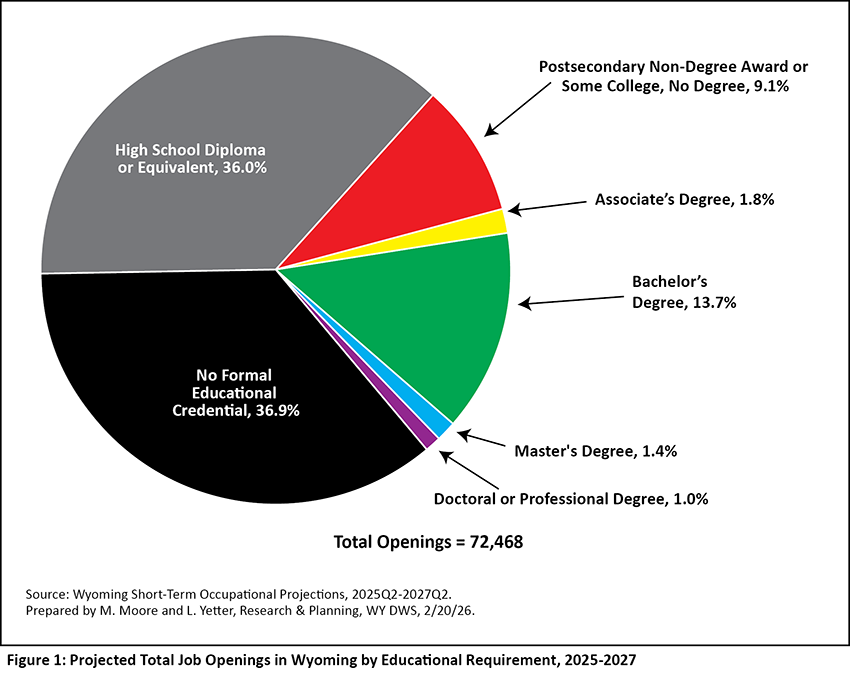
As shown in Table 4 and Figure 1, nearly three in every four (72.9%) of the 72,468 total projected openings require a high school diploma or less. Occupations requiring a bachelor's degree account for 13.7% of the total projected openings, followed by 9.1% that require a post-secondary non-degree award, or some college, no degree.
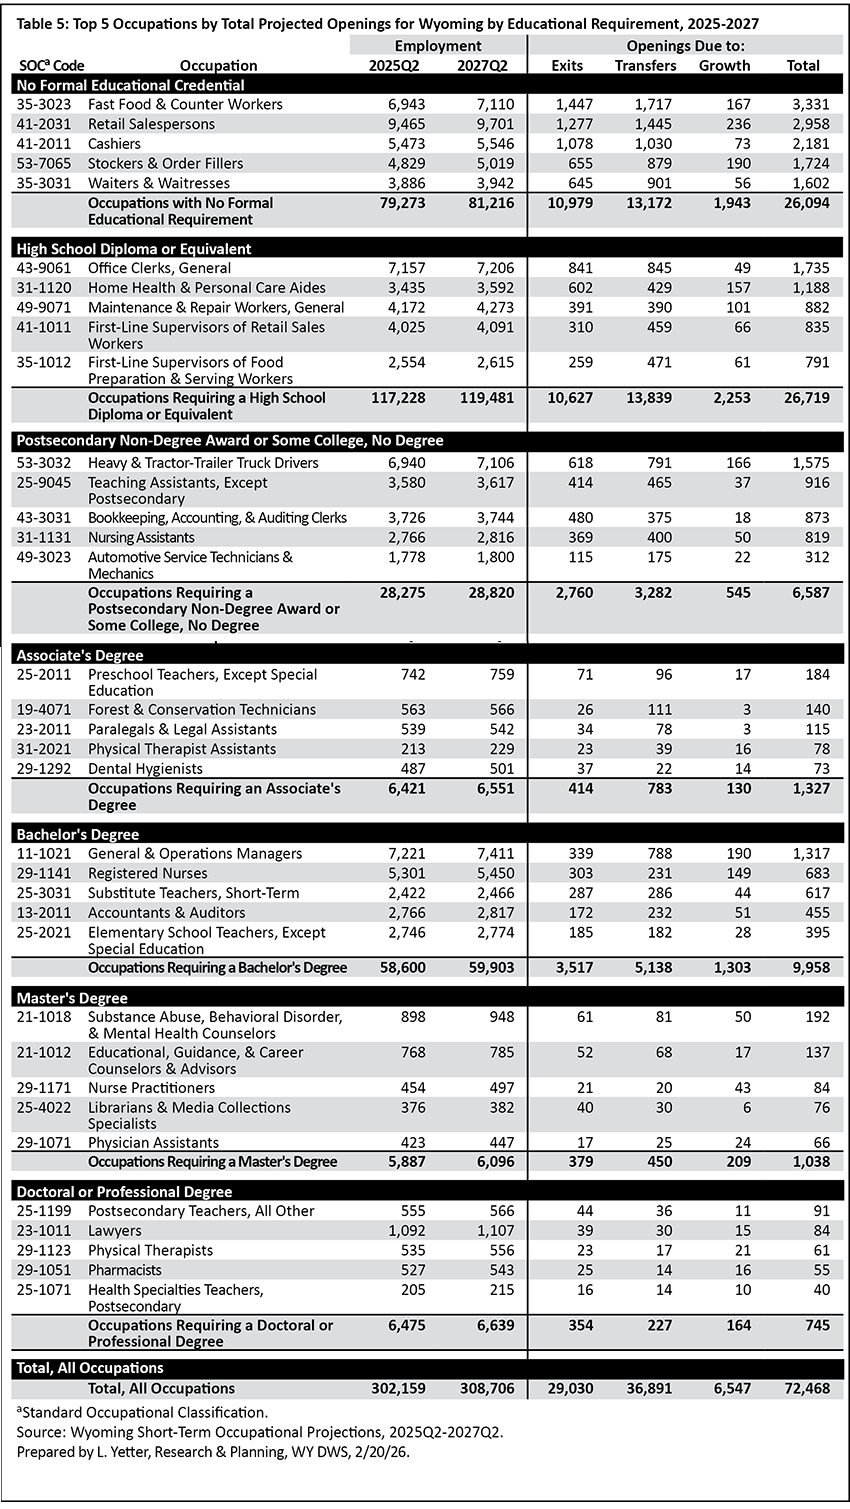
Table 5 shows the top five occupations by total projected openings for each type of educational requirement. Occupations with no formal educational requirement make up more than one in three (36.9%) total job openings. The occupations with the greatest projected openings in this group include fast food & counter workers (3,331) retail salespersons (2,958), cashiers (2,181), and stockers & order fillers (1,724).
Occupations requiring a high school diploma or equivalent account for the second largest proportion of total openings (36.0%). The greatest projected openings can be seen in occupations such as office clerks, general (1,735); home health & personal care aides (1,188); and maintenance & repair workers, general (882).
Occupations requiring a post-secondary non-degree award or some college, no degree, make up nearly one in 10 (9.1%) total projected openings. Of the 6,587 projected openings in this group, more than one in five (1,575) are heavy & tractor-trailer truck drivers. Other occupations requiring a post-secondary certificate or some college that have relatively large numbers of total projected openings include teaching assistants, except post-secondary (916); bookkeeping, accounting, & auditing clerks (873); and nursing assistants (819).
Occupations requiring an associate's degree account for 1.8% of total projected openings. The occupations with the greatest number of projected openings are preschool teachers, except special education (184); forest & conservation technicians (140), and paralegals & legal assistants (115).
Occupations requiring a bachelor's degree make up the greatest proportion of all occupations that require some post-secondary education, and account for 13.7% of all projected openings. General & operations managers show the greatest number of projected openings (1,317), followed by registered nurses (683) and short-term substitute teachers (617).
Occupations requiring a master's degree account for 1.4% of total projected openings. The occupations with the greatest projected openings are substance abuse, behavioral disorder, & mental health counselors (192); educational, guidance, school, & vocational counselors (137); nurse practitioners (84); and librarians & media collections specialists (76).
Finally, occupations requiring a doctoral or professional degree represent the fewest projected openings (74) of all educational groups and make up 1.0% of all projected openings. Postsecondary teachers, all other have the greatest number of projected openings (91), followed by lawyers (84), physical therapists (61), and pharmacists (55).
Conclusion
Based on recent historical trends, Wyoming is projected to add more than 6,000 new jobs from 2025 to 2027, an increase of 2.8%. Current and historical industry and occupational projections for Wyoming are available online at https://doe.state.wy.us/LMI/projections.htm.
References
Moore, M. (2024, October). 2024Q1 quarterly update: Wyoming jobs, total wages grow for 12th consecutive quarter. Wyoming Labor Force Trends, 61(10). Research & Planning, WY DWS. Retrieved March 18, 2026, from https://doe.state.wy.us/LMI/trends/1024/a1.htm
Moore, M. (2026, March). 2025Q2 quarterly update: Minimal Job Growth Continues, Led by Construction. Wyoming Labor Force Trends, 63(3). Research & Planning, WY DWS. Retrieved March 18, 2026, from https://doe.state.wy.us/LMI/trends/0326/a2.htm
Yetter, L. (2025, March). Wyoming Short-Term Industry and Occupational Employment Projections, 2024-2026. Research & Planning, WY DWS. Retrieved March 18, 2026, from https://doe.state.wy.us/lmi/projections/2025/WY_ST_Projections_2024-2026.htm
 Hire Wyo
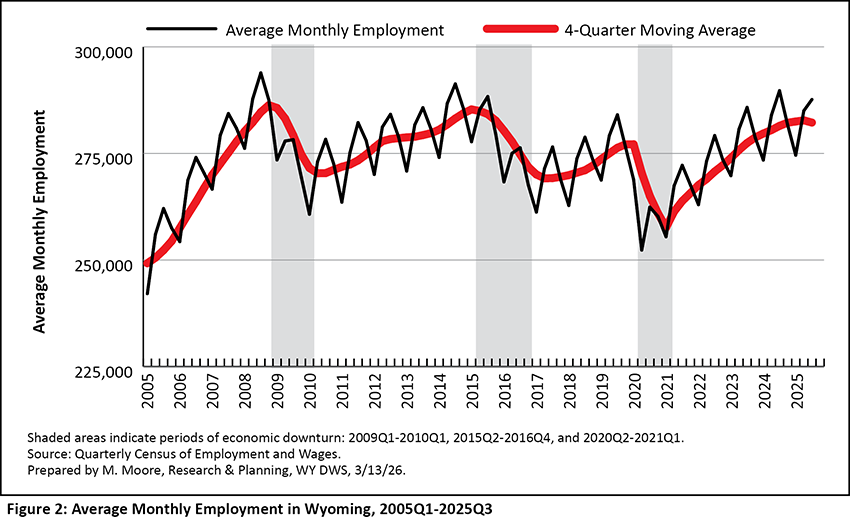