Wyoming Long-Term Industry and Occupational Employment Projections, 2022-2032
Click here to download Microsoft Excel file.
Click here to download the full publication (PDF).
by: Laura Yetter, Senior Economist
Published July 2024.
Wyoming is projected to add approximately 35,000 new jobs over the next 10 years, according to the newest long-term industry and occupational employment projections from the Research & Planning (R&P) section of the Wyoming Department of Workforce Services. This marks an increase of approximately 12% from 2022 to 2032. On average, Wyoming is projected to add more than 3,000 jobs each year during that 10-year period.
R&P publishes long-term industry and occupational employment projections for Wyoming every year. Long-term projections of Wyoming’s sub-state regions are published during the odd years, while the entire state projections are published during even years.
Projections are based on historic trends of how employment levels respond to market conditions such as oil & natural gas prices, building permits, mortgage rates, and coal production. Projections cannot account for certain factors, such as extreme weather patterns, large-scale government investments, and economic downturns. For example, projections run prior to 2020 could not have accounted for the COVID-19 pandemic.
The complete 2022-2032 long-term projections are available at https://doe.state.wy.us/LMI/projections.htm, along with prior projections, articles, and more.
Industry Projections
Industries are defined by the North American Industry Classification System (NAICS). The long-term industry projections for 2022-2032 were prepared at the NAICS three-digit subsector level, and the estimates were then rolled up to the two-digit sector level (click here for the full industry projections table).
As an example, projections for Wyoming’s construction sector were developed for three subsectors: construction of buildings (NAICS 236), heavy & civil engineering construction (NAICS 237), and specialty trade contractors (NAICS 237). These estimates then were rolled up to produce projections for the sector of construction (NAICS 23). Overall, construction is projected to grow from 21,237 in 2022 to 25,205 in 2032 (3,968 jobs, or 18.7%). Employment is projected to increase substantially for all three subsectors.
Overall, long-term industry projections show that Wyoming’s employment is projected to grow from 274,118 in 2022 to 307,365 in 2032, an increase of 33,247 jobs, or 12.1%.
Projections are displayed at the two-digit sector level in Table 1. Accommodation & food services has the greatest projected job growth of 5,353 new jobs, or 16.0%. Other industries with substantial projected growth include health care & social assistance (4,621, or 13.7%), construction (3,968, or 18.7%), and transportation & warehousing (2,668, or 21.0%). Wyoming’s mining sector is projected to add 317 jobs (1.9%), as employment growth in mining slowed in recent quarters. The only industries projected to lose jobs are information (-40, or -1.3%) and utilities (-8, or -0.3%).
Employment in government is projected to increase from 29,711 to 30,809 (1,098, or 3.7%). Local government (excluding education & hospitals) is projected to see the greatest growth of 828 new jobs, or 5.5%.
Occupational Projections
Staffing patterns from the Occupational Employment and Wage Statistics (OEWS) program were used for occupational projections. These staffing patterns are prepared in partnership with the Bureau of Labor Statistics (BLS) and are updated twice a year. This survey collects wage and salary information for all full- and part-time Wyoming workers in nonfarm industries, subsequently producing occupational employment estimates by metropolitan, non-metropolitan area, industry, and ownership (Hauf, 2022). These estimates are then combined with the industry projections in the Projections Suite software program to develop occupational projections.
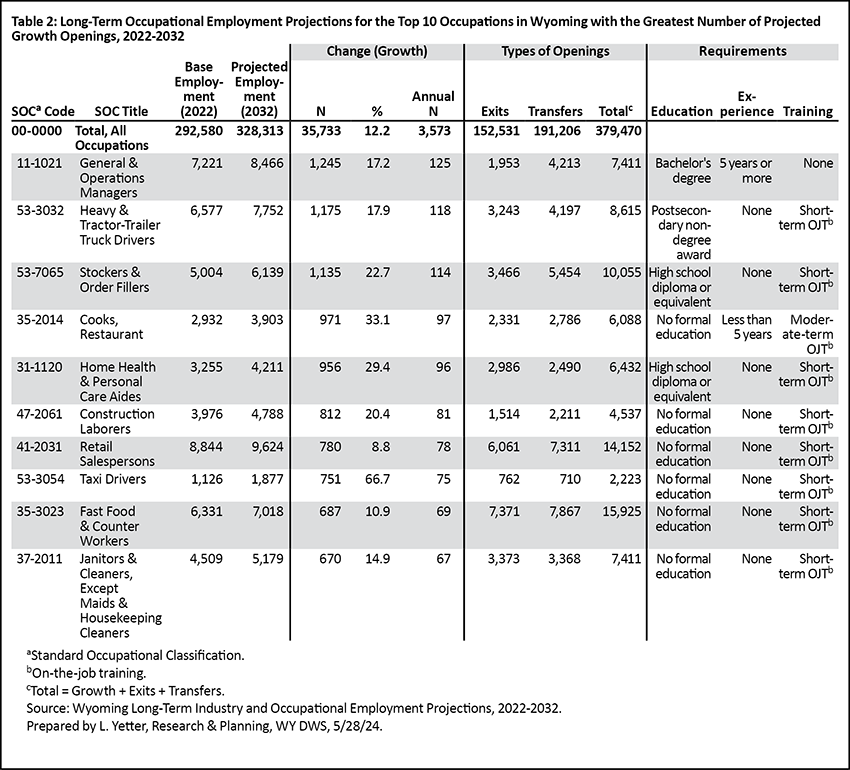
In addition to projected growth openings, occupational projections also include openings due to transfers (persons changing occupations) and exits (persons leaving the workforce; see Table 2). Total openings refers to the sum of growth, transfers, and exits (BLS, 2023). Annual growth openings were calculated by dividing the projected growth by 10. Occupational projections also include the typical requirements to enter the occupation: education, experience, and training.
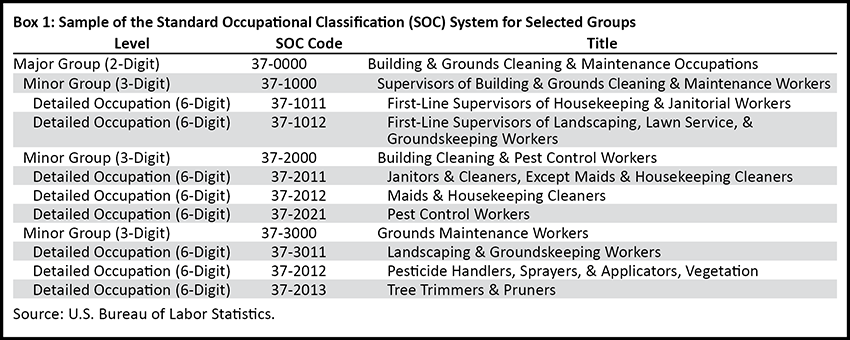
Occupations are assigned using the Standard Occupational Classification (SOC) system. Occupational projections are prepared at the major group (two-digit), minor group (three-digit), and detailed occupation (six-digit) levels. For example, Box 1 shows the SOC structure for building & grounds cleaning & maintenance occupations, which has the major group (two-digit) code of 37-0000. Within this major group are three minor groups (three-digit), one of which is building cleaning & pest control workers (SOC 37-2000). Within that minor group are several detailed occupations, including maids & housekeeping cleaners (SOC 37-2012) and pest control workers (SOC 37-2021).
Table 2 shows the top 10 occupations with the greatest number of projected growth openings from 2022 to 2032. General & operations managers are projected to see the greatest growth, with 1,245 new jobs, or 17.2% growth. This is an occupation that typically requires a bachelor’s degree and five years or more of experience. Other occupations with strong projected job growth include heavy & tractor-trailer truck drivers (1,175, or 17.9%), stockers & order fillers (1,135, or 22.7%), and cooks, restaurant (971, or 33.1%).
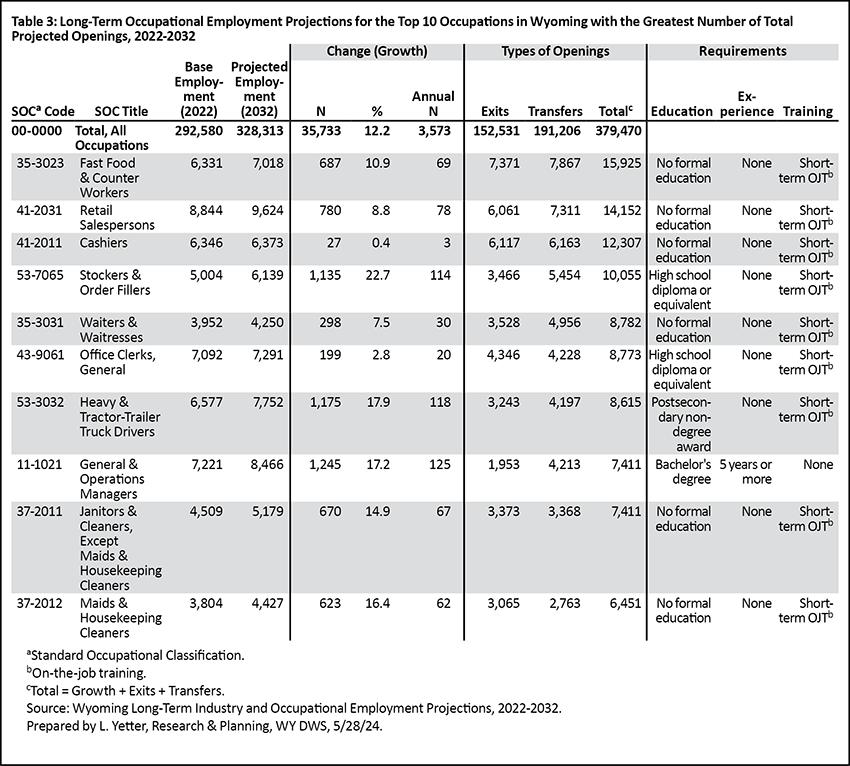
In contrast, Table 3 shows the 10 occupations with the greatest total projected openings from 2022 to 2032. As previously mentioned, total openings are the sum of growth, exits, and transfers. Many of the top occupations in Table 3 are occupations with substantial growth openings in exits and transfers, indicating high turnover rates; these include fast food & counter workers (15,925 total openings), retail salespersons (14,152), cashiers (12,307), stockers & order fillers (10,055), waiters & waitresses (8,782), office clerks (8,773), and heavy & tractor-trailer truck drivers (8,615). The majority of the occupations in Table 3 require no formal education, or a high school diploma or equivalent.
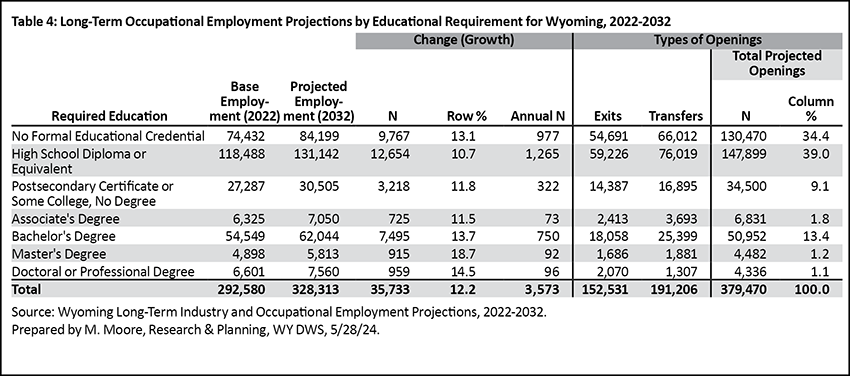
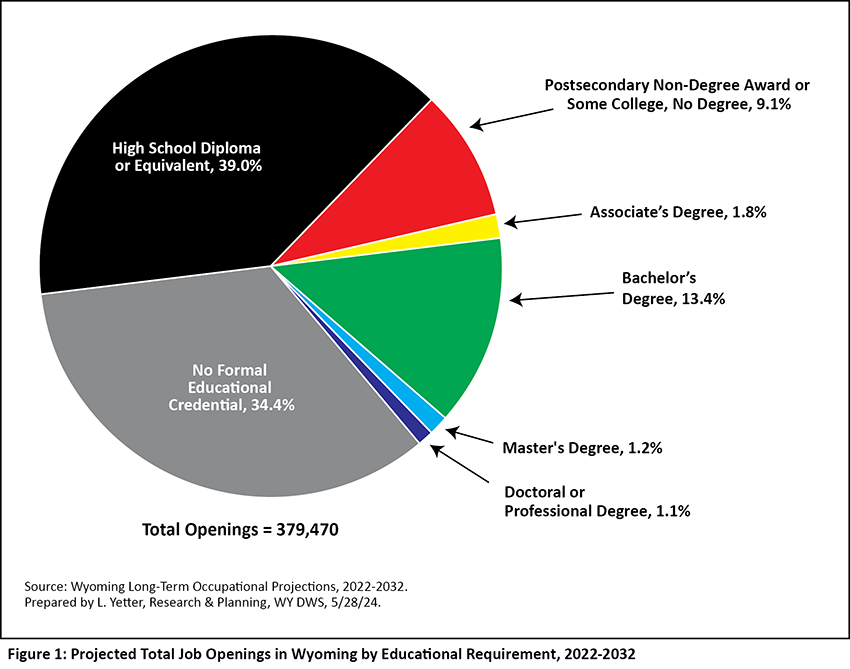
As shown in Table 4 and Figure 1, the majority of the state’s 379,470 total openings are projected to be in occupations requiring a high school diploma or equivalent (39.0% of all openings) or no formal educational credential (34.4%). In other words, nearly three of every four (73.4%) total job openings will be in occupations that require no education beyond high school. Occupations requiring a bachelor’s degree account for 13.4% of total projected openings, and occupations requiring a postsecondary non-degree award or some college, no degree make up 9.1%. The remaining education levels are associate's degree (1.8%), master's degree (1.2%), and doctoral or professional degree (1.1%).
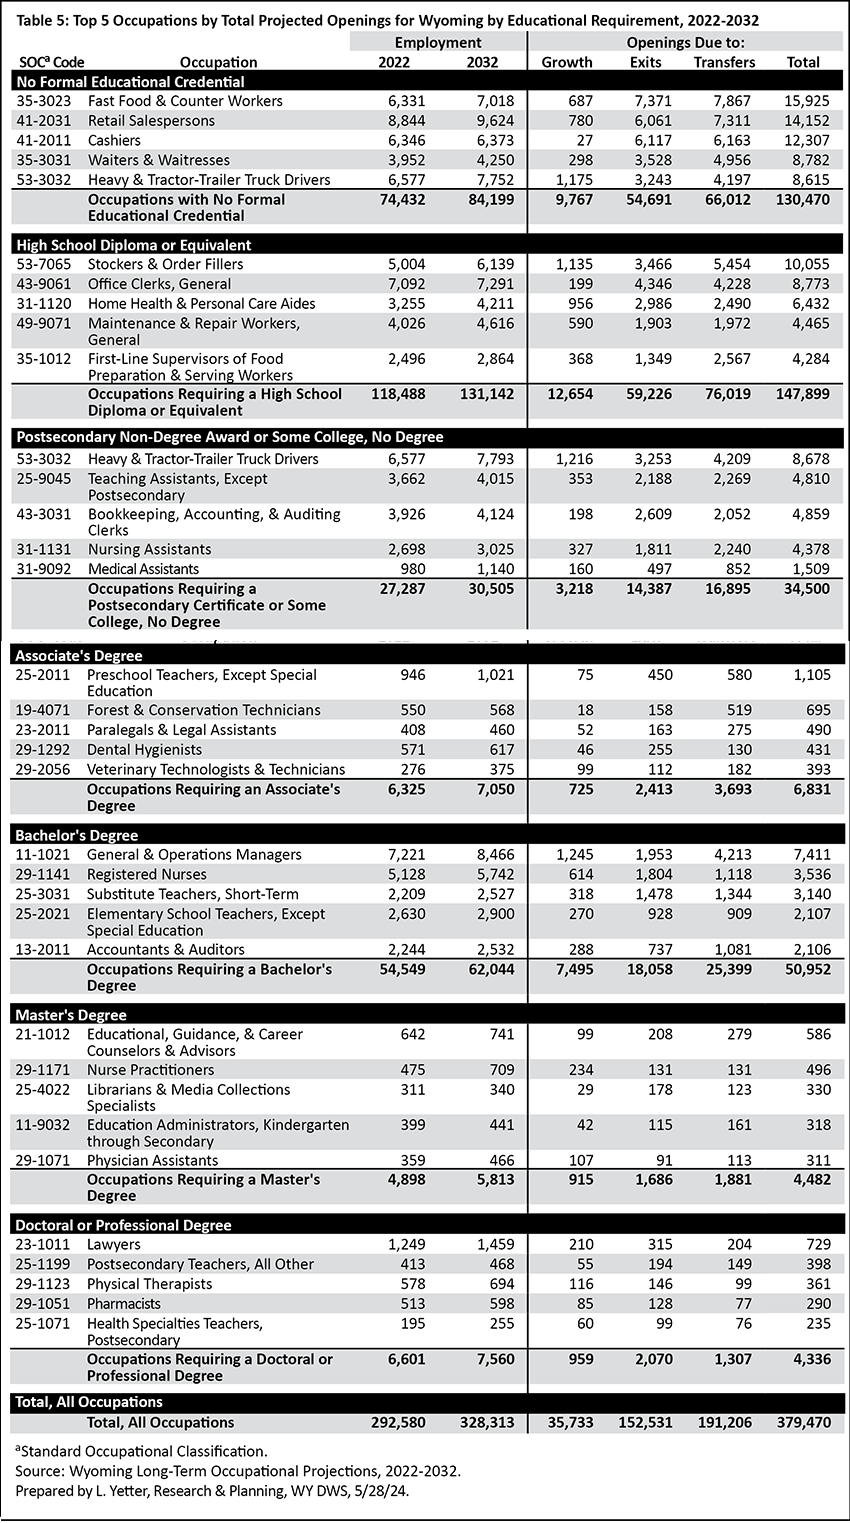
Table 5 shows the top five occupations with the greatest number of total projected job openings for each educational requirement. Occupations with no formal educational requirement are projected to have 130,470 total openings from 2022 to 2032. The occupations with the greatest number of total openings in this group are fast food & counter workers (15,925), retail salespersons (14,152), and cashiers (12,307).
Occupations requiring a high school diploma or equivalent account for the largest proportion of total openings (39.0%, or more than one-third). The greatest projected openings can be seen in occupations such as stockers & order filers (10,055), office clerks, general (8,773), and home health & personal care aides (6,432).
Occupations requiring a post-secondary non-degree award or some college, no degree, make up 9.1% of total projected openings. Of the 34,500 projected openings in this group, approximately one in four (8,678) are heavy & tractor-trailer truck drivers. Other occupations requiring a post-secondary certificate or some college that have relatively large numbers of total projected openings include teaching assistants, except postsecondary (4,810); bookkeeping, accounting, & auditing clerks (4,859); and nursing assistants (4,378).
The occupations requiring an associate's degree account for 1.8% of total projected openings. The occupations with the greatest number of projected openings are preschool teachers, except special education (1,105); forest & conservation technicians (695); and paralegals & legal assistants (490).
Occupations requiring a bachelor's degree make up the greatest proportion of all occupations that require some post-secondary education, and account for 13.4% of all projected openings. General & operations managers show the greatest number of projected openings (7,411), followed by registered nurses (3,536), short-term substitute teachers (3,140), and elementary school teachers, except special education (2,107).
Occupations requiring a master's degree and those requiring a doctoral or professional degree represent the smallest proportion of total openings for all educational groups (1.2% and 1.1%, respectively). For those jobs requiring a master’s degree, the greatest total openings are projected for educational, guidance, school, & vocational counselors (586); nurse practitioners (496); librarians & media collections specialists (330); and education administrators, kindergarten through secondary (318).
Among occupations requiring a doctoral or professional degree, the greatest total projected openings are in lawyers (729); postsecondary teachers, all other (398); physical therapists (361), and pharmacists (290).
Conclusion
Wyoming is projected to add approximately 35,000 new jobs from 2022 to 2032. However, job openings due to growth represent just a fraction of the state’s total openings (379,470), which includes openings due to individuals leaving the workforce (exits) or changing jobs (transfers).
Current and historical industry and occupational projections for Wyoming are available online at https://doe.state.wy.us/LMI/projections.htm.
References
Hauf, D. (2022, March). Occupations with the highest and lowest wages for May 2020. Wyoming Labor Force Trends, 59(3). Research & Planning, WY DWS. Retrieved July 9, 2024, from https://doe.state.wy.us/LMI/trends/2022_03.pdf
U.S. Bureau of Labor Statistics. (2023, September 6). Employment projections data definitions. Retrieved July 9, 2024, from https://www.bls.gov/emp/documentation/definitions.htm
 Hire Wyo
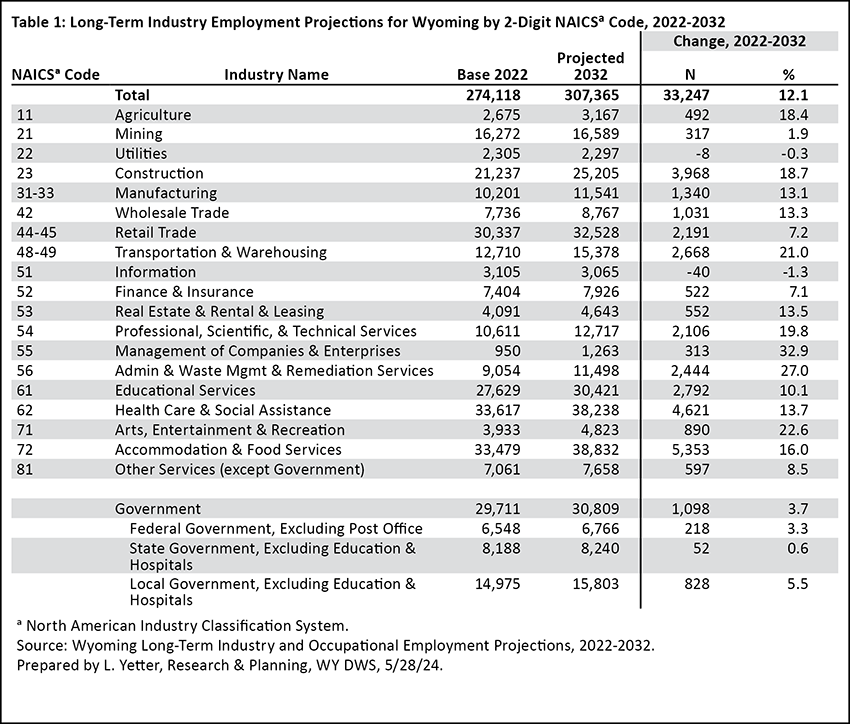