Wyoming QCEW Summary Statistics by County of Employment, 2001-2025
Washakie County, 2025Q3
Average Monthly Employment: 3,638
Total Wages: $47,485,770
Average Weekly Wage: $1,004
Published April 2026.
| Table: Over-the-Year Change in Average Monthly Employment, Total Wages, and Average Weekly Wage in Washakie County, WY, 2001Q1-2025Q3 |
| Published April 2026. |
|
|
|
|
|
|
|
|
|
|
|
|
|
Average Monthly Employment |
Total Wages |
Average Weekly Wage |
| Year/Quarter |
N |
% Change |
$ |
% Change |
$ |
% Change |
| 2001Q1 |
3,497 |
|
$21,449,195 |
|
$472 |
|
| 2001Q2 |
3,554 |
|
$22,073,656 |
|
$478 |
|
| 2001Q3 |
3,456 |
|
$21,928,565 |
|
$488 |
|
| 2001Q4 |
3,535 |
|
$23,813,340 |
|
$518 |
|
| 2002Q1 |
3,385 |
-3.2 |
$20,918,231 |
-2.5 |
$475 |
0.7 |
| 2002Q2 |
3,543 |
-0.3 |
$22,476,535 |
1.8 |
$488 |
2.1 |
| 2002Q3 |
3,562 |
3.1 |
$22,762,059 |
3.8 |
$492 |
0.7 |
| 2002Q4 |
3,606 |
2.0 |
$24,733,209 |
3.9 |
$528 |
1.8 |
| 2003Q1 |
3,477 |
2.7 |
$21,583,105 |
3.2 |
$477 |
0.4 |
| 2003Q2 |
3,666 |
3.5 |
$23,467,779 |
4.4 |
$492 |
0.9 |
| 2003Q3 |
3,702 |
3.9 |
$23,880,725 |
4.9 |
$496 |
1.0 |
| 2003Q4 |
3,704 |
2.7 |
$25,622,182 |
3.6 |
$532 |
0.9 |
| 2004Q1 |
3,556 |
2.3 |
$23,761,098 |
10.1 |
$514 |
7.7 |
| 2004Q2 |
3,725 |
1.6 |
$25,322,397 |
7.9 |
$523 |
6.2 |
| 2004Q3 |
3,741 |
1.1 |
$26,985,652 |
13.0 |
$555 |
11.8 |
| 2004Q4 |
3,792 |
2.4 |
$28,738,503 |
12.2 |
$583 |
9.6 |
| 2005Q1 |
3,655 |
2.8 |
$25,640,618 |
7.9 |
$540 |
5.0 |
| 2005Q2 |
3,831 |
2.8 |
$27,581,111 |
8.9 |
$554 |
5.9 |
| 2005Q3 |
3,888 |
3.9 |
$28,439,610 |
5.4 |
$563 |
1.4 |
| 2005Q4 |
3,933 |
3.7 |
$29,888,001 |
4.0 |
$585 |
0.3 |
| 2006Q1 |
3,703 |
1.3 |
$27,796,296 |
8.4 |
$577 |
7.0 |
| 2006Q2 |
3,922 |
2.4 |
$29,412,083 |
6.6 |
$577 |
4.1 |
| 2006Q3 |
3,918 |
0.8 |
$30,199,827 |
6.2 |
$593 |
5.4 |
| 2006Q4 |
3,889 |
-1.1 |
$32,145,057 |
7.6 |
$636 |
8.8 |
| 2007Q1 |
3,775 |
1.9 |
$30,077,995 |
8.2 |
$613 |
6.1 |
| 2007Q2 |
3,974 |
1.3 |
$33,870,546 |
15.2 |
$656 |
13.7 |
| 2007Q3 |
4,019 |
2.6 |
$32,851,078 |
8.8 |
$629 |
6.0 |
| 2007Q4 |
4,094 |
5.3 |
$34,923,661 |
8.6 |
$656 |
3.2 |
| 2008Q1 |
3,825 |
1.3 |
$31,829,518 |
5.8 |
$640 |
4.4 |
| 2008Q2 |
4,115 |
3.6 |
$33,465,477 |
-1.2 |
$626 |
-4.6 |
| 2008Q3 |
4,169 |
3.7 |
$35,131,484 |
6.9 |
$648 |
3.1 |
| 2008Q4 |
4,192 |
2.4 |
$38,525,851 |
10.3 |
$707 |
7.7 |
| 2009Q1 |
3,873 |
1.2 |
$32,250,881 |
1.3 |
$641 |
0.1 |
| 2009Q2 |
4,043 |
-1.7 |
$34,901,525 |
4.3 |
$664 |
6.1 |
| 2009Q3 |
4,008 |
-3.9 |
$33,581,530 |
-4.4 |
$644 |
-0.6 |
| 2009Q4 |
4,000 |
-4.6 |
$36,476,846 |
-5.3 |
$702 |
-0.8 |
| 2010Q1 |
3,775 |
-2.5 |
$31,050,754 |
-3.7 |
$633 |
-1.2 |
| 2010Q2 |
4,001 |
-1.0 |
$35,203,581 |
0.9 |
$677 |
1.9 |
| 2010Q3 |
4,007 |
0.0 |
$35,594,823 |
6.0 |
$683 |
6.0 |
| 2010Q4 |
4,011 |
0.3 |
$37,809,990 |
3.7 |
$725 |
3.4 |
| 2011Q1 |
3,801 |
0.7 |
$32,943,728 |
6.1 |
$667 |
5.4 |
| 2011Q2 |
4,035 |
0.9 |
$36,993,270 |
5.1 |
$705 |
4.2 |
| 2011Q3 |
3,998 |
-0.2 |
$37,850,736 |
6.3 |
$728 |
6.6 |
| 2011Q4 |
3,995 |
-0.4 |
$38,054,673 |
0.6 |
$733 |
1.1 |
| 2012Q1 |
3,705 |
-2.5 |
$33,899,032 |
2.9 |
$704 |
5.6 |
| 2012Q2 |
3,966 |
-1.7 |
$39,031,038 |
5.5 |
$757 |
7.3 |
| 2012Q3 |
3,974 |
-0.6 |
$37,409,608 |
-1.2 |
$724 |
-0.6 |
| 2012Q4 |
3,970 |
-0.6 |
$39,207,614 |
3.0 |
$760 |
3.7 |
| 2013Q1 |
3,674 |
-0.8 |
$33,435,354 |
-1.4 |
$700 |
-0.5 |
| 2013Q2 |
3,839 |
-3.2 |
$38,337,987 |
-1.8 |
$768 |
1.5 |
| 2013Q3 |
3,891 |
-2.1 |
$36,896,117 |
-1.4 |
$729 |
0.7 |
| 2013Q4 |
3,839 |
-3.3 |
$38,709,333 |
-1.3 |
$776 |
2.1 |
| 2014Q1 |
3,636 |
-1.0 |
$34,906,113 |
4.4 |
$738 |
5.5 |
| 2014Q2 |
3,793 |
-1.2 |
$38,570,368 |
0.6 |
$782 |
1.8 |
| 2014Q3 |
3,812 |
-2.0 |
$37,597,425 |
1.9 |
$759 |
4.0 |
| 2014Q4 |
3,890 |
1.3 |
$40,706,125 |
5.2 |
$805 |
3.8 |
| 2015Q1 |
3,685 |
1.4 |
$36,402,384 |
4.3 |
$760 |
2.9 |
| 2015Q2 |
3,870 |
2.0 |
$39,813,711 |
3.2 |
$791 |
1.2 |
| 2015Q3 |
3,846 |
0.9 |
$37,627,508 |
0.1 |
$753 |
-0.8 |
| 2015Q4 |
3,793 |
-2.5 |
$39,037,026 |
-4.1 |
$792 |
-1.7 |
| 2016Q1 |
3,588 |
-2.6 |
$34,690,104 |
-4.7 |
$744 |
-2.1 |
| 2016Q2 |
3,702 |
-4.3 |
$38,475,974 |
-3.4 |
$799 |
1.0 |
| 2016Q3 |
3,708 |
-3.6 |
$37,395,225 |
-0.6 |
$776 |
3.1 |
| 2016Q4 |
3,679 |
-3.0 |
$36,936,899 |
-5.4 |
$772 |
-2.4 |
| 2017Q1 |
3,532 |
-1.6 |
$34,959,769 |
0.8 |
$761 |
2.4 |
| 2017Q2 |
3,636 |
-1.8 |
$35,556,412 |
-7.6 |
$752 |
-5.9 |
| 2017Q3 |
3,638 |
-1.9 |
$36,963,998 |
-1.2 |
$782 |
0.8 |
| 2017Q4 |
3,710 |
0.8 |
$40,307,652 |
9.1 |
$836 |
8.2 |
| 2018Q1 |
3,548 |
0.5 |
$35,436,163 |
1.4 |
$768 |
0.9 |
| 2018Q2 |
3,642 |
0.2 |
$36,540,435 |
2.8 |
$772 |
2.6 |
| 2018Q3 |
3,652 |
0.4 |
$37,839,562 |
2.4 |
$797 |
2.0 |
| 2018Q4 |
3,628 |
-2.2 |
$37,922,626 |
-5.9 |
$804 |
-3.8 |
| 2019Q1 |
3,456 |
-2.6 |
$36,294,504 |
2.4 |
$808 |
5.1 |
| 2019Q2 |
3,565 |
-2.1 |
$36,412,717 |
-0.3 |
$786 |
1.8 |
| 2019Q3 |
3,518 |
-3.7 |
$37,500,462 |
-0.9 |
$820 |
2.9 |
| 2019Q4 |
3,532 |
-2.6 |
$39,576,655 |
4.4 |
$862 |
7.2 |
| 2020Q1 |
3,459 |
0.1 |
$37,640,109 |
3.7 |
$837 |
3.6 |
| 2020Q2 |
3,390 |
-4.9 |
$37,124,580 |
2.0 |
$842 |
7.2 |
| 2020Q3 |
3,467 |
-1.4 |
$37,828,334 |
0.9 |
$839 |
2.3 |
| 2020Q4 |
3,552 |
0.6 |
$41,816,961 |
5.7 |
$906 |
5.1 |
| 2021Q1 |
3,435 |
-0.7 |
$37,292,052 |
-0.9 |
$835 |
-0.2 |
| 2021Q2 |
3,604 |
6.3 |
$40,454,338 |
9.0 |
$863 |
2.5 |
| 2021Q3 |
3,592 |
3.6 |
$41,269,033 |
9.1 |
$884 |
5.3 |
| 2021Q4 |
3,567 |
0.4 |
$44,175,441 |
5.6 |
$953 |
5.2 |
| 2022Q1 |
3,384 |
-1.5 |
$38,800,128 |
4.0 |
$882 |
5.6 |
| 2022Q2 |
3,522 |
-2.3 |
$41,552,081 |
2.7 |
$908 |
5.1 |
| 2022Q3 |
3,565 |
-0.7 |
$42,649,805 |
3.3 |
$920 |
4.1 |
| 2022Q4 |
3,573 |
0.2 |
$44,611,219 |
1.0 |
$961 |
0.8 |
| 2023Q1 |
3,498 |
3.4 |
$40,833,403 |
5.2 |
$898 |
1.8 |
| 2023Q2 |
3,609 |
2.5 |
$43,060,088 |
3.6 |
$918 |
1.1 |
| 2023Q3 |
3,640 |
2.1 |
$43,779,072 |
2.6 |
$925 |
0.5 |
| 2023Q4 |
3,660 |
2.4 |
$47,073,868 |
5.5 |
$989 |
3.0 |
| 2024Q1 |
3,498 |
0.0 |
$43,119,815 |
5.6 |
$948 |
5.6 |
| 2024Q2 |
3,561 |
-0.9 |
$45,368,237 |
0.3 |
$980 |
1.2 |
| 2024Q3 |
3,628 |
-0.3 |
$47,549,607 |
8.6 |
$1,008 |
9.0 |
| 2024Q4 |
3,599 |
-1.7 |
$48,037,743 |
2.0 |
$1,027 |
3.8 |
| 2025Q1 |
3,482 |
-0.4 |
$43,818,425 |
1.6 |
$968 |
2.1 |
| 2025Q2 |
3,600 |
1.1 |
$46,189,993 |
1.8 |
$987 |
0.7 |
| 2025Q3b |
3,638 |
0.3 |
$47,485,770 |
-0.1 |
$1,004 |
-0.4 |
|
|
|
|
|
|
|
|
|
|
|
|
|
|
| aNorth American Industry Classification System. |
|
|
|
|
| bPreliminary. |
|
|
|
|
|
|
| Source: Quarterly Census of Employment and Wages. |
|
|
|
|
| Prepared by M. Moore, Research & Planning, WY DWS, 4/3/26. |
|
|
|
|
Figure: Average Monthly Employment in Washakie County, 2001Q1-2025Q3
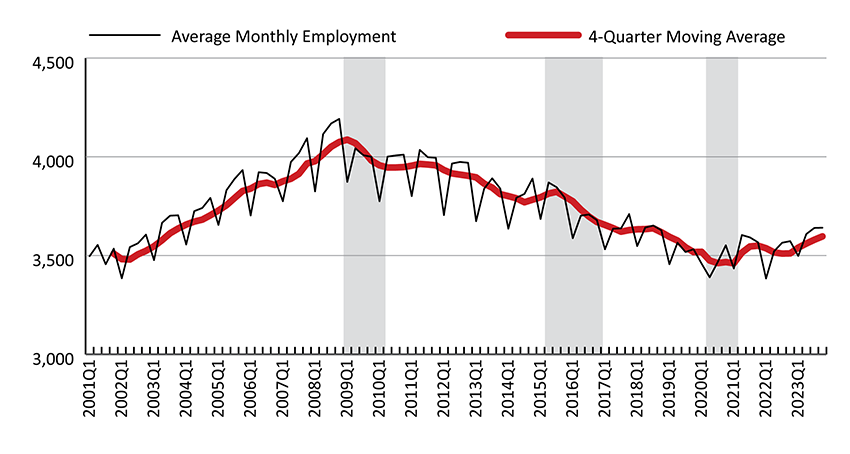
Figure: Over-the-Year Percent Change in Average Monthly Employment and Total Wages in Washakie County, 2002Q1-2025Q3

Shaded areas indicate periods of economic downturn: 2009Q1-2010Q1, 2015Q2-2016Q4, and 2020Q2-2021Q1.
Source: Quarterly Census of Employment and Wages.
Prepared by M. Moore, Research & Planning, WY DWS, 4/3/26.
 Hire Wyo