Wyoming QCEW Summary Statistics by County of Employment, 2001-2025
Uinta County, 2025Q3
Average Monthly Employment: 8,299
Total Wages: $105,545,766
Average Weekly Wage: $978
Published April 2026.
| Table: Over-the-Year Change in Average Monthly Employment, Total Wages, and Average Weekly Wage in Uinta County, WY, 2001Q1-2025Q3 |
| Published April 2026. |
|
|
|
|
|
|
|
|
|
|
|
|
|
Average Monthly Employment |
Total Wages |
Average Weekly Wage |
| Year/Quarter |
N |
% Change |
$ |
% Change |
$ |
% Change |
| 2001Q1 |
7,881 |
|
$52,744,978 |
|
$515 |
|
| 2001Q2 |
8,416 |
|
$52,966,604 |
|
$484 |
|
| 2001Q3 |
8,570 |
|
$55,996,673 |
|
$503 |
|
| 2001Q4 |
8,626 |
|
$58,632,415 |
|
$523 |
|
| 2002Q1 |
8,390 |
6.5 |
$61,268,198 |
16.2 |
$562 |
9.1 |
| 2002Q2 |
8,767 |
4.2 |
$56,243,598 |
6.2 |
$494 |
1.9 |
| 2002Q3 |
9,137 |
6.6 |
$61,916,084 |
10.6 |
$521 |
3.7 |
| 2002Q4 |
9,014 |
4.5 |
$66,929,611 |
14.2 |
$571 |
9.2 |
| 2003Q1 |
8,190 |
-2.4 |
$59,325,288 |
-3.2 |
$557 |
-0.8 |
| 2003Q2 |
8,458 |
-3.5 |
$56,231,458 |
0.0 |
$511 |
3.6 |
| 2003Q3 |
9,049 |
-1.0 |
$63,829,916 |
3.1 |
$543 |
4.1 |
| 2003Q4 |
9,084 |
0.8 |
$69,537,288 |
3.9 |
$589 |
3.1 |
| 2004Q1 |
8,396 |
2.5 |
$63,680,972 |
7.3 |
$583 |
4.7 |
| 2004Q2 |
8,666 |
2.5 |
$60,472,978 |
7.5 |
$537 |
5.0 |
| 2004Q3 |
8,725 |
-3.6 |
$61,465,973 |
-3.7 |
$542 |
-0.1 |
| 2004Q4 |
8,735 |
-3.8 |
$66,141,410 |
-4.9 |
$582 |
-1.1 |
| 2005Q1 |
8,268 |
-1.5 |
$63,421,953 |
-0.4 |
$590 |
1.1 |
| 2005Q2 |
8,676 |
0.1 |
$64,987,088 |
7.5 |
$576 |
7.3 |
| 2005Q3 |
9,295 |
6.5 |
$73,022,286 |
18.8 |
$604 |
11.5 |
| 2005Q4 |
9,199 |
5.3 |
$73,712,717 |
11.4 |
$616 |
5.8 |
| 2006Q1 |
9,009 |
9.0 |
$76,435,740 |
20.5 |
$653 |
10.6 |
| 2006Q2 |
9,289 |
7.1 |
$75,023,838 |
15.4 |
$621 |
7.8 |
| 2006Q3 |
9,491 |
2.1 |
$77,516,614 |
6.2 |
$628 |
4.0 |
| 2006Q4 |
9,750 |
6.0 |
$87,425,076 |
18.6 |
$690 |
11.9 |
| 2007Q1 |
9,391 |
4.2 |
$88,144,080 |
15.3 |
$722 |
10.6 |
| 2007Q2 |
9,716 |
4.6 |
$87,308,096 |
16.4 |
$691 |
11.3 |
| 2007Q3 |
9,885 |
4.2 |
$89,238,998 |
15.1 |
$694 |
10.5 |
| 2007Q4 |
9,864 |
1.2 |
$99,246,959 |
13.5 |
$774 |
12.2 |
| 2008Q1 |
9,623 |
2.5 |
$95,050,390 |
7.8 |
$760 |
5.2 |
| 2008Q2 |
10,181 |
4.8 |
$97,356,504 |
11.5 |
$736 |
6.4 |
| 2008Q3 |
10,676 |
8.0 |
$102,285,057 |
14.6 |
$737 |
6.1 |
| 2008Q4 |
10,287 |
4.3 |
$108,838,145 |
9.7 |
$814 |
5.2 |
| 2009Q1 |
9,633 |
0.1 |
$99,962,511 |
5.2 |
$798 |
5.1 |
| 2009Q2 |
9,627 |
-5.4 |
$92,810,780 |
-4.7 |
$742 |
0.8 |
| 2009Q3 |
9,674 |
-9.4 |
$89,850,757 |
-12.2 |
$714 |
-3.1 |
| 2009Q4 |
9,378 |
-8.8 |
$98,050,744 |
-9.9 |
$804 |
-1.2 |
| 2010Q1 |
8,800 |
-8.7 |
$90,288,924 |
-9.7 |
$789 |
-1.1 |
| 2010Q2 |
9,154 |
-4.9 |
$91,914,613 |
-1.0 |
$772 |
4.2 |
| 2010Q3 |
9,688 |
0.1 |
$100,667,849 |
12.0 |
$799 |
11.9 |
| 2010Q4 |
9,788 |
4.4 |
$116,441,618 |
18.8 |
$915 |
13.8 |
| 2011Q1 |
8,733 |
-0.8 |
$87,884,942 |
-2.7 |
$774 |
-1.9 |
| 2011Q2 |
8,934 |
-2.4 |
$87,029,056 |
-5.3 |
$749 |
-3.0 |
| 2011Q3 |
9,017 |
-6.9 |
$91,668,368 |
-8.9 |
$782 |
-2.2 |
| 2011Q4 |
9,254 |
-5.4 |
$95,466,604 |
-18.0 |
$794 |
-13.3 |
| 2012Q1 |
9,018 |
3.3 |
$94,838,818 |
7.9 |
$809 |
4.5 |
| 2012Q2 |
9,286 |
3.9 |
$92,319,367 |
6.1 |
$765 |
2.1 |
| 2012Q3 |
9,084 |
0.7 |
$90,816,710 |
-0.9 |
$769 |
-1.7 |
| 2012Q4 |
9,107 |
-1.6 |
$96,625,669 |
1.2 |
$816 |
2.9 |
| 2013Q1 |
8,747 |
-3.0 |
$90,271,386 |
-4.8 |
$794 |
-1.9 |
| 2013Q2 |
8,891 |
-4.3 |
$88,443,847 |
-4.2 |
$765 |
0.1 |
| 2013Q3 |
8,900 |
-2.0 |
$89,381,693 |
-1.6 |
$773 |
0.5 |
| 2013Q4 |
8,862 |
-2.7 |
$124,434,132 |
28.8 |
$1,080 |
32.3 |
| 2014Q1 |
8,618 |
-1.5 |
$89,224,577 |
-1.2 |
$796 |
0.3 |
| 2014Q2 |
8,915 |
0.3 |
$91,541,798 |
3.5 |
$790 |
3.2 |
| 2014Q3 |
9,068 |
1.9 |
$92,083,476 |
3.0 |
$781 |
1.1 |
| 2014Q4 |
8,996 |
1.5 |
$100,937,684 |
-18.9 |
$863 |
-20.1 |
| 2015Q1 |
8,794 |
2.0 |
$91,580,062 |
2.6 |
$801 |
0.6 |
| 2015Q2 |
8,809 |
-1.2 |
$88,371,935 |
-3.5 |
$772 |
-2.3 |
| 2015Q3 |
8,703 |
-4.0 |
$88,080,236 |
-4.3 |
$779 |
-0.3 |
| 2015Q4 |
8,574 |
-4.7 |
$91,172,157 |
-9.7 |
$818 |
-5.2 |
| 2016Q1 |
8,249 |
-6.2 |
$80,309,876 |
-12.3 |
$749 |
-6.5 |
| 2016Q2 |
8,411 |
-4.5 |
$81,872,727 |
-7.4 |
$749 |
-3.0 |
| 2016Q3 |
8,285 |
-4.8 |
$82,922,425 |
-5.9 |
$770 |
-1.1 |
| 2016Q4 |
8,298 |
-3.2 |
$82,983,617 |
-9.0 |
$769 |
-6.0 |
| 2017Q1 |
7,992 |
-3.1 |
$78,727,703 |
-2.0 |
$758 |
1.2 |
| 2017Q2 |
8,258 |
-1.8 |
$81,691,607 |
-0.2 |
$761 |
1.6 |
| 2017Q3 |
8,285 |
0.0 |
$79,957,013 |
-3.6 |
$742 |
-3.6 |
| 2017Q4 |
8,152 |
-1.8 |
$85,441,227 |
3.0 |
$806 |
4.8 |
| 2018Q1 |
7,978 |
-0.2 |
$80,424,311 |
2.2 |
$775 |
2.3 |
| 2018Q2 |
8,283 |
0.3 |
$83,113,045 |
1.7 |
$772 |
1.4 |
| 2018Q3 |
8,272 |
-0.2 |
$81,415,920 |
1.8 |
$757 |
2.0 |
| 2018Q4 |
8,340 |
2.3 |
$89,362,835 |
4.6 |
$824 |
2.2 |
| 2019Q1 |
8,133 |
1.9 |
$85,069,238 |
5.8 |
$805 |
3.8 |
| 2019Q2 |
8,405 |
1.5 |
$86,742,534 |
4.4 |
$794 |
2.8 |
| 2019Q3 |
8,324 |
0.6 |
$86,986,319 |
6.8 |
$804 |
6.2 |
| 2019Q4 |
8,305 |
-0.4 |
$89,676,740 |
0.4 |
$831 |
0.8 |
| 2020Q1 |
7,959 |
-2.1 |
$82,618,395 |
-2.9 |
$798 |
-0.8 |
| 2020Q2 |
7,563 |
-10.0 |
$82,009,446 |
-5.5 |
$834 |
5.1 |
| 2020Q3 |
7,896 |
-5.1 |
$80,840,449 |
-7.1 |
$788 |
-2.0 |
| 2020Q4 |
7,965 |
-4.1 |
$89,426,768 |
-0.3 |
$864 |
4.0 |
| 2021Q1 |
7,717 |
-3.0 |
$79,302,414 |
-4.0 |
$790 |
-1.0 |
| 2021Q2 |
8,034 |
6.2 |
$86,642,901 |
5.6 |
$830 |
-0.5 |
| 2021Q3 |
7,858 |
-0.5 |
$83,212,896 |
2.9 |
$815 |
3.4 |
| 2021Q4 |
7,891 |
-0.9 |
$93,978,069 |
5.1 |
$916 |
6.1 |
| 2022Q1 |
7,761 |
0.6 |
$84,786,032 |
6.9 |
$840 |
6.3 |
| 2022Q2 |
8,012 |
-0.3 |
$90,591,440 |
4.6 |
$870 |
4.8 |
| 2022Q3 |
8,197 |
4.3 |
$99,002,309 |
19.0 |
$929 |
14.0 |
| 2022Q4 |
8,372 |
6.1 |
$98,357,514 |
4.7 |
$904 |
-1.3 |
| 2023Q1 |
8,143 |
4.9 |
$97,408,425 |
14.9 |
$920 |
9.5 |
| 2023Q2 |
8,330 |
4.0 |
$99,664,654 |
10.0 |
$920 |
5.8 |
| 2023Q3 |
8,173 |
-0.3 |
$97,604,310 |
-1.4 |
$919 |
-1.1 |
| 2023Q4 |
8,257 |
-1.4 |
$103,249,557 |
5.0 |
$962 |
6.4 |
| 2024Q1 |
8,173 |
0.4 |
$97,604,310 |
0.2 |
$919 |
-0.2 |
| 2024Q2 |
8,285 |
-0.5 |
$100,012,584 |
0.3 |
$929 |
0.9 |
| 2024Q3 |
8,254 |
1.0 |
$101,504,756 |
4.0 |
$946 |
3.0 |
| 2024Q4 |
8,373 |
1.4 |
$104,853,942 |
1.6 |
$963 |
0.1 |
| 2025Q1 |
8,153 |
-0.2 |
$103,960,410 |
6.5 |
$981 |
6.8 |
| 2025Q2 |
8,410 |
1.5 |
$106,822,371 |
6.8 |
$977 |
5.2 |
| 2025Q3b |
8,299 |
0.5 |
$105,545,766 |
4.0 |
$978 |
3.4 |
|
|
|
|
|
|
|
|
|
|
|
|
|
|
| aNorth American Industry Classification System. |
|
|
|
|
| bPreliminary. |
|
|
|
|
|
|
| Source: Quarterly Census of Employment and Wages. |
|
|
|
|
| Prepared by M. Moore, Research & Planning, WY DWS, 4/3/26. |
|
|
|
|
Figure: Average Monthly Employment in Uinta County, 2001Q1-2025Q3
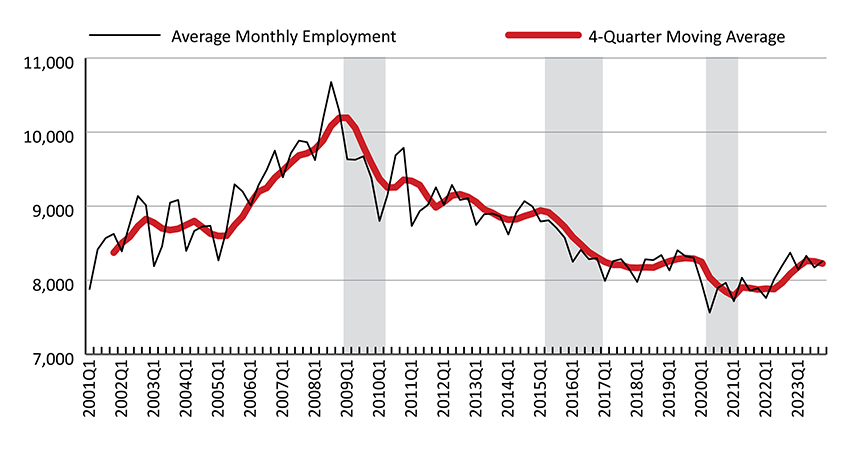
Figure: Over-the-Year Percent Change in Average Monthly Employment and Total Wages in Uinta County, 2002Q1-2025Q3

Shaded areas indicate periods of economic downturn: 2009Q1-2010Q1, 2015Q2-2016Q4, and 2020Q2-2021Q1.
Source: Quarterly Census of Employment and Wages.
Prepared by M. Moore, Research & Planning, WY DWS, 4/3/26.
 Hire Wyo