Wyoming QCEW Summary Statistics by County of Employment, 2001-2025
Sweetwater County, 2025Q3
Average Monthly Employment: 20,469
Total Wages: $348,636,387
Average Weekly Wage: $1,310
Published April 2026.
| Table: Over-the-Year Change in Average Monthly Employment, Total Wages, and Average Weekly Wage in Sweetwater County, WY, 2001Q1-2025Q3 |
| Published April 2026. |
|
|
|
|
|
|
|
|
|
|
|
|
|
Average Monthly Employment |
Total Wages |
Average Weekly Wage |
| Year/Quarter |
N |
% Change |
$ |
% Change |
$ |
% Change |
| 2001Q1 |
18,319 |
|
$161,517,002 |
|
$678 |
|
| 2001Q2 |
18,986 |
|
$168,337,700 |
|
$682 |
|
| 2001Q3 |
18,861 |
|
$165,002,428 |
|
$673 |
|
| 2001Q4 |
19,253 |
|
$178,464,609 |
|
$713 |
|
| 2002Q1 |
18,167 |
-0.8 |
$161,951,012 |
0.3 |
$686 |
1.1 |
| 2002Q2 |
18,543 |
-2.3 |
$171,705,426 |
2.0 |
$712 |
4.4 |
| 2002Q3 |
18,827 |
-0.2 |
$166,338,440 |
0.8 |
$680 |
1.0 |
| 2002Q4 |
18,748 |
-2.6 |
$175,203,144 |
-1.8 |
$719 |
0.8 |
| 2003Q1 |
18,581 |
2.3 |
$171,213,624 |
5.7 |
$709 |
3.4 |
| 2003Q2 |
19,530 |
5.3 |
$183,395,929 |
6.8 |
$722 |
1.4 |
| 2003Q3 |
19,769 |
5.0 |
$179,198,318 |
7.7 |
$697 |
2.6 |
| 2003Q4 |
19,907 |
6.2 |
$197,124,625 |
12.5 |
$762 |
6.0 |
| 2004Q1 |
19,487 |
4.9 |
$182,940,873 |
6.8 |
$722 |
1.9 |
| 2004Q2 |
20,441 |
4.7 |
$196,245,896 |
7.0 |
$739 |
2.2 |
| 2004Q3 |
20,752 |
5.0 |
$198,273,195 |
10.6 |
$735 |
5.4 |
| 2004Q4 |
21,078 |
5.9 |
$218,074,040 |
10.6 |
$796 |
4.5 |
| 2005Q1 |
20,841 |
6.9 |
$205,592,029 |
12.4 |
$759 |
5.1 |
| 2005Q2 |
22,029 |
7.8 |
$231,488,939 |
18.0 |
$808 |
9.5 |
| 2005Q3 |
22,086 |
6.4 |
$229,626,355 |
15.8 |
$800 |
8.8 |
| 2005Q4 |
22,441 |
6.5 |
$252,902,778 |
16.0 |
$867 |
8.9 |
| 2006Q1 |
22,449 |
7.7 |
$243,603,798 |
18.5 |
$835 |
10.0 |
| 2006Q2 |
24,185 |
9.8 |
$275,683,483 |
19.1 |
$877 |
8.5 |
| 2006Q3 |
24,422 |
10.6 |
$278,036,117 |
21.1 |
$876 |
9.5 |
| 2006Q4 |
24,503 |
9.2 |
$302,583,544 |
19.6 |
$950 |
9.6 |
| 2007Q1 |
24,117 |
7.4 |
$282,275,761 |
15.9 |
$900 |
7.9 |
| 2007Q2 |
25,076 |
3.7 |
$303,223,875 |
10.0 |
$930 |
6.1 |
| 2007Q3 |
24,791 |
1.5 |
$292,013,255 |
5.0 |
$906 |
3.5 |
| 2007Q4 |
25,044 |
2.2 |
$322,751,117 |
6.7 |
$991 |
4.4 |
| 2008Q1 |
25,065 |
3.9 |
$311,150,163 |
10.2 |
$955 |
6.1 |
| 2008Q2 |
25,411 |
1.3 |
$322,583,235 |
6.4 |
$976 |
5.0 |
| 2008Q3 |
25,918 |
4.5 |
$325,966,998 |
11.6 |
$967 |
6.8 |
| 2008Q4 |
26,036 |
4.0 |
$359,686,783 |
11.4 |
$1,063 |
7.2 |
| 2009Q1 |
24,841 |
-0.9 |
$306,568,628 |
-1.5 |
$949 |
-0.6 |
| 2009Q2 |
24,338 |
-4.2 |
$296,140,054 |
-8.2 |
$936 |
-4.1 |
| 2009Q3 |
23,436 |
-9.6 |
$273,355,299 |
-16.1 |
$897 |
-7.3 |
| 2009Q4 |
23,049 |
-11.5 |
$302,458,177 |
-15.9 |
$1,009 |
-5.0 |
| 2010Q1 |
22,502 |
-9.4 |
$278,073,919 |
-9.3 |
$951 |
0.1 |
| 2010Q2 |
23,982 |
-1.5 |
$309,671,042 |
4.6 |
$993 |
6.1 |
| 2010Q3 |
23,930 |
2.1 |
$292,999,952 |
7.2 |
$942 |
5.0 |
| 2010Q4 |
24,260 |
5.3 |
$334,190,642 |
10.5 |
$1,060 |
5.0 |
| 2011Q1 |
23,695 |
5.3 |
$312,149,268 |
12.3 |
$1,013 |
6.6 |
| 2011Q2 |
24,667 |
2.9 |
$335,234,571 |
8.3 |
$1,045 |
5.3 |
| 2011Q3 |
24,969 |
4.3 |
$337,721,870 |
15.3 |
$1,040 |
10.5 |
| 2011Q4 |
24,990 |
3.0 |
$347,002,418 |
3.8 |
$1,068 |
0.8 |
| 2012Q1 |
24,407 |
3.0 |
$347,974,608 |
11.5 |
$1,097 |
8.2 |
| 2012Q2 |
24,960 |
1.2 |
$343,677,581 |
2.5 |
$1,059 |
1.3 |
| 2012Q3 |
24,914 |
-0.2 |
$336,023,358 |
-0.5 |
$1,038 |
-0.3 |
| 2012Q4 |
25,219 |
0.9 |
$361,335,497 |
4.1 |
$1,102 |
3.2 |
| 2013Q1 |
24,430 |
0.1 |
$346,121,487 |
-0.5 |
$1,090 |
-0.6 |
| 2013Q2 |
24,851 |
-0.4 |
$344,967,104 |
0.4 |
$1,068 |
0.8 |
| 2013Q3 |
24,679 |
-0.9 |
$337,452,552 |
0.4 |
$1,052 |
1.4 |
| 2013Q4 |
24,559 |
-2.6 |
$356,511,516 |
-1.3 |
$1,117 |
1.3 |
| 2014Q1 |
24,119 |
-1.3 |
$354,113,553 |
2.3 |
$1,129 |
3.6 |
| 2014Q2 |
24,558 |
-1.2 |
$358,607,428 |
4.0 |
$1,123 |
5.2 |
| 2014Q3 |
24,140 |
-2.2 |
$344,075,871 |
2.0 |
$1,096 |
4.2 |
| 2014Q4 |
24,263 |
-1.2 |
$363,644,497 |
2.0 |
$1,153 |
3.2 |
| 2015Q1 |
23,758 |
-1.5 |
$351,319,835 |
-0.8 |
$1,138 |
0.7 |
| 2015Q2 |
23,725 |
-3.4 |
$338,070,283 |
-5.7 |
$1,096 |
-2.4 |
| 2015Q3 |
23,405 |
-3.0 |
$327,382,493 |
-4.9 |
$1,076 |
-1.9 |
| 2015Q4 |
23,476 |
-3.2 |
$358,281,930 |
-1.5 |
$1,174 |
1.8 |
| 2016Q1 |
22,356 |
-5.9 |
$311,197,436 |
-11.4 |
$1,071 |
-5.9 |
| 2016Q2 |
22,505 |
-5.1 |
$311,076,458 |
-8.0 |
$1,063 |
-3.0 |
| 2016Q3 |
22,217 |
-5.1 |
$314,315,272 |
-4.0 |
$1,088 |
1.1 |
| 2016Q4 |
22,290 |
-5.1 |
$320,634,924 |
-10.5 |
$1,107 |
-5.7 |
| 2017Q1 |
21,840 |
-2.3 |
$315,338,750 |
1.3 |
$1,111 |
3.7 |
| 2017Q2 |
22,284 |
-1.0 |
$325,906,232 |
4.8 |
$1,125 |
5.8 |
| 2017Q3 |
22,238 |
0.1 |
$310,479,225 |
-1.2 |
$1,074 |
-1.3 |
| 2017Q4 |
22,471 |
0.8 |
$336,447,304 |
4.9 |
$1,152 |
4.1 |
| 2018Q1 |
22,015 |
0.8 |
$323,785,591 |
2.7 |
$1,131 |
1.9 |
| 2018Q2 |
22,300 |
0.1 |
$328,713,573 |
0.9 |
$1,134 |
0.8 |
| 2018Q3 |
22,190 |
-0.2 |
$316,316,021 |
1.9 |
$1,097 |
2.1 |
| 2018Q4 |
22,593 |
0.5 |
$341,959,209 |
1.6 |
$1,164 |
1.1 |
| 2019Q1 |
22,118 |
0.5 |
$332,588,972 |
2.7 |
$1,157 |
2.2 |
| 2019Q2 |
22,665 |
1.6 |
$344,523,829 |
4.8 |
$1,169 |
3.1 |
| 2019Q3 |
22,372 |
0.8 |
$327,578,607 |
3.6 |
$1,126 |
2.7 |
| 2019Q4 |
22,016 |
-2.6 |
$339,129,396 |
-0.8 |
$1,185 |
1.8 |
| 2020Q1 |
21,143 |
-4.4 |
$318,836,832 |
-4.1 |
$1,160 |
0.3 |
| 2020Q2 |
19,676 |
-13.2 |
$291,541,723 |
-15.4 |
$1,140 |
-2.5 |
| 2020Q3 |
19,658 |
-12.1 |
$277,465,289 |
-15.3 |
$1,086 |
-3.6 |
| 2020Q4 |
20,009 |
-9.1 |
$304,518,603 |
-10.2 |
$1,171 |
-1.2 |
| 2021Q1 |
19,495 |
-7.8 |
$271,194,870 |
-14.9 |
$1,070 |
-7.8 |
| 2021Q2 |
19,930 |
1.3 |
$299,042,748 |
2.6 |
$1,154 |
1.3 |
| 2021Q3 |
19,741 |
0.4 |
$289,885,132 |
4.5 |
$1,130 |
4.0 |
| 2021Q4 |
20,011 |
0.0 |
$315,146,348 |
3.5 |
$1,211 |
3.5 |
| 2022Q1 |
19,717 |
1.1 |
$301,970,454 |
11.3 |
$1,178 |
10.1 |
| 2022Q2 |
20,402 |
2.4 |
$322,090,483 |
7.7 |
$1,214 |
5.2 |
| 2022Q3 |
20,555 |
4.1 |
$332,293,637 |
14.6 |
$1,244 |
10.1 |
| 2022Q4 |
20,692 |
3.4 |
$335,291,063 |
6.4 |
$1,246 |
2.9 |
| 2023Q1 |
20,273 |
2.8 |
$351,899,299 |
16.5 |
$1,335 |
13.3 |
| 2023Q2 |
20,990 |
2.9 |
$346,561,541 |
7.6 |
$1,270 |
4.6 |
| 2023Q3 |
21,088 |
2.6 |
$346,187,140 |
4.2 |
$1,263 |
1.6 |
| 2023Q4 |
21,112 |
2.0 |
$362,374,382 |
8.1 |
$1,320 |
5.9 |
| 2024Q1 |
20,552 |
1.4 |
$352,252,420 |
0.1 |
$1,318 |
-1.3 |
| 2024Q2 |
20,895 |
-0.5 |
$355,466,464 |
2.6 |
$1,309 |
3.0 |
| 2024Q3 |
20,699 |
-1.8 |
$346,153,571 |
0.0 |
$1,286 |
1.9 |
| 2024Q4 |
20,644 |
-2.2 |
$359,120,247 |
-0.9 |
$1,338 |
1.4 |
| 2025Q1 |
20,270 |
-1.4 |
$354,023,303 |
0.5 |
$1,344 |
1.9 |
| 2025Q2 |
20,406 |
-2.3 |
$365,815,749 |
2.9 |
$1,379 |
5.4 |
| 2025Q3b |
20,469 |
-1.1 |
$348,636,387 |
0.7 |
$1,310 |
1.9 |
|
|
|
|
|
|
|
|
|
|
|
|
|
|
| aNorth American Industry Classification System. |
|
|
|
|
| bPreliminary. |
|
|
|
|
|
|
| Source: Quarterly Census of Employment and Wages. |
|
|
|
|
| Prepared by M. Moore, Research & Planning, WY DWS, 4/3/26. |
|
|
|
|
Figure: Average Monthly Employment in Sweetwater County, 2001Q1-2025Q3
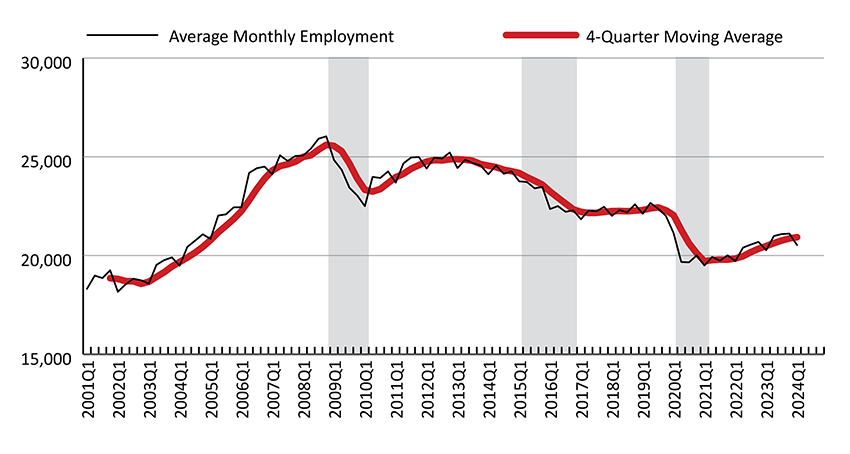
Figure: Over-the-Year Percent Change in Average Monthly Employment and Total Wages in Sweetwater County, 2002Q1-2025Q3
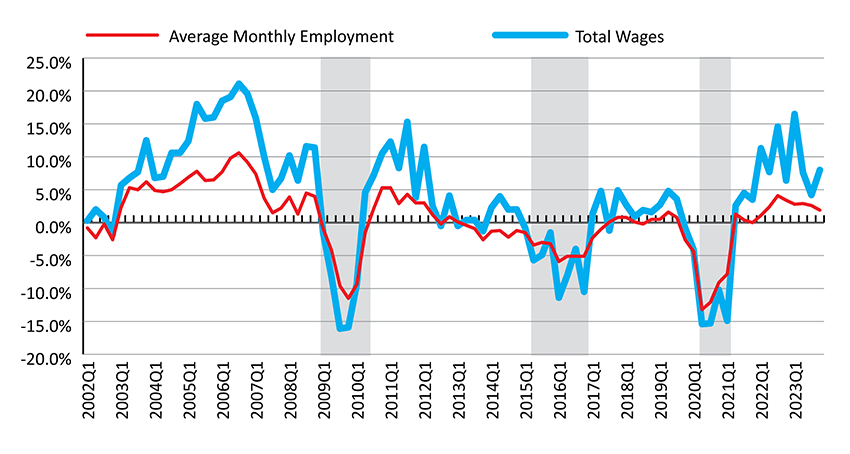
Shaded areas indicate periods of economic downturn: 2009Q1-2010Q1, 2015Q2-2016Q4, and 2020Q2-2021Q1.
Source: Quarterly Census of Employment and Wages.
Prepared by M. Moore, Research & Planning, WY DWS, 4/3/26.
 Hire Wyo