Wyoming QCEW Summary Statistics by County of Employment, 2001-2025
Niobrara County, 2025Q3
Average Monthly Employment: 779
Total Wages: $8,542,899
Average Weekly Wage: $844
Published April 2026.
| Table: Over-the-Year Change in Average Monthly Employment, Total Wages, and Average Weekly Wage in Niobrara County, WY, 2001Q1-2025Q3 |
| Published April 2026. |
|
|
|
|
|
|
|
|
|
|
|
|
|
Average Monthly Employment |
Total Wages |
Average Weekly Wage |
| Year/Quarter |
N |
% Change |
$ |
% Change |
$ |
% Change |
| 2001Q1 |
740 |
|
$3,473,440 |
|
$361 |
|
| 2001Q2 |
821 |
|
$4,161,766 |
|
$390 |
|
| 2001Q3 |
810 |
|
$3,873,722 |
|
$368 |
|
| 2001Q4 |
753 |
|
$3,901,211 |
|
$399 |
|
| 2002Q1 |
754 |
1.9 |
$3,826,488 |
10.2 |
$390 |
8.1 |
| 2002Q2 |
794 |
-3.3 |
$4,376,195 |
5.2 |
$424 |
8.7 |
| 2002Q3 |
803 |
-0.9 |
$3,942,887 |
1.8 |
$378 |
2.7 |
| 2002Q4 |
776 |
3.1 |
$4,114,240 |
5.5 |
$408 |
2.3 |
| 2003Q1 |
746 |
-1.1 |
$3,820,291 |
-0.2 |
$394 |
0.9 |
| 2003Q2 |
801 |
0.8 |
$4,358,259 |
-0.4 |
$419 |
-1.2 |
| 2003Q3 |
758 |
-5.6 |
$3,804,348 |
-3.5 |
$386 |
2.2 |
| 2003Q4 |
772 |
-0.5 |
$4,163,031 |
1.2 |
$415 |
1.7 |
| 2004Q1 |
745 |
-0.2 |
$3,906,714 |
2.3 |
$404 |
2.4 |
| 2004Q2 |
778 |
-2.8 |
$4,444,060 |
2.0 |
$439 |
4.9 |
| 2004Q3 |
751 |
-1.0 |
$3,885,163 |
2.1 |
$398 |
3.1 |
| 2004Q4 |
755 |
-2.2 |
$4,229,916 |
1.6 |
$431 |
3.9 |
| 2005Q1 |
749 |
0.6 |
$4,046,673 |
3.6 |
$415 |
2.9 |
| 2005Q2 |
792 |
1.8 |
$4,593,571 |
3.4 |
$446 |
1.5 |
| 2005Q3 |
764 |
1.8 |
$4,191,057 |
7.9 |
$422 |
5.9 |
| 2005Q4 |
760 |
0.7 |
$4,698,834 |
11.1 |
$475 |
10.3 |
| 2006Q1 |
719 |
-4.0 |
$4,355,900 |
7.6 |
$466 |
12.1 |
| 2006Q2 |
765 |
-3.4 |
$4,875,444 |
6.1 |
$490 |
9.9 |
| 2006Q3 |
796 |
4.1 |
$4,986,637 |
19.0 |
$482 |
14.3 |
| 2006Q4 |
813 |
7.0 |
$5,262,746 |
12.0 |
$498 |
4.7 |
| 2007Q1 |
816 |
13.4 |
$5,259,877 |
20.8 |
$496 |
6.4 |
| 2007Q2 |
844 |
10.3 |
$5,673,352 |
16.4 |
$517 |
5.5 |
| 2007Q3 |
833 |
4.7 |
$5,374,967 |
7.8 |
$496 |
3.0 |
| 2007Q4 |
856 |
5.2 |
$5,803,334 |
10.3 |
$522 |
4.8 |
| 2008Q1 |
814 |
-0.2 |
$5,436,445 |
3.4 |
$514 |
3.6 |
| 2008Q2 |
850 |
0.7 |
$5,813,240 |
2.5 |
$526 |
1.7 |
| 2008Q3 |
844 |
1.3 |
$5,578,877 |
3.8 |
$508 |
2.4 |
| 2008Q4 |
877 |
2.4 |
$6,112,718 |
5.3 |
$536 |
2.8 |
| 2009Q1 |
836 |
2.7 |
$5,903,158 |
8.6 |
$543 |
5.7 |
| 2009Q2 |
878 |
3.3 |
$6,335,126 |
9.0 |
$555 |
5.5 |
| 2009Q3 |
884 |
4.7 |
$6,306,409 |
13.0 |
$549 |
8.0 |
| 2009Q4 |
908 |
3.6 |
$6,910,776 |
13.1 |
$585 |
9.2 |
| 2010Q1 |
862 |
3.0 |
$6,118,312 |
3.6 |
$546 |
0.6 |
| 2010Q2 |
885 |
0.8 |
$6,745,029 |
6.5 |
$586 |
5.7 |
| 2010Q3 |
870 |
-1.5 |
$6,162,859 |
-2.3 |
$545 |
-0.8 |
| 2010Q4 |
870 |
-4.1 |
$6,883,462 |
-0.4 |
$608 |
3.9 |
| 2011Q1 |
850 |
-1.4 |
$6,322,315 |
3.3 |
$572 |
4.8 |
| 2011Q2 |
909 |
2.8 |
$7,251,148 |
7.5 |
$614 |
4.6 |
| 2011Q3 |
898 |
3.2 |
$6,667,039 |
8.2 |
$571 |
4.8 |
| 2011Q4 |
924 |
6.1 |
$7,348,836 |
6.8 |
$612 |
0.6 |
| 2012Q1 |
892 |
5.0 |
$6,683,899 |
5.7 |
$576 |
0.7 |
| 2012Q2 |
939 |
3.3 |
$7,861,117 |
8.4 |
$644 |
5.0 |
| 2012Q3 |
925 |
3.0 |
$6,634,532 |
-0.5 |
$552 |
-3.4 |
| 2012Q4 |
955 |
3.4 |
$7,878,918 |
7.2 |
$635 |
3.7 |
| 2013Q1 |
904 |
1.4 |
$7,127,133 |
6.6 |
$606 |
5.2 |
| 2013Q2 |
963 |
2.6 |
$7,984,220 |
1.6 |
$638 |
-1.0 |
| 2013Q3 |
924 |
-0.1 |
$7,230,352 |
9.0 |
$602 |
9.1 |
| 2013Q4 |
1,007 |
5.4 |
$9,755,712 |
23.8 |
$745 |
17.5 |
| 2014Q1 |
937 |
3.6 |
$8,636,431 |
21.2 |
$709 |
16.9 |
| 2014Q2 |
980 |
1.7 |
$8,870,654 |
11.1 |
$697 |
9.2 |
| 2014Q3 |
923 |
-0.1 |
$7,318,055 |
1.2 |
$610 |
1.3 |
| 2014Q4 |
943 |
-6.3 |
$8,340,063 |
-14.5 |
$680 |
-8.7 |
| 2015Q1 |
891 |
-5.0 |
$7,568,895 |
-12.4 |
$654 |
-7.8 |
| 2015Q2 |
925 |
-5.6 |
$8,232,351 |
-7.2 |
$685 |
-1.7 |
| 2015Q3 |
897 |
-2.9 |
$7,286,234 |
-0.4 |
$625 |
2.5 |
| 2015Q4 |
913 |
-3.1 |
$8,134,122 |
-2.5 |
$685 |
0.7 |
| 2016Q1 |
895 |
0.4 |
$7,732,906 |
2.2 |
$665 |
1.7 |
| 2016Q2 |
929 |
0.4 |
$8,465,135 |
2.8 |
$701 |
2.4 |
| 2016Q3 |
911 |
1.5 |
$7,291,306 |
0.1 |
$616 |
-1.4 |
| 2016Q4 |
903 |
-1.2 |
$7,614,249 |
-6.4 |
$649 |
-5.3 |
| 2017Q1 |
869 |
-2.9 |
$7,551,940 |
-2.3 |
$668 |
0.5 |
| 2017Q2 |
921 |
-0.8 |
$8,486,457 |
0.3 |
$709 |
1.1 |
| 2017Q3 |
913 |
0.2 |
$7,474,055 |
2.5 |
$630 |
2.3 |
| 2017Q4 |
891 |
-1.3 |
$7,895,767 |
3.7 |
$682 |
5.1 |
| 2018Q1 |
870 |
0.1 |
$7,644,768 |
1.2 |
$676 |
1.1 |
| 2018Q2 |
908 |
-1.4 |
$8,520,884 |
0.4 |
$722 |
1.8 |
| 2018Q3 |
880 |
-3.5 |
$7,575,352 |
1.4 |
$662 |
5.1 |
| 2018Q4 |
903 |
1.4 |
$8,165,231 |
3.4 |
$695 |
2.0 |
| 2019Q1 |
872 |
0.2 |
$7,906,576 |
3.4 |
$698 |
3.2 |
| 2019Q2 |
894 |
-1.6 |
$8,470,487 |
-0.6 |
$729 |
1.0 |
| 2019Q3 |
858 |
-2.5 |
$8,057,476 |
6.4 |
$722 |
9.1 |
| 2019Q4 |
847 |
-6.2 |
$8,094,547 |
-0.9 |
$735 |
5.7 |
| 2020Q1 |
845 |
-3.1 |
$8,041,680 |
1.7 |
$732 |
5.0 |
| 2020Q2 |
864 |
-3.4 |
$8,782,932 |
3.7 |
$782 |
7.3 |
| 2020Q3 |
822 |
-4.2 |
$7,647,000 |
-5.1 |
$716 |
-0.9 |
| 2020Q4 |
878 |
3.6 |
$8,904,400 |
10.0 |
$780 |
6.2 |
| 2021Q1 |
847 |
0.3 |
$7,865,369 |
-2.2 |
$714 |
-2.5 |
| 2021Q2 |
879 |
1.8 |
$9,229,300 |
5.1 |
$808 |
3.2 |
| 2021Q3 |
838 |
1.9 |
$8,163,935 |
6.8 |
$750 |
4.7 |
| 2021Q4 |
856 |
-2.5 |
$9,290,996 |
4.3 |
$835 |
7.0 |
| 2022Q1 |
838 |
-1.1 |
$8,609,292 |
9.5 |
$791 |
10.7 |
| 2022Q2 |
867 |
-1.4 |
$9,478,890 |
2.7 |
$841 |
4.1 |
| 2022Q3 |
812 |
-3.1 |
$8,110,017 |
-0.7 |
$768 |
2.5 |
| 2022Q4 |
832 |
-2.7 |
$8,922,676 |
-4.0 |
$825 |
-1.3 |
| 2023Q1 |
807 |
-3.7 |
$8,156,172 |
-5.3 |
$778 |
-1.6 |
| 2023Q2 |
845 |
-2.6 |
$9,796,508 |
3.4 |
$892 |
6.1 |
| 2023Q3 |
791 |
-2.5 |
$8,075,825 |
-0.4 |
$785 |
2.2 |
| 2023Q4 |
835 |
0.4 |
$9,123,628 |
2.3 |
$840 |
1.9 |
| 2024Q1 |
800 |
-0.9 |
$8,300,868 |
1.8 |
$798 |
2.7 |
| 2024Q2 |
830 |
-1.7 |
$9,995,731 |
2.0 |
$926 |
3.8 |
| 2024Q3 |
785 |
-0.8 |
$8,606,620 |
6.6 |
$844 |
7.5 |
| 2024Q4 |
824 |
-1.4 |
$9,587,840 |
5.1 |
$895 |
6.6 |
| 2025Q1 |
773 |
-3.4 |
$8,652,714 |
4.2 |
$861 |
7.9 |
| 2025Q2 |
818 |
-1.4 |
$10,085,704 |
0.9 |
$948 |
2.3 |
| 2025Q3b |
779 |
-0.7 |
$8,542,899 |
-0.7 |
$844 |
0.0 |
|
|
|
|
|
|
|
|
|
|
|
|
|
|
| aNorth American Industry Classification System. |
|
|
|
|
| bPreliminary. |
|
|
|
|
|
|
| Source: Quarterly Census of Employment and Wages. |
|
|
|
|
| Prepared by M. Moore, Research & Planning, WY DWS, 4/3/26. |
|
|
|
|
Figure: Average Monthly Employment in Niobrara County, 2001Q1-2025Q3

Figure: Over-the-Year Percent Change in Average Monthly Employment and Total Wages in Niobrara County, 2002Q1-2025Q3
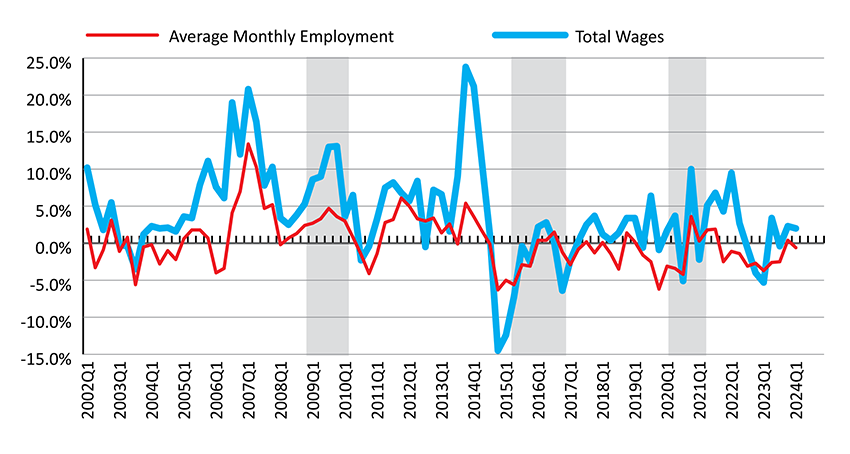
Shaded areas indicate periods of economic downturn: 2009Q1-2010Q1, 2015Q2-2016Q4, and 2020Q2-2021Q1.
Source: Quarterly Census of Employment and Wages.
Prepared by M. Moore, Research & Planning, WY DWS, 4/3/26.
 Hire Wyo