Wyoming QCEW Summary Statistics by County of Employment, 2001-2025
Natrona County, 2025Q3
Average Monthly Employment: 40,476
Total Wages: $639,257,618
Average Weekly Wage: $1,215
Published April 2026.
| Table: Over-the-Year Change in Average Monthly Employment, Total Wages, and Average Weekly Wage in Natrona County, WY, 2001Q1-2025Q3 |
| Published April 2026. |
|
|
|
|
|
|
|
|
|
|
|
|
|
Average Monthly Employment |
Total Wages |
Average Weekly Wage |
| Year/Quarter |
N |
% Change |
$ |
% Change |
$ |
% Change |
| 2001Q1 |
30,895 |
|
$210,806,157 |
|
$525 |
|
| 2001Q2 |
32,272 |
|
$225,984,152 |
|
$539 |
|
| 2001Q3 |
32,316 |
|
$219,204,112 |
|
$522 |
|
| 2001Q4 |
32,121 |
|
$245,655,983 |
|
$588 |
|
| 2002Q1 |
31,976 |
3.5 |
$225,724,716 |
7.1 |
$543 |
3.5 |
| 2002Q2 |
32,955 |
2.1 |
$237,946,193 |
5.3 |
$555 |
3.1 |
| 2002Q3 |
33,098 |
2.4 |
$228,389,935 |
4.2 |
$531 |
1.7 |
| 2002Q4 |
33,027 |
2.8 |
$254,345,895 |
3.5 |
$592 |
0.7 |
| 2003Q1 |
32,257 |
0.9 |
$231,485,194 |
2.6 |
$552 |
1.7 |
| 2003Q2 |
33,760 |
2.4 |
$252,399,391 |
6.1 |
$575 |
3.5 |
| 2003Q3 |
34,092 |
3.0 |
$246,345,719 |
7.9 |
$556 |
4.7 |
| 2003Q4 |
34,119 |
3.3 |
$279,021,111 |
9.7 |
$629 |
6.2 |
| 2004Q1 |
33,722 |
4.5 |
$256,833,525 |
11.0 |
$586 |
6.1 |
| 2004Q2 |
35,199 |
4.3 |
$281,087,602 |
11.4 |
$614 |
6.8 |
| 2004Q3 |
35,954 |
5.5 |
$283,908,552 |
15.2 |
$607 |
9.3 |
| 2004Q4 |
36,186 |
6.1 |
$316,722,279 |
13.5 |
$673 |
7.0 |
| 2005Q1 |
35,340 |
4.8 |
$287,280,841 |
11.9 |
$625 |
6.7 |
| 2005Q2 |
36,513 |
3.7 |
$311,789,979 |
10.9 |
$657 |
6.9 |
| 2005Q3 |
36,815 |
2.4 |
$319,051,906 |
12.4 |
$667 |
9.8 |
| 2005Q4 |
37,299 |
3.1 |
$352,138,560 |
11.2 |
$726 |
7.9 |
| 2006Q1 |
37,032 |
4.8 |
$335,929,016 |
16.9 |
$698 |
11.6 |
| 2006Q2 |
38,599 |
5.7 |
$363,264,395 |
16.5 |
$724 |
10.2 |
| 2006Q3 |
38,648 |
5.0 |
$358,009,614 |
12.2 |
$713 |
6.9 |
| 2006Q4 |
38,905 |
4.3 |
$409,777,160 |
16.4 |
$810 |
11.6 |
| 2007Q1 |
38,303 |
3.4 |
$378,056,577 |
12.5 |
$759 |
8.8 |
| 2007Q2 |
39,367 |
2.0 |
$395,605,638 |
8.9 |
$773 |
6.8 |
| 2007Q3 |
39,538 |
2.3 |
$393,015,370 |
9.8 |
$765 |
7.3 |
| 2007Q4 |
39,765 |
2.2 |
$445,380,027 |
8.7 |
$862 |
6.3 |
| 2008Q1 |
39,018 |
1.9 |
$408,326,653 |
8.0 |
$805 |
6.0 |
| 2008Q2 |
40,161 |
2.0 |
$423,579,127 |
7.1 |
$811 |
5.0 |
| 2008Q3 |
40,685 |
2.9 |
$436,084,042 |
11.0 |
$825 |
7.8 |
| 2008Q4 |
40,837 |
2.7 |
$493,739,957 |
10.9 |
$930 |
7.9 |
| 2009Q1 |
39,026 |
0.0 |
$409,926,404 |
0.4 |
$808 |
0.4 |
| 2009Q2 |
38,671 |
-3.7 |
$391,726,341 |
-7.5 |
$779 |
-4.0 |
| 2009Q3 |
37,871 |
-6.9 |
$391,017,920 |
-10.3 |
$794 |
-3.7 |
| 2009Q4 |
37,262 |
-8.8 |
$426,861,969 |
-13.5 |
$881 |
-5.2 |
| 2010Q1 |
36,890 |
-5.5 |
$373,570,125 |
-8.9 |
$779 |
-3.6 |
| 2010Q2 |
38,092 |
-1.5 |
$401,332,638 |
2.5 |
$810 |
4.0 |
| 2010Q3 |
38,281 |
1.1 |
$434,662,852 |
11.2 |
$873 |
10.0 |
| 2010Q4 |
38,487 |
3.3 |
$466,193,631 |
9.2 |
$932 |
5.7 |
| 2011Q1 |
37,704 |
2.2 |
$412,904,007 |
10.5 |
$842 |
8.1 |
| 2011Q2 |
39,186 |
2.9 |
$439,570,075 |
9.5 |
$863 |
6.5 |
| 2011Q3 |
39,835 |
4.1 |
$463,873,544 |
6.7 |
$896 |
2.6 |
| 2011Q4 |
40,321 |
4.8 |
$499,237,798 |
7.1 |
$952 |
2.2 |
| 2012Q1 |
39,826 |
5.6 |
$466,875,889 |
13.1 |
$902 |
7.0 |
| 2012Q2 |
40,949 |
4.5 |
$475,911,074 |
8.3 |
$894 |
3.6 |
| 2012Q3 |
41,256 |
3.6 |
$483,227,857 |
4.2 |
$901 |
0.6 |
| 2012Q4 |
41,694 |
3.4 |
$542,654,203 |
8.7 |
$1,001 |
5.1 |
| 2013Q1 |
40,925 |
2.8 |
$480,157,150 |
2.8 |
$903 |
0.1 |
| 2013Q2 |
41,837 |
2.2 |
$485,081,453 |
1.9 |
$892 |
-0.2 |
| 2013Q3 |
41,993 |
1.8 |
$496,580,723 |
2.8 |
$910 |
1.0 |
| 2013Q4 |
42,234 |
1.3 |
$557,887,029 |
2.8 |
$1,016 |
1.5 |
| 2014Q1 |
41,409 |
1.2 |
$504,021,013 |
5.0 |
$936 |
3.7 |
| 2014Q2 |
42,662 |
2.0 |
$520,276,684 |
7.3 |
$938 |
5.2 |
| 2014Q3 |
42,931 |
2.2 |
$541,872,644 |
9.1 |
$971 |
6.7 |
| 2014Q4 |
43,434 |
2.8 |
$610,231,737 |
9.4 |
$1,081 |
6.4 |
| 2015Q1 |
42,607 |
2.9 |
$531,371,347 |
5.4 |
$959 |
2.5 |
| 2015Q2 |
42,088 |
-1.3 |
$513,304,738 |
-1.3 |
$938 |
0.0 |
| 2015Q3 |
41,443 |
-3.5 |
$495,919,592 |
-8.5 |
$920 |
-5.2 |
| 2015Q4 |
41,269 |
-5.0 |
$536,427,036 |
-12.1 |
$1,000 |
-7.5 |
| 2016Q1 |
39,049 |
-8.4 |
$436,653,450 |
-17.8 |
$860 |
-10.3 |
| 2016Q2 |
39,004 |
-7.3 |
$435,340,762 |
-15.2 |
$859 |
-8.5 |
| 2016Q3 |
38,267 |
-7.7 |
$438,500,776 |
-11.6 |
$881 |
-4.2 |
| 2016Q4 |
37,704 |
-8.6 |
$455,129,345 |
-15.2 |
$929 |
-7.1 |
| 2017Q1 |
37,135 |
-4.9 |
$427,375,906 |
-2.1 |
$885 |
2.9 |
| 2017Q2 |
38,089 |
-2.3 |
$445,151,430 |
2.3 |
$899 |
4.7 |
| 2017Q3 |
38,482 |
0.6 |
$457,132,287 |
4.2 |
$914 |
3.7 |
| 2017Q4 |
38,588 |
2.3 |
$489,595,799 |
7.6 |
$976 |
5.1 |
| 2018Q1 |
37,662 |
1.4 |
$457,144,130 |
7.0 |
$934 |
5.5 |
| 2018Q2 |
38,660 |
1.5 |
$464,868,287 |
4.4 |
$925 |
2.9 |
| 2018Q3 |
38,669 |
0.5 |
$479,992,974 |
5.0 |
$955 |
4.5 |
| 2018Q4 |
39,032 |
1.2 |
$531,224,489 |
8.5 |
$1,047 |
7.3 |
| 2019Q1 |
38,244 |
1.5 |
$486,402,120 |
6.4 |
$978 |
4.8 |
| 2019Q2 |
39,218 |
1.4 |
$496,559,120 |
6.8 |
$974 |
5.3 |
| 2019Q3 |
39,478 |
2.1 |
$503,173,324 |
4.8 |
$980 |
2.7 |
| 2019Q4 |
39,585 |
1.4 |
$549,404,857 |
3.4 |
$1,068 |
2.0 |
| 2020Q1 |
38,517 |
0.7 |
$483,563,136 |
-0.6 |
$966 |
-1.3 |
| 2020Q2 |
35,168 |
-10.3 |
$438,202,347 |
-11.8 |
$958 |
-1.6 |
| 2020Q3 |
36,070 |
-8.6 |
$435,536,097 |
-13.4 |
$929 |
-5.3 |
| 2020Q4 |
36,203 |
-8.5 |
$495,898,904 |
-9.7 |
$1,054 |
-1.3 |
| 2021Q1 |
35,425 |
-8.0 |
$421,697,229 |
-12.8 |
$916 |
-5.2 |
| 2021Q2 |
36,914 |
5.0 |
$456,510,706 |
4.2 |
$951 |
-0.8 |
| 2021Q3 |
37,241 |
3.2 |
$474,904,103 |
9.0 |
$981 |
5.6 |
| 2021Q4 |
37,404 |
3.3 |
$536,629,939 |
8.2 |
$1,104 |
4.7 |
| 2022Q1 |
36,907 |
4.2 |
$487,135,447 |
15.5 |
$1,015 |
10.9 |
| 2022Q2 |
38,143 |
3.3 |
$510,674,413 |
11.9 |
$1,030 |
8.3 |
| 2022Q3 |
38,783 |
4.1 |
$548,294,163 |
15.5 |
$1,087 |
10.9 |
| 2022Q4 |
38,905 |
4.0 |
$585,582,800 |
9.1 |
$1,158 |
4.9 |
| 2023Q1 |
38,516 |
4.4 |
$553,842,574 |
13.7 |
$1,106 |
8.9 |
| 2023Q2 |
39,669 |
4.0 |
$555,595,026 |
8.8 |
$1,077 |
4.6 |
| 2023Q3 |
39,933 |
3.0 |
$579,870,739 |
5.8 |
$1,117 |
2.7 |
| 2023Q4 |
39,651 |
1.9 |
$633,107,081 |
8.1 |
$1,228 |
6.1 |
| 2024Q1 |
39,092 |
1.5 |
$590,030,019 |
6.5 |
$1,161 |
5.0 |
| 2024Q2 |
40,089 |
1.1 |
$587,783,409 |
5.8 |
$1,128 |
4.7 |
| 2024Q3 |
40,453 |
1.3 |
$609,861,670 |
5.2 |
$1,160 |
3.8 |
| 2024Q4 |
40,482 |
2.1 |
$669,801,485 |
5.8 |
$1,273 |
3.6 |
| 2025Q1 |
39,515 |
1.1 |
$602,279,508 |
2.1 |
$1,172 |
1.0 |
| 2025Q2 |
40,316 |
0.6 |
$610,845,732 |
3.9 |
$1,165 |
3.3 |
| 2025Q3b |
40,476 |
0.1 |
$639,257,618 |
4.8 |
$1,215 |
4.8 |
|
|
|
|
|
|
|
|
|
|
|
|
|
|
| aNorth American Industry Classification System. |
|
|
|
|
| bPreliminary. |
|
|
|
|
|
|
| Source: Quarterly Census of Employment and Wages. |
|
|
|
|
| Prepared by M. Moore, Research & Planning, WY DWS, 4/3/26. |
|
|
|
|
Figure: Average Monthly Employment in Natrona County, 2001Q1-2025Q3

Figure: Over-the-Year Percent Change in Average Monthly Employment and Total Wages in Natrona County, 2002Q1-2025Q3
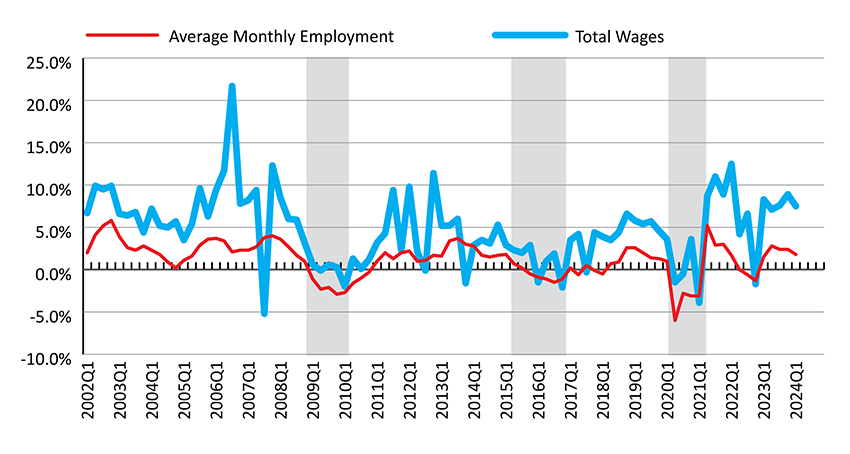
Shaded areas indicate periods of economic downturn: 2009Q1-2010Q1, 2015Q2-2016Q4, and 2020Q2-2021Q1.
Source: Quarterly Census of Employment and Wages.
Prepared by M. Moore, Research & Planning, WY DWS, 4/3/26.
 Hire Wyo