Wyoming QCEW Summary Statistics by County of Employment, 2001-2025
Lincoln County, 2025Q3
Average Monthly Employment: 7,339
Total Wages: $115,488,077
Average Weekly Wage: $1,210
Published April 2026.
| Table: Over-the-Year Change in Average Monthly Employment, Total Wages, and Average Weekly Wage in Lincoln County, WY, 2001Q1-2025Q3 |
| Published April 2026. |
|
|
|
|
|
|
|
|
|
|
|
|
|
Average Monthly Employment |
Total Wages |
Average Weekly Wage |
| Year/Quarter |
N |
% Change |
$ |
% Change |
$ |
% Change |
| 2001Q1 |
4,718 |
|
$32,055,697 |
|
$523 |
|
| 2001Q2 |
5,304 |
|
$36,389,550 |
|
$528 |
|
| 2001Q3 |
5,631 |
|
$34,318,023 |
|
$469 |
|
| 2001Q4 |
5,243 |
|
$36,253,942 |
|
$532 |
|
| 2002Q1 |
4,849 |
2.8 |
$32,354,348 |
0.9 |
$513 |
-1.8 |
| 2002Q2 |
5,344 |
0.8 |
$37,212,499 |
2.3 |
$536 |
1.5 |
| 2002Q3 |
5,634 |
0.1 |
$34,415,534 |
0.3 |
$470 |
0.2 |
| 2002Q4 |
5,238 |
-0.1 |
$37,566,222 |
3.6 |
$552 |
3.7 |
| 2003Q1 |
5,521 |
13.8 |
$44,008,969 |
36.0 |
$613 |
19.5 |
| 2003Q2 |
6,086 |
13.9 |
$47,005,426 |
26.3 |
$594 |
10.9 |
| 2003Q3 |
6,551 |
16.3 |
$49,709,780 |
44.4 |
$584 |
24.2 |
| 2003Q4 |
6,170 |
17.8 |
$51,353,821 |
36.7 |
$640 |
16.1 |
| 2004Q1 |
5,742 |
4.0 |
$44,532,665 |
1.2 |
$597 |
-2.7 |
| 2004Q2 |
6,154 |
1.1 |
$48,783,593 |
3.8 |
$610 |
2.6 |
| 2004Q3 |
6,007 |
-8.3 |
$45,076,650 |
-9.3 |
$577 |
-1.1 |
| 2004Q4 |
5,814 |
-5.8 |
$46,003,363 |
-10.4 |
$609 |
-4.9 |
| 2005Q1 |
5,515 |
-4.0 |
$43,963,526 |
-1.3 |
$613 |
2.8 |
| 2005Q2 |
5,959 |
-3.2 |
$46,903,604 |
-3.9 |
$605 |
-0.7 |
| 2005Q3 |
6,015 |
0.1 |
$46,568,547 |
3.3 |
$596 |
3.2 |
| 2005Q4 |
5,968 |
2.7 |
$47,431,683 |
3.1 |
$611 |
0.4 |
| 2006Q1 |
5,758 |
4.4 |
$47,815,905 |
8.8 |
$639 |
4.2 |
| 2006Q2 |
6,334 |
6.3 |
$52,355,290 |
11.6 |
$636 |
5.0 |
| 2006Q3 |
6,510 |
8.2 |
$53,786,968 |
15.5 |
$636 |
6.7 |
| 2006Q4 |
6,765 |
13.3 |
$65,079,180 |
37.2 |
$740 |
21.1 |
| 2007Q1 |
6,463 |
12.2 |
$61,408,520 |
28.4 |
$731 |
14.4 |
| 2007Q2 |
7,167 |
13.2 |
$68,923,009 |
31.6 |
$740 |
16.3 |
| 2007Q3 |
7,590 |
16.6 |
$83,153,367 |
54.6 |
$843 |
32.6 |
| 2007Q4 |
7,665 |
13.3 |
$94,369,470 |
45.0 |
$947 |
28.0 |
| 2008Q1 |
6,899 |
6.8 |
$81,498,333 |
32.7 |
$909 |
24.3 |
| 2008Q2 |
6,726 |
-6.2 |
$66,000,584 |
-4.2 |
$755 |
2.0 |
| 2008Q3 |
6,556 |
-13.6 |
$59,522,356 |
-28.4 |
$698 |
-17.1 |
| 2008Q4 |
6,499 |
-15.2 |
$64,711,539 |
-31.4 |
$766 |
-19.1 |
| 2009Q1 |
6,194 |
-10.2 |
$56,390,565 |
-30.8 |
$700 |
-22.9 |
| 2009Q2 |
6,569 |
-2.3 |
$66,819,223 |
1.2 |
$782 |
3.7 |
| 2009Q3 |
6,150 |
-6.2 |
$56,171,537 |
-5.6 |
$703 |
0.6 |
| 2009Q4 |
6,146 |
-5.4 |
$61,058,225 |
-5.6 |
$764 |
-0.2 |
| 2010Q1 |
5,708 |
-7.8 |
$54,670,106 |
-3.1 |
$737 |
5.2 |
| 2010Q2 |
6,091 |
-7.3 |
$57,024,133 |
-14.7 |
$720 |
-8.0 |
| 2010Q3 |
6,178 |
0.4 |
$58,502,872 |
4.2 |
$728 |
3.7 |
| 2010Q4 |
6,094 |
-0.9 |
$65,594,415 |
7.4 |
$828 |
8.4 |
| 2011Q1 |
5,832 |
2.2 |
$61,362,020 |
12.2 |
$809 |
9.9 |
| 2011Q2 |
6,280 |
3.1 |
$68,875,353 |
20.8 |
$844 |
17.1 |
| 2011Q3 |
6,147 |
-0.5 |
$63,651,537 |
8.8 |
$797 |
9.3 |
| 2011Q4 |
6,092 |
0.0 |
$66,925,221 |
2.0 |
$845 |
2.1 |
| 2012Q1 |
5,495 |
-5.8 |
$59,014,351 |
-3.8 |
$826 |
2.1 |
| 2012Q2 |
5,814 |
-7.4 |
$62,218,334 |
-9.7 |
$823 |
-2.4 |
| 2012Q3 |
5,692 |
-7.4 |
$56,309,862 |
-11.5 |
$761 |
-4.5 |
| 2012Q4 |
5,746 |
-5.7 |
$63,528,944 |
-5.1 |
$850 |
0.6 |
| 2013Q1 |
5,430 |
-1.2 |
$55,831,340 |
-5.4 |
$791 |
-4.3 |
| 2013Q2 |
5,774 |
-0.7 |
$63,021,902 |
1.3 |
$840 |
2.0 |
| 2013Q3 |
5,718 |
0.5 |
$57,332,792 |
1.8 |
$771 |
1.3 |
| 2013Q4 |
5,674 |
-1.3 |
$65,236,309 |
2.7 |
$884 |
4.0 |
| 2014Q1 |
5,458 |
0.5 |
$56,831,781 |
1.8 |
$801 |
1.3 |
| 2014Q2 |
5,835 |
1.1 |
$65,380,378 |
3.7 |
$862 |
2.7 |
| 2014Q3 |
5,818 |
1.8 |
$59,464,388 |
3.7 |
$786 |
1.9 |
| 2014Q4 |
5,882 |
3.7 |
$67,656,735 |
3.7 |
$885 |
0.0 |
| 2015Q1 |
5,658 |
3.7 |
$59,303,498 |
4.3 |
$806 |
0.7 |
| 2015Q2 |
6,074 |
4.1 |
$69,592,503 |
6.4 |
$881 |
2.3 |
| 2015Q3 |
5,999 |
3.1 |
$62,028,750 |
4.3 |
$795 |
1.2 |
| 2015Q4 |
6,088 |
3.5 |
$71,284,284 |
5.4 |
$901 |
1.8 |
| 2016Q1 |
5,852 |
3.4 |
$61,680,420 |
4.0 |
$811 |
0.6 |
| 2016Q2 |
6,253 |
2.9 |
$73,472,448 |
5.6 |
$904 |
2.6 |
| 2016Q3 |
6,196 |
3.3 |
$69,780,886 |
12.5 |
$866 |
8.9 |
| 2016Q4 |
6,154 |
1.1 |
$69,139,998 |
-3.0 |
$864 |
-4.0 |
| 2017Q1 |
5,943 |
1.6 |
$69,280,097 |
12.3 |
$897 |
10.6 |
| 2017Q2 |
6,368 |
1.8 |
$70,760,078 |
-3.7 |
$855 |
-5.4 |
| 2017Q3 |
6,309 |
1.8 |
$69,864,485 |
0.1 |
$852 |
-1.7 |
| 2017Q4 |
6,307 |
2.5 |
$73,520,939 |
6.3 |
$897 |
3.8 |
| 2018Q1 |
6,094 |
2.5 |
$68,901,222 |
-0.5 |
$870 |
-3.0 |
| 2018Q2 |
6,435 |
1.0 |
$75,213,620 |
6.3 |
$899 |
5.2 |
| 2018Q3 |
6,383 |
1.2 |
$74,168,894 |
6.2 |
$894 |
4.9 |
| 2018Q4 |
6,355 |
0.8 |
$77,627,564 |
5.6 |
$940 |
4.8 |
| 2019Q1 |
6,255 |
2.6 |
$74,912,879 |
8.7 |
$921 |
5.9 |
| 2019Q2 |
6,578 |
2.2 |
$76,545,358 |
1.8 |
$895 |
-0.4 |
| 2019Q3 |
6,581 |
3.1 |
$82,556,413 |
11.3 |
$965 |
8.0 |
| 2019Q4 |
6,590 |
3.7 |
$82,017,054 |
5.7 |
$957 |
1.9 |
| 2020Q1 |
6,401 |
2.3 |
$80,814,510 |
7.9 |
$971 |
5.4 |
| 2020Q2 |
6,495 |
-1.3 |
$79,179,826 |
3.4 |
$938 |
4.8 |
| 2020Q3 |
6,557 |
-0.4 |
$79,295,822 |
-3.9 |
$930 |
-3.6 |
| 2020Q4 |
6,693 |
1.6 |
$91,836,987 |
12.0 |
$1,055 |
10.2 |
| 2021Q1 |
6,569 |
2.6 |
$84,965,949 |
5.1 |
$995 |
2.5 |
| 2021Q2 |
6,981 |
7.5 |
$97,811,392 |
23.5 |
$1,078 |
14.9 |
| 2021Q3 |
6,850 |
4.5 |
$88,994,807 |
12.2 |
$999 |
7.4 |
| 2021Q4 |
6,824 |
2.0 |
$99,460,876 |
8.3 |
$1,121 |
6.2 |
| 2022Q1 |
6,667 |
1.5 |
$90,635,002 |
6.7 |
$1,046 |
5.1 |
| 2022Q2 |
7,119 |
2.0 |
$94,511,570 |
-3.4 |
$1,021 |
-5.2 |
| 2022Q3 |
7,052 |
3.0 |
$100,392,368 |
12.8 |
$1,095 |
9.6 |
| 2022Q4 |
6,950 |
1.9 |
$104,124,296 |
4.7 |
$1,152 |
2.8 |
| 2023Q1 |
6,802 |
2.0 |
$98,947,098 |
9.2 |
$1,119 |
7.0 |
| 2023Q2 |
7,157 |
0.5 |
$105,366,014 |
11.5 |
$1,132 |
10.9 |
| 2023Q3 |
7,127 |
1.1 |
$103,222,503 |
2.8 |
$1,114 |
1.7 |
| 2023Q4 |
7,123 |
2.5 |
$114,053,867 |
9.5 |
$1,232 |
6.9 |
| 2024Q1 |
6,990 |
2.8 |
$104,845,336 |
6.0 |
$1,154 |
3.1 |
| 2024Q2 |
7,480 |
4.5 |
$113,859,841 |
8.1 |
$1,171 |
3.4 |
| 2024Q3 |
7,419 |
4.1 |
$113,306,588 |
9.8 |
$1,175 |
5.4 |
| 2024Q4 |
7,290 |
2.3 |
$120,395,121 |
5.6 |
$1,270 |
3.1 |
| 2025Q1 |
7,130 |
2.0 |
$113,016,905 |
7.8 |
$1,219 |
5.7 |
| 2025Q2 |
7,536 |
0.7 |
$119,958,599 |
5.4 |
$1,224 |
4.6 |
| 2025Q3b |
7,339 |
-1.1 |
$115,488,077 |
1.9 |
$1,210 |
3.0 |
|
|
|
|
|
|
|
|
|
|
|
|
|
|
| aNorth American Industry Classification System. |
|
|
|
|
| bPreliminary. |
|
|
|
|
|
|
| Source: Quarterly Census of Employment and Wages. |
|
|
|
|
| Prepared by M. Moore, Research & Planning, WY DWS, 4/3/26. |
|
|
|
|
Figure: Average Monthly Employment in Lincoln County, 2001Q1-2025Q3
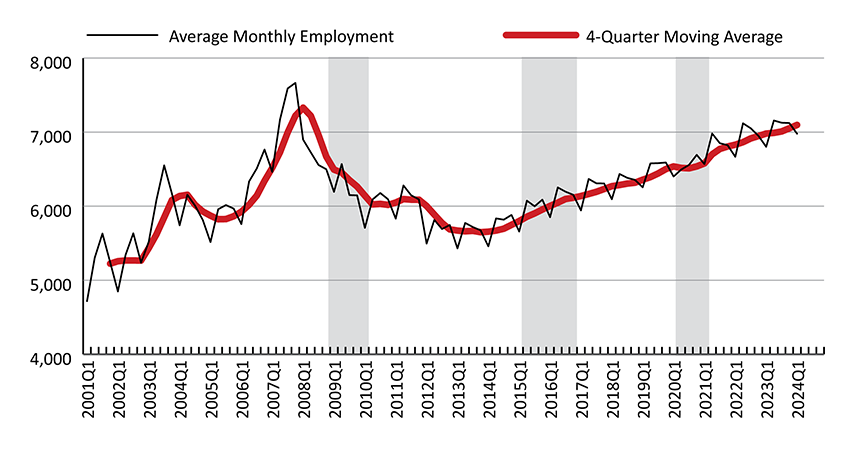
Figure: Over-the-Year Percent Change in Average Monthly Employment and Total Wages in Lincoln County, 2002Q1-2025Q3

Shaded areas indicate periods of economic downturn: 2009Q1-2010Q1, 2015Q2-2016Q4, and 2020Q2-2021Q1.
Source: Quarterly Census of Employment and Wages.
Prepared by M. Moore, Research & Planning, WY DWS, 4/3/26.
 Hire Wyo