Wyoming QCEW Summary Statistics by County of Employment, 2001-2025
Laramie County, 2025Q3
Average Monthly Employment: 49,453
Total Wages: $789,466,060
Average Weekly Wage: $1,228
Published April 2026.
| Table: Over-the-Year Change in Average Monthly Employment, Total Wages, and Average Weekly Wage in Laramie County, WY, 2001Q1-2025Q3 |
| Published April 2026. |
|
|
|
|
|
|
|
|
|
|
|
|
|
Average Monthly Employment |
Total Wages |
Average Weekly Wage |
| Year/Quarter |
N |
% Change |
$ |
% Change |
$ |
% Change |
| 2001Q1 |
35,791 |
|
$242,999,459 |
|
$522 |
|
| 2001Q2 |
36,739 |
|
$241,528,376 |
|
$506 |
|
| 2001Q3 |
36,797 |
|
$252,300,546 |
|
$527 |
|
| 2001Q4 |
36,443 |
|
$268,171,043 |
|
$566 |
|
| 2002Q1 |
36,517 |
2.0 |
$259,350,910 |
6.7 |
$546 |
4.6 |
| 2002Q2 |
38,236 |
4.1 |
$265,555,385 |
9.9 |
$534 |
5.6 |
| 2002Q3 |
38,725 |
5.2 |
$276,169,576 |
9.5 |
$549 |
4.0 |
| 2002Q4 |
38,569 |
5.8 |
$294,638,264 |
9.9 |
$588 |
3.8 |
| 2003Q1 |
37,946 |
3.9 |
$276,355,607 |
6.6 |
$560 |
2.5 |
| 2003Q2 |
39,243 |
2.6 |
$282,539,864 |
6.4 |
$554 |
3.7 |
| 2003Q3 |
39,620 |
2.3 |
$294,967,117 |
6.8 |
$573 |
4.4 |
| 2003Q4 |
39,641 |
2.8 |
$307,713,192 |
4.4 |
$597 |
1.6 |
| 2004Q1 |
38,806 |
2.3 |
$296,116,447 |
7.2 |
$587 |
4.8 |
| 2004Q2 |
39,944 |
1.8 |
$297,348,573 |
5.2 |
$573 |
3.4 |
| 2004Q3 |
39,983 |
0.9 |
$309,635,159 |
5.0 |
$596 |
4.0 |
| 2004Q4 |
39,718 |
0.2 |
$325,371,777 |
5.7 |
$630 |
5.5 |
| 2005Q1 |
39,226 |
1.1 |
$306,366,194 |
3.5 |
$601 |
2.4 |
| 2005Q2 |
40,578 |
1.6 |
$313,491,650 |
5.4 |
$594 |
3.8 |
| 2005Q3 |
41,133 |
2.9 |
$339,223,217 |
9.6 |
$634 |
6.5 |
| 2005Q4 |
41,134 |
3.6 |
$345,914,548 |
6.3 |
$647 |
2.7 |
| 2006Q1 |
40,676 |
3.7 |
$335,309,384 |
9.4 |
$634 |
5.5 |
| 2006Q2 |
41,940 |
3.4 |
$350,070,625 |
11.7 |
$642 |
8.0 |
| 2006Q3 |
41,983 |
2.1 |
$412,978,659 |
21.7 |
$757 |
19.3 |
| 2006Q4 |
42,069 |
2.3 |
$373,022,877 |
7.8 |
$682 |
5.4 |
| 2007Q1 |
41,593 |
2.3 |
$362,761,840 |
8.2 |
$671 |
5.8 |
| 2007Q2 |
43,092 |
2.7 |
$383,055,268 |
9.4 |
$684 |
6.5 |
| 2007Q3 |
43,585 |
3.8 |
$391,395,811 |
-5.2 |
$691 |
-8.7 |
| 2007Q4 |
43,731 |
4.0 |
$418,922,782 |
12.3 |
$737 |
8.0 |
| 2008Q1 |
43,108 |
3.6 |
$393,599,620 |
8.5 |
$702 |
4.7 |
| 2008Q2 |
44,243 |
2.7 |
$406,178,487 |
6.0 |
$706 |
3.3 |
| 2008Q3 |
44,347 |
1.7 |
$414,484,010 |
5.9 |
$719 |
4.1 |
| 2008Q4 |
44,164 |
1.0 |
$432,191,251 |
3.2 |
$753 |
2.2 |
| 2009Q1 |
42,647 |
-1.1 |
$396,137,311 |
0.6 |
$715 |
1.7 |
| 2009Q2 |
43,238 |
-2.3 |
$405,603,910 |
-0.1 |
$722 |
2.2 |
| 2009Q3 |
43,402 |
-2.1 |
$416,803,629 |
0.6 |
$739 |
2.7 |
| 2009Q4 |
42,883 |
-2.9 |
$433,407,413 |
0.3 |
$777 |
3.3 |
| 2010Q1 |
41,476 |
-2.7 |
$388,069,926 |
-2.0 |
$720 |
0.7 |
| 2010Q2 |
42,527 |
-1.6 |
$410,918,086 |
1.3 |
$743 |
3.0 |
| 2010Q3 |
42,987 |
-1.0 |
$417,109,401 |
0.1 |
$746 |
1.0 |
| 2010Q4 |
42,746 |
-0.3 |
$438,684,885 |
1.2 |
$789 |
1.5 |
| 2011Q1 |
41,872 |
1.0 |
$400,301,739 |
3.2 |
$735 |
2.2 |
| 2011Q2 |
43,370 |
2.0 |
$428,515,956 |
4.3 |
$760 |
2.3 |
| 2011Q3 |
43,566 |
1.3 |
$456,356,981 |
9.4 |
$806 |
8.0 |
| 2011Q4 |
43,584 |
2.0 |
$448,882,945 |
2.3 |
$792 |
0.4 |
| 2012Q1 |
42,781 |
2.2 |
$439,717,883 |
9.8 |
$791 |
7.5 |
| 2012Q2 |
43,810 |
1.0 |
$437,327,785 |
2.1 |
$768 |
1.0 |
| 2012Q3 |
44,057 |
1.1 |
$456,020,440 |
-0.1 |
$796 |
-1.2 |
| 2012Q4 |
44,333 |
1.7 |
$499,878,496 |
11.4 |
$867 |
9.5 |
| 2013Q1 |
43,476 |
1.6 |
$462,507,155 |
5.2 |
$818 |
3.5 |
| 2013Q2 |
45,304 |
3.4 |
$460,124,466 |
5.2 |
$781 |
1.7 |
| 2013Q3 |
45,675 |
3.7 |
$483,413,528 |
6.0 |
$814 |
2.3 |
| 2013Q4 |
45,650 |
3.0 |
$491,794,772 |
-1.6 |
$829 |
-4.5 |
| 2014Q1 |
44,678 |
2.8 |
$476,042,879 |
2.9 |
$820 |
0.2 |
| 2014Q2 |
46,093 |
1.7 |
$476,208,184 |
3.5 |
$795 |
1.7 |
| 2014Q3 |
46,342 |
1.5 |
$498,418,780 |
3.1 |
$827 |
1.6 |
| 2014Q4 |
46,427 |
1.7 |
$517,908,255 |
5.3 |
$858 |
3.5 |
| 2015Q1 |
45,467 |
1.8 |
$490,026,898 |
2.9 |
$829 |
1.2 |
| 2015Q2 |
46,416 |
0.7 |
$487,087,059 |
2.3 |
$807 |
1.6 |
| 2015Q3 |
46,425 |
0.2 |
$508,616,849 |
2.0 |
$843 |
1.9 |
| 2015Q4 |
46,198 |
-0.5 |
$532,693,321 |
2.9 |
$887 |
3.4 |
| 2016Q1 |
45,058 |
-0.9 |
$482,731,298 |
-1.5 |
$824 |
-0.6 |
| 2016Q2 |
45,906 |
-1.1 |
$491,931,883 |
1.0 |
$824 |
2.1 |
| 2016Q3 |
45,717 |
-1.5 |
$518,236,091 |
1.9 |
$872 |
3.5 |
| 2016Q4 |
45,686 |
-1.1 |
$521,288,320 |
-2.1 |
$878 |
-1.0 |
| 2017Q1 |
45,141 |
0.2 |
$499,440,595 |
3.5 |
$851 |
3.3 |
| 2017Q2 |
45,647 |
-0.6 |
$512,778,174 |
4.2 |
$864 |
4.8 |
| 2017Q3 |
45,952 |
0.5 |
$516,472,886 |
-0.3 |
$865 |
-0.9 |
| 2017Q4 |
45,646 |
-0.1 |
$544,455,257 |
4.4 |
$918 |
4.5 |
| 2018Q1 |
44,937 |
-0.5 |
$519,078,570 |
3.9 |
$889 |
4.4 |
| 2018Q2 |
45,957 |
0.7 |
$530,640,539 |
3.5 |
$888 |
2.8 |
| 2018Q3 |
46,358 |
0.9 |
$539,077,537 |
4.4 |
$895 |
3.5 |
| 2018Q4 |
46,811 |
2.6 |
$580,520,054 |
6.6 |
$954 |
4.0 |
| 2019Q1 |
46,086 |
2.6 |
$549,409,790 |
5.8 |
$917 |
3.2 |
| 2019Q2 |
46,856 |
2.0 |
$559,360,631 |
5.4 |
$918 |
3.4 |
| 2019Q3 |
47,013 |
1.4 |
$569,704,826 |
5.7 |
$932 |
4.2 |
| 2019Q4 |
47,432 |
1.3 |
$607,260,998 |
4.6 |
$985 |
3.2 |
| 2020Q1 |
46,544 |
1.0 |
$569,333,492 |
3.6 |
$941 |
2.6 |
| 2020Q2 |
44,052 |
-6.0 |
$550,754,424 |
-1.5 |
$962 |
4.7 |
| 2020Q3 |
45,693 |
-2.8 |
$566,629,807 |
-0.5 |
$954 |
2.3 |
| 2020Q4 |
45,977 |
-3.1 |
$628,822,106 |
3.6 |
$1,052 |
6.8 |
| 2021Q1 |
45,098 |
-3.1 |
$547,290,978 |
-3.9 |
$934 |
-0.8 |
| 2021Q2 |
46,334 |
5.2 |
$598,522,666 |
8.7 |
$994 |
3.3 |
| 2021Q3 |
47,040 |
2.9 |
$628,955,437 |
11.0 |
$1,029 |
7.8 |
| 2021Q4 |
47,376 |
3.0 |
$684,608,259 |
8.9 |
$1,112 |
5.7 |
| 2022Q1 |
45,873 |
1.7 |
$615,738,510 |
12.5 |
$1,033 |
10.6 |
| 2022Q2 |
46,346 |
0.0 |
$623,548,843 |
4.2 |
$1,035 |
4.2 |
| 2022Q3 |
46,778 |
-0.6 |
$670,429,985 |
6.6 |
$1,102 |
7.2 |
| 2022Q4 |
46,761 |
-1.3 |
$673,145,615 |
-1.7 |
$1,107 |
-0.4 |
| 2023Q1 |
46,558 |
1.5 |
$666,839,175 |
8.3 |
$1,102 |
6.7 |
| 2023Q2 |
47,636 |
2.8 |
$667,886,231 |
7.1 |
$1,079 |
4.2 |
| 2023Q3 |
47,893 |
2.4 |
$721,217,253 |
7.6 |
$1,158 |
5.1 |
| 2023Q4 |
47,879 |
2.4 |
$733,268,067 |
8.9 |
$1,178 |
6.4 |
| 2024Q1 |
47,340 |
1.7 |
$715,317,823 |
7.3 |
$1,162 |
5.5 |
| 2024Q2 |
48,261 |
1.3 |
$706,441,931 |
5.8 |
$1,126 |
4.4 |
| 2024Q3 |
48,738 |
1.8 |
$749,381,721 |
3.9 |
$1,183 |
2.1 |
| 2024Q4 |
48,675 |
1.7 |
$771,169,441 |
5.2 |
$1,219 |
3.5 |
| 2025Q1 |
48,386 |
2.2 |
$757,168,095 |
5.9 |
$1,204 |
3.6 |
| 2025Q2 |
49,512 |
2.6 |
$755,702,647 |
7.0 |
$1,174 |
4.3 |
| 2025Q3b |
49,453 |
1.5 |
$789,466,060 |
5.3 |
$1,228 |
3.8 |
|
|
|
|
|
|
|
|
|
|
|
|
|
|
| aNorth American Industry Classification System. |
|
|
|
|
| bPreliminary. |
|
|
|
|
|
|
| Source: Quarterly Census of Employment and Wages. |
|
|
|
|
| Prepared by M. Moore, Research & Planning, WY DWS, 4/3/26. |
|
|
|
|
Figure: Average Monthly Employment in Laramie County, 2001Q1-2025Q3
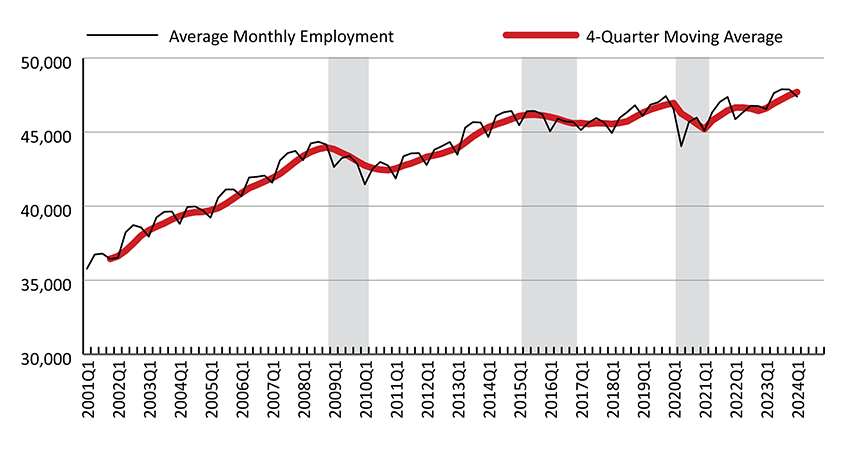
Figure: Over-the-Year Percent Change in Average Monthly Employment and Total Wages in Laramie County, 2002Q1-2025Q3
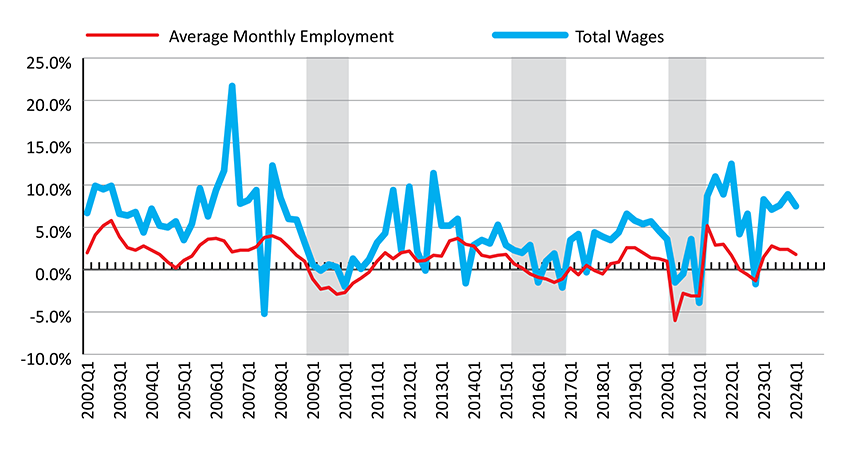
Shaded areas indicate periods of economic downturn: 2009Q1-2010Q1, 2015Q2-2016Q4, and 2020Q2-2021Q1.
Source: Quarterly Census of Employment and Wages.
Prepared by M. Moore, Research & Planning, WY DWS, 4/3/26.
 Hire Wyo