Wyoming QCEW Summary Statistics by County of Employment, 2001-2025
Hot Springs County, 2025Q3
Average Monthly Employment: 1,917
Total Wages: $23,578,472
Average Weekly Wage: $940
Published April 2026.
| Table: Over-the-Year Change in Average Monthly Employment, Total Wages, and Average Weekly Wage in Hot Springs County, WY, 2001Q1-2025Q3 |
| Published April 2026. |
|
|
|
|
|
|
|
|
|
|
|
|
|
Average Monthly Employment |
Total Wages |
Average Weekly Wage |
| Year/Quarter |
N |
% Change |
$ |
% Change |
$ |
% Change |
| 2001Q1 |
1,893 |
|
$9,912,718 |
|
$403 |
|
| 2001Q2 |
2,053 |
|
$10,415,882 |
|
$390 |
|
| 2001Q3 |
2,097 |
|
$10,891,057 |
|
$400 |
|
| 2001Q4 |
2,012 |
|
$12,008,689 |
|
$459 |
|
| 2002Q1 |
1,926 |
1.7 |
$9,940,851 |
0.3 |
$397 |
-1.4 |
| 2002Q2 |
2,030 |
-1.1 |
$10,274,365 |
-1.4 |
$389 |
-0.2 |
| 2002Q3 |
2,014 |
-3.9 |
$10,885,081 |
-0.1 |
$416 |
4.0 |
| 2002Q4 |
1,948 |
-3.2 |
$11,905,358 |
-0.9 |
$470 |
2.4 |
| 2003Q1 |
1,774 |
-7.9 |
$9,430,014 |
-5.1 |
$409 |
3.0 |
| 2003Q2 |
1,924 |
-5.2 |
$9,966,512 |
-3.0 |
$398 |
2.3 |
| 2003Q3 |
1,917 |
-4.8 |
$10,194,392 |
-6.3 |
$409 |
-1.6 |
| 2003Q4 |
1,837 |
-5.7 |
$11,036,656 |
-7.3 |
$462 |
-1.7 |
| 2004Q1 |
1,804 |
1.7 |
$9,476,683 |
0.5 |
$404 |
-1.2 |
| 2004Q2 |
1,926 |
0.1 |
$10,140,672 |
1.7 |
$405 |
1.6 |
| 2004Q3 |
1,899 |
-0.9 |
$10,308,241 |
1.1 |
$417 |
2.1 |
| 2004Q4 |
1,849 |
0.7 |
$11,906,022 |
7.9 |
$495 |
7.2 |
| 2005Q1 |
1,795 |
-0.5 |
$9,958,974 |
5.1 |
$427 |
5.6 |
| 2005Q2 |
1,938 |
0.6 |
$11,102,936 |
9.5 |
$441 |
8.8 |
| 2005Q3 |
1,904 |
0.3 |
$11,536,494 |
11.9 |
$466 |
11.6 |
| 2005Q4 |
1,863 |
0.7 |
$12,877,430 |
8.2 |
$532 |
7.4 |
| 2006Q1 |
1,870 |
4.2 |
$11,147,041 |
11.9 |
$458 |
7.4 |
| 2006Q2 |
1,996 |
3.0 |
$12,274,754 |
10.6 |
$473 |
7.3 |
| 2006Q3 |
1,963 |
3.1 |
$12,443,725 |
7.9 |
$488 |
4.7 |
| 2006Q4 |
1,932 |
3.7 |
$13,998,610 |
8.7 |
$557 |
4.8 |
| 2007Q1 |
1,947 |
4.1 |
$12,793,430 |
14.8 |
$506 |
10.3 |
| 2007Q2 |
2,072 |
3.8 |
$13,806,155 |
12.5 |
$513 |
8.4 |
| 2007Q3 |
2,016 |
2.7 |
$14,167,320 |
13.9 |
$541 |
10.9 |
| 2007Q4 |
2,022 |
4.7 |
$15,885,132 |
13.5 |
$604 |
8.4 |
| 2008Q1 |
2,011 |
3.3 |
$14,216,869 |
11.1 |
$544 |
7.6 |
| 2008Q2 |
2,111 |
1.9 |
$15,457,168 |
12.0 |
$563 |
9.9 |
| 2008Q3 |
2,117 |
5.0 |
$16,219,266 |
14.5 |
$589 |
9.0 |
| 2008Q4 |
2,048 |
1.3 |
$17,478,269 |
10.0 |
$656 |
8.6 |
| 2009Q1 |
2,030 |
0.9 |
$15,001,506 |
5.5 |
$568 |
4.5 |
| 2009Q2 |
2,095 |
-0.8 |
$15,085,405 |
-2.4 |
$554 |
-1.7 |
| 2009Q3 |
2,116 |
0.0 |
$15,646,595 |
-3.5 |
$569 |
-3.5 |
| 2009Q4 |
2,076 |
1.4 |
$16,137,505 |
-7.7 |
$598 |
-8.9 |
| 2010Q1 |
2,066 |
1.8 |
$15,668,659 |
4.4 |
$583 |
2.6 |
| 2010Q2 |
2,166 |
3.4 |
$16,076,037 |
6.6 |
$571 |
3.1 |
| 2010Q3 |
2,177 |
2.9 |
$17,069,771 |
9.1 |
$603 |
6.0 |
| 2010Q4 |
2,108 |
1.5 |
$17,943,331 |
11.2 |
$655 |
9.5 |
| 2011Q1 |
2,085 |
0.9 |
$16,227,033 |
3.6 |
$599 |
2.6 |
| 2011Q2 |
2,176 |
0.5 |
$17,495,669 |
8.8 |
$618 |
8.3 |
| 2011Q3 |
2,189 |
0.5 |
$17,952,134 |
5.2 |
$631 |
4.6 |
| 2011Q4 |
2,135 |
1.3 |
$18,659,078 |
4.0 |
$672 |
2.6 |
| 2012Q1 |
2,092 |
0.4 |
$16,876,619 |
4.0 |
$620 |
3.6 |
| 2012Q2 |
2,184 |
0.3 |
$18,514,942 |
5.8 |
$652 |
5.5 |
| 2012Q3 |
2,174 |
-0.7 |
$17,599,864 |
-2.0 |
$623 |
-1.3 |
| 2012Q4 |
2,110 |
-1.2 |
$19,303,302 |
3.5 |
$704 |
4.7 |
| 2013Q1 |
2,073 |
-0.9 |
$17,226,611 |
2.1 |
$639 |
3.0 |
| 2013Q2 |
2,162 |
-1.0 |
$19,149,340 |
3.4 |
$681 |
4.5 |
| 2013Q3 |
2,188 |
0.6 |
$18,933,645 |
7.6 |
$666 |
6.9 |
| 2013Q4 |
2,087 |
-1.1 |
$20,359,372 |
5.5 |
$751 |
6.7 |
| 2014Q1 |
2,064 |
-0.4 |
$18,012,051 |
4.6 |
$671 |
5.0 |
| 2014Q2 |
2,127 |
-1.6 |
$19,747,999 |
3.1 |
$714 |
4.8 |
| 2014Q3 |
2,112 |
-3.4 |
$19,155,067 |
1.2 |
$698 |
4.8 |
| 2014Q4 |
2,053 |
-1.6 |
$20,921,061 |
2.8 |
$784 |
4.4 |
| 2015Q1 |
1,969 |
-4.6 |
$17,751,210 |
-1.4 |
$693 |
3.3 |
| 2015Q2 |
2,043 |
-3.9 |
$18,061,264 |
-8.5 |
$680 |
-4.8 |
| 2015Q3 |
2,047 |
-3.1 |
$18,022,484 |
-5.9 |
$677 |
-2.9 |
| 2015Q4 |
2,021 |
-1.6 |
$18,988,581 |
-9.2 |
$723 |
-7.8 |
| 2016Q1 |
1,962 |
-0.3 |
$16,207,530 |
-8.7 |
$635 |
-8.4 |
| 2016Q2 |
2,022 |
-1.0 |
$16,710,654 |
-7.5 |
$636 |
-6.5 |
| 2016Q3 |
2,092 |
2.2 |
$18,595,301 |
3.2 |
$684 |
1.0 |
| 2016Q4 |
1,967 |
-2.7 |
$17,263,448 |
-9.1 |
$675 |
-6.6 |
| 2017Q1 |
1,918 |
-2.2 |
$16,242,788 |
0.2 |
$651 |
2.5 |
| 2017Q2 |
1,996 |
-1.3 |
$16,849,755 |
0.8 |
$649 |
2.1 |
| 2017Q3 |
1,981 |
-5.3 |
$17,056,436 |
-8.3 |
$662 |
-3.2 |
| 2017Q4 |
1,907 |
-3.1 |
$18,101,980 |
4.9 |
$730 |
8.2 |
| 2018Q1 |
1,854 |
-3.4 |
$16,519,280 |
1.7 |
$685 |
5.2 |
| 2018Q2 |
1,915 |
-4.0 |
$17,084,231 |
1.4 |
$686 |
5.7 |
| 2018Q3 |
1,893 |
-4.4 |
$17,756,312 |
4.1 |
$721 |
8.9 |
| 2018Q4 |
1,875 |
-1.7 |
$19,335,989 |
6.8 |
$793 |
8.6 |
| 2019Q1 |
1,825 |
-1.6 |
$17,141,351 |
3.8 |
$723 |
5.4 |
| 2019Q2 |
1,868 |
-2.5 |
$16,941,709 |
-0.8 |
$698 |
1.7 |
| 2019Q3 |
1,882 |
-0.6 |
$18,372,471 |
3.5 |
$751 |
4.1 |
| 2019Q4 |
1,866 |
-0.5 |
$19,085,763 |
-1.3 |
$787 |
-0.8 |
| 2020Q1 |
1,834 |
0.5 |
$17,326,247 |
1.1 |
$727 |
0.6 |
| 2020Q2 |
1,770 |
-5.3 |
$16,862,936 |
-0.5 |
$733 |
5.1 |
| 2020Q3 |
1,858 |
-1.3 |
$18,171,364 |
-1.1 |
$752 |
0.2 |
| 2020Q4 |
1,870 |
0.2 |
$19,608,083 |
2.7 |
$807 |
2.5 |
| 2021Q1 |
1,850 |
0.8 |
$17,887,320 |
3.2 |
$744 |
2.4 |
| 2021Q2 |
1,933 |
9.2 |
$19,031,965 |
12.9 |
$757 |
3.3 |
| 2021Q3 |
1,922 |
3.4 |
$20,161,474 |
11.0 |
$807 |
7.3 |
| 2021Q4 |
1,910 |
2.1 |
$22,551,384 |
15.0 |
$908 |
12.6 |
| 2022Q1 |
1,916 |
3.6 |
$19,840,526 |
10.9 |
$797 |
7.1 |
| 2022Q2 |
2,010 |
4.0 |
$21,481,902 |
12.9 |
$822 |
8.5 |
| 2022Q3 |
2,008 |
4.5 |
$22,655,706 |
12.4 |
$868 |
7.6 |
| 2022Q4 |
1,975 |
3.4 |
$24,365,646 |
8.0 |
$949 |
4.5 |
| 2023Q1 |
1,946 |
1.6 |
$21,569,483 |
8.7 |
$852 |
7.0 |
| 2023Q2 |
2,046 |
1.8 |
$22,645,780 |
5.4 |
$851 |
3.6 |
| 2023Q3 |
2,028 |
1.0 |
$22,857,848 |
0.9 |
$867 |
-0.1 |
| 2023Q4 |
1,939 |
-1.8 |
$23,883,086 |
-2.0 |
$948 |
-0.2 |
| 2024Q1 |
1,883 |
-3.3 |
$21,193,780 |
-1.7 |
$866 |
1.6 |
| 2024Q2 |
1,978 |
-3.3 |
$22,248,617 |
-1.8 |
$865 |
1.6 |
| 2024Q3 |
1,930 |
-4.9 |
$22,509,223 |
-1.5 |
$897 |
3.5 |
| 2024Q4 |
1,908 |
-1.6 |
$23,801,797 |
-0.3 |
$960 |
1.3 |
| 2025Q1 |
1,843 |
-2.1 |
$21,509,531 |
1.5 |
$898 |
3.7 |
| 2025Q2 |
1,979 |
0.0 |
$23,507,852 |
5.7 |
$914 |
5.6 |
| 2025Q3b |
1,917 |
-0.7 |
$23,414,220 |
4.0 |
$940 |
4.7 |
|
|
|
|
|
|
|
|
|
|
|
|
|
|
| aNorth American Industry Classification System. |
|
|
|
|
| bPreliminary. |
|
|
|
|
|
|
| Source: Quarterly Census of Employment and Wages. |
|
|
|
|
| Prepared by M. Moore, Research & Planning, WY DWS, 4/3/26. |
|
|
|
|
Figure: Average Monthly Employment in Hot Springs County, 2001Q1-2025Q3

Figure: Over-the-Year Percent Change in Average Monthly Employment and Total Wages in Hot Springs County, 2002Q1-2025Q3
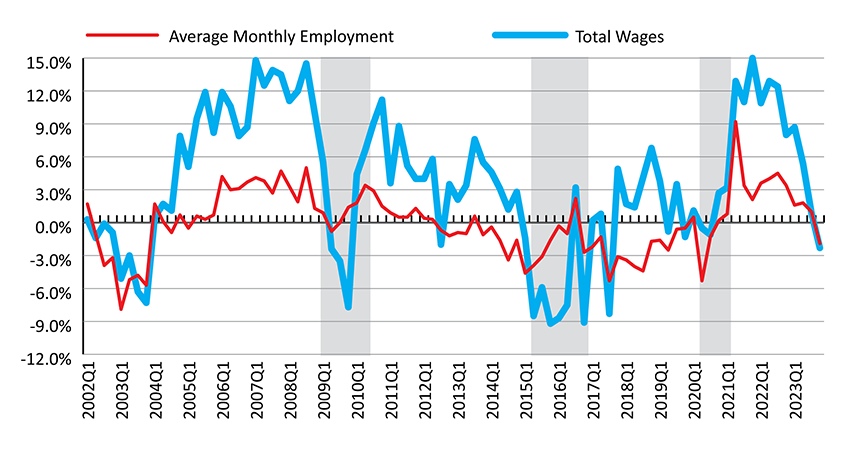
Shaded areas indicate periods of economic downturn: 2009Q1-2010Q1, 2015Q2-2016Q4, and 2020Q2-2021Q1.
Source: Quarterly Census of Employment and Wages.
Prepared by M. Moore, Research & Planning, WY DWS, 4/3/26.
 Hire Wyo