Wyoming QCEW Summary Statistics by County of Employment, 2001-2025
Fremont County, 2025Q3
Average Monthly Employment: 15,529
Total Wages: $203,766,722
Average Weekly Wage: $1,009
Published April 2026.
| Table: Over-the-Year Change in Average Monthly Employment, Total Wages, and Average Weekly Wage in Fremont County, WY, 2001Q1-2025Q3 |
| Published April 2026. |
|
|
|
|
|
|
|
|
|
|
|
|
|
Average Monthly Employment |
Total Wages |
Average Weekly Wage |
| Year/Quarter |
N |
% Change |
$ |
% Change |
$ |
% Change |
| 2001Q1 |
13,645 |
|
$78,830,155 |
|
$444 |
|
| 2001Q2 |
14,404 |
|
$87,392,502 |
|
$467 |
|
| 2001Q3 |
14,574 |
|
$83,563,572 |
|
$441 |
|
| 2001Q4 |
14,957 |
|
$94,252,491 |
|
$485 |
|
| 2002Q1 |
14,420 |
5.7 |
$87,216,837 |
10.6 |
$465 |
4.7 |
| 2002Q2 |
14,985 |
4.0 |
$95,994,679 |
9.8 |
$493 |
5.6 |
| 2002Q3 |
14,763 |
1.3 |
$87,356,582 |
4.5 |
$455 |
3.2 |
| 2002Q4 |
14,589 |
-2.5 |
$92,920,707 |
-1.4 |
$490 |
1.1 |
| 2003Q1 |
13,939 |
-3.3 |
$83,084,417 |
-4.7 |
$459 |
-1.4 |
| 2003Q2 |
14,705 |
-1.9 |
$92,531,319 |
-3.6 |
$484 |
-1.8 |
| 2003Q3 |
14,643 |
-0.8 |
$89,557,528 |
2.5 |
$470 |
3.4 |
| 2003Q4 |
14,562 |
-0.2 |
$96,204,502 |
3.5 |
$508 |
3.7 |
| 2004Q1 |
14,140 |
1.4 |
$89,181,883 |
7.3 |
$485 |
5.8 |
| 2004Q2 |
14,812 |
0.7 |
$99,024,872 |
7.0 |
$514 |
6.2 |
| 2004Q3 |
14,894 |
1.7 |
$96,896,286 |
8.2 |
$500 |
6.4 |
| 2004Q4 |
14,973 |
2.8 |
$103,871,028 |
8.0 |
$534 |
5.0 |
| 2005Q1 |
14,481 |
2.4 |
$97,178,768 |
9.0 |
$516 |
6.4 |
| 2005Q2 |
15,309 |
3.4 |
$106,256,469 |
7.3 |
$534 |
3.8 |
| 2005Q3 |
15,244 |
2.3 |
$107,175,239 |
10.6 |
$541 |
8.1 |
| 2005Q4 |
15,435 |
3.1 |
$114,233,291 |
10.0 |
$569 |
6.7 |
| 2006Q1 |
14,945 |
3.2 |
$109,022,445 |
12.2 |
$561 |
8.7 |
| 2006Q2 |
15,682 |
2.4 |
$119,534,768 |
12.5 |
$586 |
9.8 |
| 2006Q3 |
15,494 |
1.6 |
$117,426,523 |
9.6 |
$583 |
7.8 |
| 2006Q4 |
15,752 |
2.1 |
$131,535,375 |
15.1 |
$642 |
12.8 |
| 2007Q1 |
15,495 |
3.7 |
$121,603,946 |
11.5 |
$604 |
7.6 |
| 2007Q2 |
16,268 |
3.7 |
$141,213,120 |
18.1 |
$668 |
13.9 |
| 2007Q3 |
16,323 |
5.4 |
$129,120,480 |
10.0 |
$608 |
4.4 |
| 2007Q4 |
16,421 |
4.2 |
$145,982,301 |
11.0 |
$684 |
6.5 |
| 2008Q1 |
16,036 |
3.5 |
$132,592,227 |
9.0 |
$636 |
5.4 |
| 2008Q2 |
16,759 |
3.0 |
$145,543,567 |
3.1 |
$668 |
0.1 |
| 2008Q3 |
16,886 |
3.5 |
$142,777,930 |
10.6 |
$650 |
6.9 |
| 2008Q4 |
16,892 |
2.9 |
$159,350,952 |
9.2 |
$726 |
6.1 |
| 2009Q1 |
16,228 |
1.2 |
$138,708,263 |
4.6 |
$657 |
3.4 |
| 2009Q2 |
16,473 |
-1.7 |
$144,458,093 |
-0.7 |
$675 |
1.0 |
| 2009Q3 |
16,511 |
-2.2 |
$138,973,508 |
-2.7 |
$647 |
-0.4 |
| 2009Q4 |
16,297 |
-3.5 |
$150,803,718 |
-5.4 |
$712 |
-1.9 |
| 2010Q1 |
15,772 |
-2.8 |
$137,075,830 |
-1.2 |
$669 |
1.7 |
| 2010Q2 |
16,412 |
-0.4 |
$150,504,032 |
4.2 |
$705 |
4.6 |
| 2010Q3 |
16,780 |
1.6 |
$150,427,260 |
8.2 |
$690 |
6.5 |
| 2010Q4 |
16,797 |
3.1 |
$163,119,468 |
8.2 |
$747 |
4.9 |
| 2011Q1 |
16,104 |
2.1 |
$148,179,541 |
8.1 |
$708 |
5.9 |
| 2011Q2 |
16,670 |
1.6 |
$157,749,732 |
4.8 |
$728 |
3.2 |
| 2011Q3 |
16,838 |
0.3 |
$160,574,038 |
6.7 |
$734 |
6.4 |
| 2011Q4 |
16,948 |
0.9 |
$166,570,347 |
2.1 |
$756 |
1.2 |
| 2012Q1 |
16,347 |
1.5 |
$158,050,218 |
6.7 |
$744 |
5.1 |
| 2012Q2 |
17,016 |
2.1 |
$164,374,289 |
4.2 |
$743 |
2.1 |
| 2012Q3 |
16,908 |
0.4 |
$163,087,956 |
1.6 |
$742 |
1.1 |
| 2012Q4 |
16,921 |
-0.2 |
$171,159,338 |
2.8 |
$778 |
2.9 |
| 2013Q1 |
16,488 |
0.9 |
$159,476,070 |
0.9 |
$744 |
0.0 |
| 2013Q2 |
16,914 |
-0.6 |
$165,935,180 |
0.9 |
$755 |
1.6 |
| 2013Q3 |
16,733 |
-1.0 |
$163,384,876 |
0.2 |
$751 |
1.2 |
| 2013Q4 |
16,755 |
-1.0 |
$175,141,667 |
2.3 |
$804 |
3.3 |
| 2014Q1 |
16,137 |
-2.1 |
$159,709,695 |
0.1 |
$761 |
2.3 |
| 2014Q2 |
16,729 |
-1.1 |
$169,411,234 |
2.1 |
$779 |
3.2 |
| 2014Q3 |
16,585 |
-0.9 |
$163,433,774 |
0.0 |
$758 |
0.9 |
| 2014Q4 |
16,687 |
-0.4 |
$181,119,572 |
3.4 |
$835 |
3.8 |
| 2015Q1 |
15,983 |
-1.0 |
$161,109,215 |
0.9 |
$775 |
1.8 |
| 2015Q2 |
16,420 |
-1.8 |
$166,192,216 |
-1.9 |
$779 |
-0.1 |
| 2015Q3 |
16,280 |
-1.8 |
$156,452,092 |
-4.3 |
$739 |
-2.5 |
| 2015Q4 |
16,304 |
-2.3 |
$170,529,580 |
-5.8 |
$805 |
-3.6 |
| 2016Q1 |
15,314 |
-4.2 |
$145,657,887 |
-9.6 |
$732 |
-5.6 |
| 2016Q2 |
15,707 |
-4.3 |
$154,719,371 |
-6.9 |
$758 |
-2.7 |
| 2016Q3 |
15,526 |
-4.6 |
$148,516,046 |
-5.1 |
$736 |
-0.5 |
| 2016Q4 |
15,622 |
-4.2 |
$157,613,291 |
-7.6 |
$776 |
-3.5 |
| 2017Q1 |
14,988 |
-2.1 |
$146,742,116 |
0.7 |
$753 |
2.9 |
| 2017Q2 |
15,534 |
-1.1 |
$154,103,923 |
-0.4 |
$763 |
0.7 |
| 2017Q3 |
15,447 |
-0.5 |
$148,174,918 |
-0.2 |
$738 |
0.3 |
| 2017Q4 |
15,401 |
-1.4 |
$162,539,306 |
3.1 |
$812 |
4.6 |
| 2018Q1 |
14,843 |
-1.0 |
$151,166,876 |
3.0 |
$783 |
4.0 |
| 2018Q2 |
15,297 |
-1.5 |
$156,921,877 |
1.8 |
$789 |
3.4 |
| 2018Q3 |
15,362 |
-0.6 |
$150,964,266 |
1.9 |
$756 |
2.4 |
| 2018Q4 |
15,135 |
-1.7 |
$166,261,242 |
2.3 |
$845 |
4.1 |
| 2019Q1 |
14,884 |
0.3 |
$153,943,849 |
1.8 |
$796 |
1.6 |
| 2019Q2 |
15,358 |
0.4 |
$161,864,131 |
3.1 |
$811 |
2.7 |
| 2019Q3 |
15,311 |
-0.3 |
$155,464,159 |
3.0 |
$781 |
3.3 |
| 2019Q4 |
15,305 |
1.1 |
$171,196,074 |
3.0 |
$860 |
1.8 |
| 2020Q1 |
14,895 |
0.1 |
$155,475,536 |
1.0 |
$803 |
0.9 |
| 2020Q2 |
14,352 |
-6.5 |
$158,921,402 |
-1.8 |
$852 |
5.1 |
| 2020Q3 |
14,594 |
-4.7 |
$153,570,877 |
-1.2 |
$809 |
3.6 |
| 2020Q4 |
14,706 |
-3.9 |
$172,798,599 |
0.9 |
$904 |
5.0 |
| 2021Q1 |
14,495 |
-2.7 |
$156,563,207 |
0.7 |
$831 |
3.5 |
| 2021Q2 |
15,162 |
5.6 |
$167,389,374 |
5.3 |
$849 |
-0.3 |
| 2021Q3 |
15,201 |
4.2 |
$165,499,954 |
7.8 |
$838 |
3.5 |
| 2021Q4 |
15,129 |
2.9 |
$182,560,268 |
5.6 |
$928 |
2.7 |
| 2022Q1 |
14,844 |
2.4 |
$170,073,748 |
8.6 |
$881 |
6.1 |
| 2022Q2 |
15,443 |
1.9 |
$177,935,997 |
6.3 |
$886 |
4.4 |
| 2022Q3 |
15,401 |
1.3 |
$180,779,292 |
9.2 |
$903 |
7.8 |
| 2022Q4 |
15,431 |
2.0 |
$190,974,348 |
4.6 |
$952 |
2.6 |
| 2023Q1 |
15,080 |
1.6 |
$180,150,547 |
5.9 |
$919 |
4.3 |
| 2023Q2 |
15,802 |
2.3 |
$188,853,081 |
6.1 |
$919 |
3.7 |
| 2023Q3 |
15,782 |
2.5 |
$195,965,140 |
8.4 |
$955 |
5.8 |
| 2023Q4 |
15,747 |
2.0 |
$205,527,872 |
7.6 |
$1,004 |
5.5 |
| 2024Q1 |
15,188 |
0.7 |
$187,784,580 |
4.2 |
$951 |
3.5 |
| 2024Q2 |
15,818 |
0.1 |
$199,112,565 |
5.4 |
$968 |
5.3 |
| 2024Q3 |
15,614 |
-1.1 |
$198,571,139 |
1.3 |
$978 |
2.4 |
| 2024Q4 |
15,610 |
-0.9 |
$233,948,138 |
13.8 |
$1,153 |
14.8 |
| 2025Q1 |
15,180 |
-0.1 |
$191,093,009 |
1.8 |
$968 |
1.8 |
| 2025Q2 |
15,680 |
-0.9 |
$204,321,307 |
2.6 |
$1,002 |
3.5 |
| 2025Q3b |
15,529 |
-0.5 |
$203,766,722 |
2.6 |
$1,009 |
3.2 |
|
|
|
|
|
|
|
|
|
|
|
|
|
|
| aNorth American Industry Classification System. |
|
|
|
|
| bPreliminary. |
|
|
|
|
|
|
| Source: Quarterly Census of Employment and Wages. |
|
|
|
|
| Prepared by M. Moore, Research & Planning, WY DWS, 4/3/26. |
|
|
|
|
Figure: Average Monthly Employment in Fremont County, 2001Q1-2025Q3

Figure: Over-the-Year Percent Change in Average Monthly Employment and Total Wages in Fremont County, 2002Q1-2025Q3
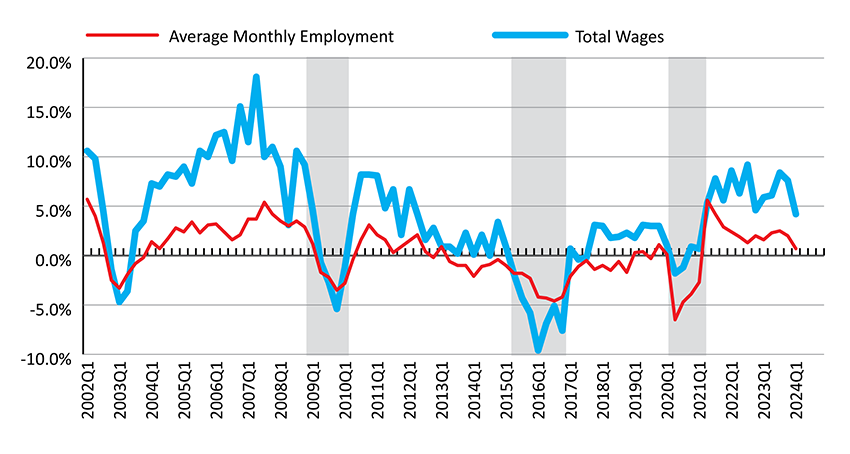
Shaded areas indicate periods of economic downturn: 2009Q1-2010Q1, 2015Q2-2016Q4, and 2020Q2-2021Q1.
Source: Quarterly Census of Employment and Wages.
Prepared by M. Moore, Research & Planning, WY DWS, 4/3/26.
 Hire Wyo