Wyoming QCEW Summary Statistics by County of Employment, 2001-2025
Crook County, 2025Q3
Average Monthly Employment: 2,779
Total Wages: $41,459,245
Average Weekly Wage: $1,148
Published April 2026.
| Table: Over-the-Year Change in Average Monthly Employment, Total Wages, and Average Weekly Wage in Crook County, WY, 2001Q1-2025Q3 |
| Published April 2026. |
|
|
|
|
|
|
|
|
|
|
|
|
|
Average Monthly Employment |
Total Wages |
Average Weekly Wage |
| Year/Quarter |
N |
% Change |
$ |
% Change |
$ |
% Change |
| 2001Q1 |
1,764 |
|
$10,220,412 |
|
$446 |
|
| 2001Q2 |
1,980 |
|
$11,684,316 |
|
$454 |
|
| 2001Q3 |
1,963 |
|
$11,780,244 |
|
$462 |
|
| 2001Q4 |
1,852 |
|
$11,912,077 |
|
$495 |
|
| 2002Q1 |
1,791 |
1.5 |
$11,170,969 |
9.3 |
$480 |
7.7 |
| 2002Q2 |
2,037 |
2.9 |
$12,577,895 |
7.6 |
$475 |
4.6 |
| 2002Q3 |
2,027 |
3.3 |
$12,514,432 |
6.2 |
$475 |
2.9 |
| 2002Q4 |
1,959 |
5.8 |
$12,856,926 |
7.9 |
$505 |
2.0 |
| 2003Q1 |
1,811 |
1.1 |
$11,535,758 |
3.3 |
$490 |
2.1 |
| 2003Q2 |
2,047 |
0.5 |
$12,867,777 |
2.3 |
$483 |
1.8 |
| 2003Q3 |
2,042 |
0.7 |
$12,699,796 |
1.5 |
$478 |
0.8 |
| 2003Q4 |
1,990 |
1.6 |
$13,123,777 |
2.1 |
$507 |
0.5 |
| 2004Q1 |
1,844 |
1.8 |
$11,763,032 |
2.0 |
$491 |
0.1 |
| 2004Q2 |
2,091 |
2.1 |
$13,642,383 |
6.0 |
$502 |
3.8 |
| 2004Q3 |
2,238 |
9.6 |
$14,508,951 |
14.2 |
$499 |
4.2 |
| 2004Q4 |
2,079 |
4.5 |
$14,958,514 |
14.0 |
$553 |
9.1 |
| 2005Q1 |
1,940 |
5.2 |
$13,100,168 |
11.4 |
$519 |
5.8 |
| 2005Q2 |
2,177 |
4.1 |
$15,163,472 |
11.1 |
$536 |
6.8 |
| 2005Q3 |
2,274 |
1.6 |
$15,561,497 |
7.3 |
$526 |
5.5 |
| 2005Q4 |
2,149 |
3.4 |
$16,749,688 |
12.0 |
$600 |
8.3 |
| 2006Q1 |
2,143 |
10.5 |
$15,200,926 |
16.0 |
$546 |
5.0 |
| 2006Q2 |
2,358 |
8.3 |
$17,592,568 |
16.0 |
$574 |
7.1 |
| 2006Q3 |
2,329 |
2.4 |
$17,059,882 |
9.6 |
$563 |
7.0 |
| 2006Q4 |
2,325 |
8.2 |
$19,210,653 |
14.7 |
$636 |
6.0 |
| 2007Q1 |
2,233 |
4.2 |
$17,014,068 |
11.9 |
$586 |
7.4 |
| 2007Q2 |
2,408 |
2.1 |
$19,275,263 |
9.6 |
$616 |
7.3 |
| 2007Q3 |
2,371 |
1.8 |
$18,801,167 |
10.2 |
$610 |
8.3 |
| 2007Q4 |
2,338 |
0.6 |
$20,139,114 |
4.8 |
$663 |
4.3 |
| 2008Q1 |
2,213 |
-0.9 |
$17,354,855 |
2.0 |
$603 |
2.9 |
| 2008Q2 |
2,429 |
0.9 |
$20,212,681 |
4.9 |
$640 |
4.0 |
| 2008Q3 |
2,405 |
1.4 |
$19,526,713 |
3.9 |
$625 |
2.4 |
| 2008Q4 |
2,346 |
0.4 |
$21,441,239 |
6.5 |
$703 |
6.1 |
| 2009Q1 |
2,211 |
-0.1 |
$17,802,075 |
2.6 |
$619 |
2.7 |
| 2009Q2 |
2,358 |
-2.9 |
$19,976,346 |
-1.2 |
$652 |
1.8 |
| 2009Q3 |
2,398 |
-0.3 |
$18,866,235 |
-3.4 |
$605 |
-3.1 |
| 2009Q4 |
2,301 |
-1.9 |
$20,896,657 |
-2.5 |
$699 |
-0.6 |
| 2010Q1 |
2,189 |
-1.0 |
$17,335,747 |
-2.6 |
$609 |
-1.7 |
| 2010Q2 |
2,433 |
3.2 |
$21,032,173 |
5.3 |
$665 |
2.0 |
| 2010Q3 |
2,383 |
-0.6 |
$19,876,382 |
5.4 |
$642 |
6.0 |
| 2010Q4 |
2,336 |
1.5 |
$21,675,014 |
3.7 |
$714 |
2.2 |
| 2011Q1 |
2,198 |
0.4 |
$18,343,606 |
5.8 |
$642 |
5.4 |
| 2011Q2 |
2,377 |
-2.3 |
$21,090,388 |
0.3 |
$682 |
2.6 |
| 2011Q3 |
2,370 |
-0.6 |
$20,784,549 |
4.6 |
$675 |
5.2 |
| 2011Q4 |
2,319 |
-0.7 |
$20,758,857 |
-4.2 |
$688 |
-3.5 |
| 2012Q1 |
2,240 |
1.9 |
$19,527,261 |
6.5 |
$671 |
4.5 |
| 2012Q2 |
2,423 |
1.9 |
$21,452,680 |
1.7 |
$681 |
-0.2 |
| 2012Q3 |
2,376 |
0.3 |
$21,183,137 |
1.9 |
$686 |
1.6 |
| 2012Q4 |
2,320 |
0.0 |
$22,029,565 |
6.1 |
$731 |
6.1 |
| 2013Q1 |
2,232 |
-0.3 |
$20,431,104 |
4.6 |
$704 |
5.0 |
| 2013Q2 |
2,361 |
-2.6 |
$21,376,598 |
-0.4 |
$696 |
2.3 |
| 2013Q3 |
2,317 |
-2.5 |
$22,085,044 |
4.3 |
$733 |
6.9 |
| 2013Q4 |
2,298 |
-0.9 |
$22,290,355 |
1.2 |
$746 |
2.2 |
| 2014Q1 |
2,267 |
1.6 |
$21,241,725 |
4.0 |
$721 |
2.4 |
| 2014Q2 |
2,406 |
1.9 |
$23,479,610 |
9.8 |
$751 |
7.8 |
| 2014Q3 |
2,417 |
4.3 |
$23,153,070 |
4.8 |
$737 |
0.5 |
| 2014Q4 |
2,325 |
1.2 |
$23,458,891 |
5.2 |
$776 |
4.0 |
| 2015Q1 |
2,223 |
-1.9 |
$21,658,781 |
2.0 |
$750 |
4.0 |
| 2015Q2 |
2,403 |
-0.1 |
$23,038,323 |
-1.9 |
$738 |
-1.8 |
| 2015Q3 |
2,408 |
-0.4 |
$24,150,998 |
4.3 |
$772 |
4.7 |
| 2015Q4 |
2,326 |
0.1 |
$25,153,851 |
7.2 |
$832 |
7.2 |
| 2016Q1 |
2,227 |
0.2 |
$21,675,932 |
0.1 |
$749 |
-0.1 |
| 2016Q2 |
2,405 |
0.1 |
$24,034,609 |
4.3 |
$769 |
4.2 |
| 2016Q3 |
2,385 |
-1.0 |
$23,908,533 |
-1.0 |
$771 |
0.0 |
| 2016Q4 |
2,327 |
0.0 |
$24,333,683 |
-3.3 |
$804 |
-3.3 |
| 2017Q1 |
2,166 |
-2.7 |
$21,955,202 |
1.3 |
$780 |
4.1 |
| 2017Q2 |
2,433 |
1.2 |
$25,014,038 |
4.1 |
$791 |
2.9 |
| 2017Q3 |
2,414 |
1.2 |
$24,593,680 |
2.9 |
$784 |
1.6 |
| 2017Q4 |
2,354 |
1.1 |
$26,093,778 |
7.2 |
$853 |
6.0 |
| 2018Q1 |
2,312 |
6.7 |
$24,076,359 |
9.7 |
$801 |
2.8 |
| 2018Q2 |
2,482 |
2.0 |
$27,241,496 |
8.9 |
$844 |
6.7 |
| 2018Q3 |
2,508 |
3.9 |
$27,701,091 |
12.6 |
$850 |
8.4 |
| 2018Q4 |
2,414 |
2.6 |
$28,122,941 |
7.8 |
$896 |
5.1 |
| 2019Q1 |
2,328 |
0.7 |
$24,489,278 |
1.7 |
$809 |
1.0 |
| 2019Q2 |
2,549 |
2.7 |
$29,373,550 |
7.8 |
$887 |
5.0 |
| 2019Q3 |
2,516 |
0.3 |
$29,379,594 |
6.1 |
$898 |
5.7 |
| 2019Q4 |
2,479 |
2.7 |
$29,697,930 |
5.6 |
$921 |
2.8 |
| 2020Q1 |
2,394 |
2.8 |
$27,418,304 |
12.0 |
$881 |
8.9 |
| 2020Q2 |
2,498 |
-2.0 |
$30,122,203 |
2.5 |
$928 |
4.6 |
| 2020Q3 |
2,549 |
1.3 |
$28,432,407 |
-3.2 |
$858 |
-4.5 |
| 2020Q4 |
2,496 |
0.7 |
$31,794,252 |
7.1 |
$980 |
6.3 |
| 2021Q1 |
2,302 |
-3.8 |
$25,721,371 |
-6.2 |
$859 |
-2.4 |
| 2021Q2 |
2,566 |
2.7 |
$30,276,462 |
0.5 |
$908 |
-2.2 |
| 2021Q3 |
2,547 |
-0.1 |
$30,601,293 |
7.6 |
$924 |
7.7 |
| 2021Q4 |
2,500 |
0.1 |
$32,175,481 |
1.2 |
$990 |
1.1 |
| 2022Q1 |
2,411 |
4.7 |
$28,152,859 |
9.5 |
$898 |
4.5 |
| 2022Q2 |
2,663 |
3.8 |
$33,890,773 |
11.9 |
$979 |
7.9 |
| 2022Q3 |
2,635 |
3.5 |
$36,673,452 |
19.8 |
$1,070 |
15.8 |
| 2022Q4 |
2,596 |
3.8 |
$34,186,597 |
6.3 |
$1,013 |
2.3 |
| 2023Q1 |
2,439 |
1.2 |
$32,438,245 |
15.2 |
$1,023 |
13.9 |
| 2023Q2 |
2,699 |
1.4 |
$35,273,298 |
4.1 |
$1,005 |
2.7 |
| 2023Q3 |
2,700 |
2.4 |
$37,328,308 |
1.8 |
$1,064 |
-0.6 |
| 2023Q4 |
2,645 |
1.9 |
$36,965,621 |
8.1 |
$1,075 |
6.1 |
| 2024Q1 |
2,549 |
4.5 |
$35,552,302 |
9.6 |
$1,073 |
4.9 |
| 2024Q2 |
2,755 |
2.1 |
$37,744,155 |
7.0 |
$1,054 |
4.9 |
| 2024Q3 |
2,775 |
2.8 |
$40,680,669 |
9.0 |
$1,128 |
6.0 |
| 2024Q4 |
2,764 |
4.5 |
$41,804,584 |
13.1 |
$1,163 |
8.2 |
| 2025Q1 |
2,532 |
-0.7 |
$36,710,980 |
3.3 |
$1,115 |
4.0 |
| 2025Q2 |
2,819 |
2.3 |
$41,004,675 |
8.6 |
$1,119 |
6.2 |
| 2025Q3b |
2,779 |
0.1 |
$41,459,245 |
1.9 |
$1,148 |
1.8 |
|
|
|
|
|
|
|
|
|
|
|
|
|
|
| aNorth American Industry Classification System. |
|
|
|
|
| bPreliminary. |
|
|
|
|
|
|
| Source: Quarterly Census of Employment and Wages. |
|
|
|
|
| Prepared by M. Moore, Research & Planning, WY DWS, 4/3/26. |
|
|
|
|
Figure: Average Monthly Employment in Crook County, 2001Q1-2025Q3

Figure: Over-the-Year Percent Change in Average Monthly Employment and Total Wages in Crook County, 2002Q1-2025Q3
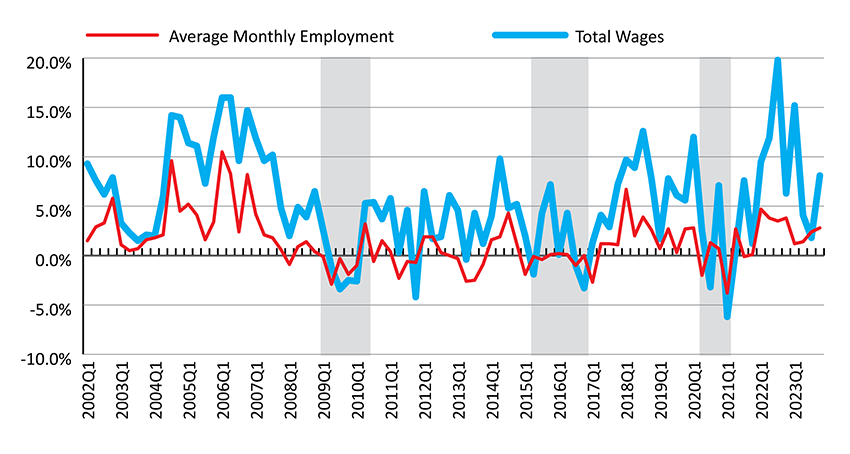
Shaded areas indicate periods of economic downturn: 2009Q1-2010Q1, 2015Q2-2016Q4, and 2020Q2-2021Q1.
Source: Quarterly Census of Employment and Wages.
Prepared by M. Moore, Research & Planning, WY DWS, 4/3/26.
 Hire Wyo