Wyoming QCEW Summary Statistics by County of Employment, 2001-2025
Converse County, 2025Q3
Average Monthly Employment: 6,514
Total Wages: $105,678,862
Average Weekly Wage: $1,248
Published April 2026.
| Table: Over-the-Year Change in Average Monthly Employment, Total Wages, and Average Weekly Wage in Converse County, WY, 2001Q1-2025Q3 |
| Published April 2026. |
|
|
|
|
|
|
|
|
|
|
|
|
|
Average Monthly Employment |
Total Wages |
Average Weekly Wage |
| Year/Quarter |
N |
% Change |
$ |
% Change |
$ |
% Change |
| 2001Q1 |
4,273 |
|
$27,956,072 |
|
$503 |
|
| 2001Q2 |
4,333 |
|
$30,496,693 |
|
$541 |
|
| 2001Q3 |
4,340 |
|
$28,072,819 |
|
$498 |
|
| 2001Q4 |
4,339 |
|
$30,760,137 |
|
$545 |
|
| 2002Q1 |
4,054 |
-5.1 |
$24,538,126 |
-12.2 |
$466 |
-7.5 |
| 2002Q2 |
4,299 |
-0.8 |
$29,805,744 |
-2.3 |
$533 |
-1.5 |
| 2002Q3 |
4,245 |
-2.2 |
$27,279,114 |
-2.8 |
$494 |
-0.7 |
| 2002Q4 |
4,212 |
-2.9 |
$28,995,896 |
-5.7 |
$530 |
-2.9 |
| 2003Q1 |
4,193 |
3.4 |
$29,778,604 |
21.4 |
$546 |
17.3 |
| 2003Q2 |
4,497 |
4.6 |
$35,301,675 |
18.4 |
$604 |
13.2 |
| 2003Q3 |
4,456 |
5.0 |
$32,324,072 |
18.5 |
$558 |
12.9 |
| 2003Q4 |
4,521 |
7.3 |
$35,221,953 |
21.5 |
$599 |
13.2 |
| 2004Q1 |
4,358 |
3.9 |
$32,422,199 |
8.9 |
$572 |
4.8 |
| 2004Q2 |
4,628 |
2.9 |
$36,477,417 |
3.3 |
$606 |
0.4 |
| 2004Q3 |
4,502 |
1.0 |
$34,177,775 |
5.7 |
$584 |
4.7 |
| 2004Q4 |
4,593 |
1.6 |
$37,896,514 |
7.6 |
$635 |
5.9 |
| 2005Q1 |
4,472 |
2.6 |
$32,935,868 |
1.6 |
$567 |
-1.0 |
| 2005Q2 |
4,843 |
4.6 |
$40,892,306 |
12.1 |
$649 |
7.1 |
| 2005Q3 |
4,779 |
6.2 |
$38,565,342 |
12.8 |
$621 |
6.3 |
| 2005Q4 |
4,783 |
4.1 |
$40,097,994 |
5.8 |
$645 |
1.6 |
| 2006Q1 |
4,706 |
5.2 |
$38,321,186 |
16.4 |
$626 |
10.6 |
| 2006Q2 |
4,862 |
0.4 |
$43,625,518 |
6.7 |
$690 |
6.3 |
| 2006Q3 |
4,817 |
0.8 |
$39,405,989 |
2.2 |
$629 |
1.4 |
| 2006Q4 |
4,761 |
-0.5 |
$46,142,568 |
15.1 |
$745 |
15.6 |
| 2007Q1 |
4,714 |
0.2 |
$41,867,729 |
9.3 |
$683 |
9.1 |
| 2007Q2 |
4,937 |
1.5 |
$46,846,027 |
7.4 |
$730 |
5.8 |
| 2007Q3 |
4,994 |
3.7 |
$44,898,073 |
13.9 |
$692 |
9.9 |
| 2007Q4 |
5,242 |
10.1 |
$54,902,674 |
19.0 |
$806 |
8.1 |
| 2008Q1 |
5,264 |
11.7 |
$50,832,947 |
21.4 |
$743 |
8.7 |
| 2008Q2 |
5,473 |
10.9 |
$56,933,841 |
21.5 |
$800 |
9.6 |
| 2008Q3 |
5,506 |
10.2 |
$56,335,164 |
25.5 |
$787 |
13.8 |
| 2008Q4 |
5,403 |
3.1 |
$61,711,080 |
12.4 |
$879 |
9.0 |
| 2009Q1 |
5,212 |
-1.0 |
$52,446,897 |
3.2 |
$774 |
4.2 |
| 2009Q2 |
5,447 |
-0.5 |
$59,220,148 |
4.0 |
$836 |
4.5 |
| 2009Q3 |
5,338 |
-3.1 |
$53,268,900 |
-5.4 |
$768 |
-2.5 |
| 2009Q4 |
5,483 |
1.5 |
$63,813,745 |
3.4 |
$895 |
1.9 |
| 2010Q1 |
5,396 |
3.5 |
$55,218,749 |
5.3 |
$787 |
1.7 |
| 2010Q2 |
5,512 |
1.2 |
$60,516,237 |
2.2 |
$844 |
1.0 |
| 2010Q3 |
5,429 |
1.7 |
$54,730,950 |
2.7 |
$776 |
1.0 |
| 2010Q4 |
5,411 |
-1.3 |
$60,724,492 |
-4.8 |
$863 |
-3.6 |
| 2011Q1 |
5,299 |
-1.8 |
$55,851,391 |
1.1 |
$811 |
3.0 |
| 2011Q2 |
5,513 |
0.0 |
$61,049,576 |
0.9 |
$852 |
0.9 |
| 2011Q3 |
5,537 |
2.0 |
$60,100,058 |
9.8 |
$835 |
7.7 |
| 2011Q4 |
5,753 |
6.3 |
$65,041,008 |
7.1 |
$870 |
0.7 |
| 2012Q1 |
5,732 |
8.2 |
$61,889,784 |
10.8 |
$831 |
2.4 |
| 2012Q2 |
5,981 |
8.5 |
$68,556,028 |
12.3 |
$882 |
3.5 |
| 2012Q3 |
5,881 |
6.2 |
$64,846,346 |
7.9 |
$848 |
1.6 |
| 2012Q4 |
6,036 |
4.9 |
$72,208,963 |
11.0 |
$920 |
5.8 |
| 2013Q1 |
5,982 |
4.4 |
$66,095,825 |
6.8 |
$850 |
2.3 |
| 2013Q2 |
6,165 |
3.1 |
$70,512,149 |
2.9 |
$880 |
-0.2 |
| 2013Q3 |
6,027 |
2.5 |
$68,406,429 |
5.5 |
$873 |
2.9 |
| 2013Q4 |
6,253 |
3.6 |
$76,553,297 |
6.0 |
$942 |
2.3 |
| 2014Q1 |
6,270 |
4.8 |
$73,725,195 |
11.5 |
$904 |
6.4 |
| 2014Q2 |
6,548 |
6.2 |
$79,119,771 |
12.2 |
$929 |
5.6 |
| 2014Q3 |
6,464 |
7.2 |
$79,421,103 |
16.1 |
$945 |
8.3 |
| 2014Q4 |
6,674 |
6.7 |
$88,059,242 |
15.0 |
$1,015 |
7.8 |
| 2015Q1 |
6,453 |
2.9 |
$79,742,458 |
8.2 |
$951 |
5.1 |
| 2015Q2 |
6,608 |
0.9 |
$84,635,992 |
7.0 |
$985 |
6.0 |
| 2015Q3 |
6,374 |
-1.4 |
$78,706,621 |
-0.9 |
$950 |
0.5 |
| 2015Q4 |
6,406 |
-4.0 |
$89,418,516 |
1.5 |
$1,074 |
5.8 |
| 2016Q1 |
6,013 |
-6.8 |
$69,259,094 |
-13.1 |
$886 |
-6.8 |
| 2016Q2 |
5,892 |
-10.8 |
$75,976,708 |
-10.2 |
$992 |
0.7 |
| 2016Q3 |
5,624 |
-11.8 |
$69,324,001 |
-11.9 |
$948 |
-0.2 |
| 2016Q4 |
5,626 |
-12.2 |
$72,265,410 |
-19.2 |
$988 |
-8.0 |
| 2017Q1 |
5,529 |
-8.0 |
$67,748,132 |
-2.2 |
$943 |
6.4 |
| 2017Q2 |
5,709 |
-3.1 |
$73,190,155 |
-3.7 |
$986 |
-0.6 |
| 2017Q3 |
5,531 |
-1.7 |
$66,907,149 |
-3.5 |
$931 |
-1.9 |
| 2017Q4 |
5,667 |
0.7 |
$77,771,827 |
7.6 |
$1,056 |
6.8 |
| 2018Q1 |
5,579 |
0.9 |
$71,268,541 |
5.2 |
$983 |
4.2 |
| 2018Q2 |
5,825 |
2.0 |
$77,604,602 |
6.0 |
$1,025 |
3.9 |
| 2018Q3 |
5,949 |
7.6 |
$77,875,578 |
16.4 |
$1,007 |
8.2 |
| 2018Q4 |
6,454 |
13.9 |
$92,348,793 |
18.7 |
$1,101 |
4.3 |
| 2019Q1 |
6,785 |
21.6 |
$91,673,604 |
28.6 |
$1,039 |
5.8 |
| 2019Q2 |
7,241 |
24.3 |
$101,944,786 |
31.4 |
$1,083 |
5.7 |
| 2019Q3 |
7,644 |
28.5 |
$114,354,669 |
46.8 |
$1,151 |
14.3 |
| 2019Q4 |
7,714 |
19.5 |
$123,372,313 |
33.6 |
$1,230 |
11.8 |
| 2020Q1 |
7,234 |
6.6 |
$105,649,188 |
15.2 |
$1,123 |
8.1 |
| 2020Q2 |
6,109 |
-15.6 |
$86,210,152 |
-15.4 |
$1,086 |
0.2 |
| 2020Q3 |
5,691 |
-25.6 |
$84,769,806 |
-25.9 |
$1,146 |
-0.4 |
| 2020Q4 |
5,699 |
-26.1 |
$83,947,543 |
-32.0 |
$1,133 |
-7.9 |
| 2021Q1 |
5,581 |
-22.8 |
$71,403,959 |
-32.4 |
$984 |
-12.4 |
| 2021Q2 |
5,864 |
-4.0 |
$85,602,069 |
-0.7 |
$1,123 |
3.4 |
| 2021Q3 |
5,875 |
3.2 |
$83,394,648 |
-1.6 |
$1,092 |
-4.7 |
| 2021Q4 |
6,133 |
7.6 |
$98,994,930 |
17.9 |
$1,242 |
9.6 |
| 2022Q1 |
5,976 |
7.1 |
$84,009,992 |
17.7 |
$1,081 |
9.9 |
| 2022Q2 |
6,108 |
4.2 |
$93,993,284 |
9.8 |
$1,184 |
5.4 |
| 2022Q3 |
6,205 |
5.6 |
$92,771,796 |
11.2 |
$1,150 |
5.3 |
| 2022Q4 |
6,266 |
2.2 |
$101,300,441 |
2.3 |
$1,244 |
0.2 |
| 2023Q1 |
6,084 |
1.8 |
$93,645,840 |
11.5 |
$1,184 |
9.5 |
| 2023Q2 |
6,200 |
1.5 |
$96,033,883 |
2.2 |
$1,191 |
0.6 |
| 2023Q3 |
6,201 |
-0.1 |
$91,792,749 |
-1.1 |
$1,139 |
-1.0 |
| 2023Q4 |
6,254 |
-0.2 |
$104,814,861 |
3.5 |
$1,289 |
3.7 |
| 2024Q1 |
6,236 |
2.5 |
$103,658,285 |
10.7 |
$1,279 |
8.0 |
| 2024Q2 |
6,372 |
2.8 |
$104,543,930 |
8.9 |
$1,262 |
5.9 |
| 2024Q3 |
6,391 |
3.1 |
$99,913,662 |
8.8 |
$1,203 |
5.6 |
| 2024Q4 |
6,291 |
0.6 |
$109,925,799 |
4.9 |
$1,344 |
4.3 |
| 2025Q1 |
6,275 |
0.6 |
$106,705,380 |
2.9 |
$1,308 |
2.3 |
| 2025Q2 |
6,462 |
1.4 |
$106,709,294 |
2.1 |
$1,270 |
0.7 |
| 2025Q3b |
6,514 |
1.9 |
$105,678,862 |
5.8 |
$1,248 |
3.8 |
|
|
|
|
|
|
|
|
|
|
|
|
|
|
| aNorth American Industry Classification System. |
|
|
|
|
| bPreliminary. |
|
|
|
|
|
|
| Source: Quarterly Census of Employment and Wages. |
|
|
|
|
| Prepared by M. Moore, Research & Planning, WY DWS, 4/3/26. |
|
|
|
|
Figure: Average Monthly Employment in Converse County, 2001Q1-2025Q3

Figure: Over-the-Year Percent Change in Average Monthly Employment and Total Wages in Converse County, 2002Q1-2025Q3
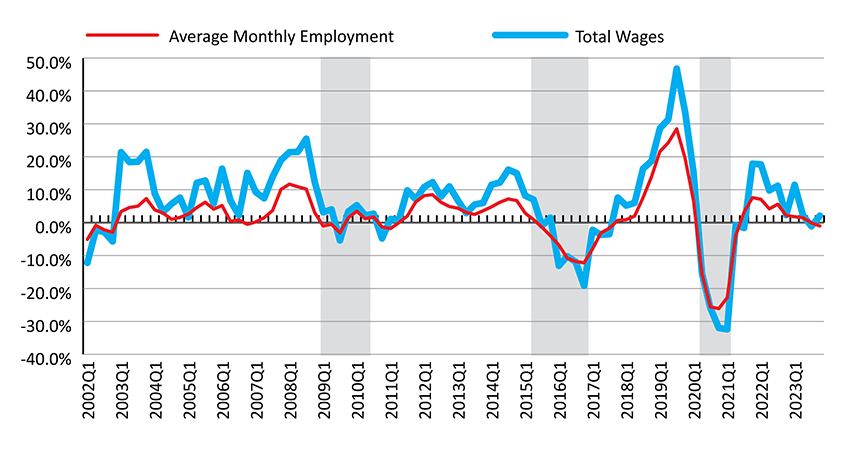
Shaded areas indicate periods of economic downturn: 2009Q1-2010Q1, 2015Q2-2016Q4, and 2020Q2-2021Q1.
Source: Quarterly Census of Employment and Wages.
Prepared by M. Moore, Research & Planning, WY DWS, 4/3/26.
 Hire Wyo