Wyoming QCEW Summary Statistics by County of Employment, 2001-2025
Carbon County, 2025Q3
Average Monthly Employment: 6,605
Total Wages: $98,366,831
Average Weekly Wage: $1,107
Published April 2026.
| Table: Over-the-Year Change in Average Monthly Employment, Total Wages, and Average Weekly Wage in Carbon County, WY, 2001Q1-2025Q3 |
| Published April 2026. |
|
|
|
|
|
|
|
|
|
|
|
|
|
Average Monthly Employment |
Total Wages |
Average Weekly Wage |
| Year/Quarter |
N |
% Change |
$ |
% Change |
$ |
% Change |
| 2001Q1 |
5,908 |
|
$36,477,222 |
|
$475 |
|
| 2001Q2 |
6,376 |
|
$39,070,672 |
|
$471 |
|
| 2001Q3 |
6,609 |
|
$39,614,366 |
|
$461 |
|
| 2001Q4 |
6,313 |
|
$41,261,393 |
|
$503 |
|
| 2002Q1 |
5,988 |
1.4 |
$37,475,098 |
2.7 |
$481 |
1.4 |
| 2002Q2 |
6,455 |
1.2 |
$40,797,474 |
4.4 |
$486 |
3.1 |
| 2002Q3 |
6,643 |
0.5 |
$40,104,006 |
1.2 |
$464 |
0.7 |
| 2002Q4 |
6,283 |
-0.5 |
$41,974,667 |
1.7 |
$514 |
2.2 |
| 2003Q1 |
5,902 |
-1.4 |
$37,348,859 |
-0.3 |
$487 |
1.1 |
| 2003Q2 |
6,332 |
-1.9 |
$40,333,099 |
-1.1 |
$490 |
0.8 |
| 2003Q3 |
6,483 |
-2.4 |
$42,099,299 |
5.0 |
$500 |
7.6 |
| 2003Q4 |
6,189 |
-1.5 |
$41,783,866 |
-0.5 |
$519 |
1.1 |
| 2004Q1 |
5,917 |
0.2 |
$39,722,182 |
6.4 |
$516 |
6.1 |
| 2004Q2 |
6,550 |
3.4 |
$42,608,304 |
5.6 |
$500 |
2.1 |
| 2004Q3 |
6,548 |
1.0 |
$43,846,871 |
4.2 |
$515 |
3.1 |
| 2004Q4 |
6,312 |
2.0 |
$45,442,513 |
8.8 |
$554 |
6.6 |
| 2005Q1 |
6,170 |
4.3 |
$42,284,344 |
6.5 |
$527 |
2.1 |
| 2005Q2 |
6,655 |
1.6 |
$46,438,345 |
9.0 |
$537 |
7.3 |
| 2005Q3 |
6,749 |
3.1 |
$48,764,031 |
11.2 |
$556 |
7.9 |
| 2005Q4 |
6,556 |
3.9 |
$51,319,308 |
12.9 |
$602 |
8.7 |
| 2006Q1 |
6,397 |
3.7 |
$49,134,525 |
16.2 |
$591 |
12.1 |
| 2006Q2 |
6,947 |
4.4 |
$54,543,219 |
17.5 |
$604 |
12.5 |
| 2006Q3 |
7,582 |
12.4 |
$61,636,599 |
26.4 |
$625 |
12.5 |
| 2006Q4 |
7,509 |
14.5 |
$70,048,822 |
36.5 |
$718 |
19.2 |
| 2007Q1 |
7,100 |
11.0 |
$61,891,720 |
26.0 |
$671 |
13.5 |
| 2007Q2 |
7,616 |
9.6 |
$69,807,293 |
28.0 |
$705 |
16.7 |
| 2007Q3 |
7,859 |
3.6 |
$71,499,060 |
16.0 |
$700 |
11.9 |
| 2007Q4 |
8,205 |
9.3 |
$89,771,998 |
28.2 |
$842 |
17.3 |
| 2008Q1 |
7,802 |
9.9 |
$84,234,530 |
36.1 |
$830 |
23.9 |
| 2008Q2 |
7,782 |
2.2 |
$76,343,256 |
9.4 |
$755 |
7.0 |
| 2008Q3 |
7,776 |
-1.1 |
$75,488,280 |
5.6 |
$747 |
6.7 |
| 2008Q4 |
7,430 |
-9.4 |
$81,392,135 |
-9.3 |
$843 |
0.1 |
| 2009Q1 |
6,693 |
-14.2 |
$63,129,731 |
-25.1 |
$726 |
-12.6 |
| 2009Q2 |
6,962 |
-10.5 |
$66,104,633 |
-13.4 |
$730 |
-3.2 |
| 2009Q3 |
7,045 |
-9.4 |
$62,038,003 |
-17.8 |
$677 |
-9.3 |
| 2009Q4 |
6,695 |
-9.9 |
$67,150,369 |
-17.5 |
$771 |
-8.4 |
| 2010Q1 |
6,428 |
-4.0 |
$61,464,590 |
-2.6 |
$736 |
1.4 |
| 2010Q2 |
7,027 |
0.9 |
$69,595,490 |
5.3 |
$762 |
4.3 |
| 2010Q3 |
6,791 |
-3.6 |
$61,335,994 |
-1.1 |
$695 |
2.6 |
| 2010Q4 |
6,685 |
-0.1 |
$69,596,695 |
3.6 |
$801 |
3.8 |
| 2011Q1 |
6,457 |
0.5 |
$62,550,066 |
1.8 |
$745 |
1.3 |
| 2011Q2 |
6,664 |
-5.2 |
$64,933,263 |
-6.7 |
$750 |
-1.6 |
| 2011Q3 |
6,883 |
1.3 |
$66,351,744 |
8.2 |
$742 |
6.7 |
| 2011Q4 |
6,593 |
-1.4 |
$74,068,680 |
6.4 |
$864 |
7.9 |
| 2012Q1 |
6,486 |
0.4 |
$65,913,689 |
5.4 |
$782 |
4.9 |
| 2012Q2 |
7,019 |
5.3 |
$73,275,810 |
12.8 |
$803 |
7.1 |
| 2012Q3 |
7,111 |
3.3 |
$71,650,075 |
8.0 |
$775 |
4.5 |
| 2012Q4 |
6,861 |
4.1 |
$74,483,611 |
0.6 |
$835 |
-3.4 |
| 2013Q1 |
6,662 |
2.7 |
$69,347,583 |
5.2 |
$801 |
2.4 |
| 2013Q2 |
7,333 |
4.5 |
$81,298,684 |
10.9 |
$853 |
6.2 |
| 2013Q3 |
7,339 |
3.2 |
$76,587,253 |
6.9 |
$803 |
3.6 |
| 2013Q4 |
7,287 |
6.2 |
$84,927,122 |
14.0 |
$897 |
7.4 |
| 2014Q1 |
7,080 |
6.3 |
$86,784,241 |
25.1 |
$943 |
17.8 |
| 2014Q2 |
7,547 |
2.9 |
$86,514,650 |
6.4 |
$882 |
3.4 |
| 2014Q3 |
7,404 |
0.9 |
$80,146,016 |
4.6 |
$833 |
3.7 |
| 2014Q4 |
7,290 |
0.1 |
$85,540,254 |
0.7 |
$903 |
0.7 |
| 2015Q1 |
6,817 |
-3.7 |
$80,078,753 |
-7.7 |
$904 |
-4.2 |
| 2015Q2 |
7,413 |
-1.8 |
$82,661,602 |
-4.5 |
$858 |
-2.7 |
| 2015Q3 |
8,134 |
9.9 |
$99,509,074 |
24.2 |
$941 |
13.0 |
| 2015Q4 |
7,257 |
-0.5 |
$86,206,751 |
0.8 |
$914 |
1.2 |
| 2016Q1 |
6,766 |
-0.7 |
$84,702,187 |
5.8 |
$963 |
6.6 |
| 2016Q2 |
7,283 |
-1.8 |
$81,823,216 |
-1.0 |
$864 |
0.8 |
| 2016Q3 |
7,523 |
-7.5 |
$87,618,429 |
-11.9 |
$896 |
-4.8 |
| 2016Q4 |
7,018 |
-3.3 |
$80,378,219 |
-6.8 |
$881 |
-3.6 |
| 2017Q1 |
6,516 |
-3.7 |
$83,632,162 |
-1.3 |
$987 |
2.5 |
| 2017Q2 |
6,945 |
-4.6 |
$77,124,084 |
-5.7 |
$854 |
-1.2 |
| 2017Q3 |
7,004 |
-6.9 |
$73,955,412 |
-15.6 |
$812 |
-9.3 |
| 2017Q4 |
6,668 |
-5.0 |
$76,623,727 |
-4.7 |
$884 |
0.3 |
| 2018Q1 |
6,351 |
-2.5 |
$84,328,048 |
0.8 |
$1,021 |
3.4 |
| 2018Q2 |
6,968 |
0.3 |
$79,494,997 |
3.1 |
$878 |
2.7 |
| 2018Q3 |
7,264 |
3.7 |
$86,655,204 |
17.2 |
$918 |
13.0 |
| 2018Q4 |
6,917 |
3.7 |
$85,888,280 |
12.1 |
$955 |
8.1 |
| 2019Q1 |
6,594 |
3.8 |
$88,128,789 |
4.5 |
$1,028 |
0.7 |
| 2019Q2 |
7,065 |
1.4 |
$83,803,645 |
5.4 |
$912 |
4.0 |
| 2019Q3 |
7,585 |
4.4 |
$90,463,367 |
4.4 |
$917 |
0.0 |
| 2019Q4 |
6,934 |
0.2 |
$88,678,517 |
3.2 |
$984 |
3.0 |
| 2020Q1 |
6,542 |
-0.8 |
$90,369,287 |
2.5 |
$1,063 |
3.4 |
| 2020Q2 |
6,722 |
-4.9 |
$85,990,319 |
2.6 |
$984 |
7.8 |
| 2020Q3 |
7,445 |
-1.9 |
$91,516,310 |
1.2 |
$946 |
3.1 |
| 2020Q4 |
6,879 |
-0.8 |
$93,756,721 |
5.7 |
$1,048 |
6.6 |
| 2021Q1 |
6,423 |
-1.8 |
$88,544,204 |
-2.0 |
$1,060 |
-0.2 |
| 2021Q2 |
7,262 |
8.0 |
$97,409,855 |
13.3 |
$1,032 |
4.9 |
| 2021Q3 |
7,390 |
-0.7 |
$94,104,833 |
2.8 |
$980 |
3.6 |
| 2021Q4 |
6,517 |
-5.3 |
$88,244,824 |
-5.9 |
$1,042 |
-0.7 |
| 2022Q1 |
6,151 |
-4.2 |
$117,782,916 |
33.0 |
$1,473 |
38.9 |
| 2022Q2 |
6,795 |
-6.4 |
$90,641,419 |
-6.9 |
$1,026 |
-0.6 |
| 2022Q3 |
6,758 |
-8.6 |
$89,921,883 |
-4.4 |
$1,024 |
4.5 |
| 2022Q4 |
6,412 |
-1.6 |
$100,560,081 |
14.0 |
$1,206 |
15.8 |
| 2023Q1 |
6,001 |
-2.4 |
$82,435,130 |
-30.0 |
$1,057 |
-28.3 |
| 2023Q2 |
6,625 |
-2.5 |
$89,001,906 |
-1.8 |
$1,033 |
0.7 |
| 2023Q3 |
6,738 |
-0.3 |
$93,418,042 |
3.9 |
$1,066 |
4.2 |
| 2023Q4 |
6,321 |
-1.4 |
$100,829,512 |
0.3 |
$1,227 |
1.7 |
| 2024Q1 |
6,044 |
0.7 |
$86,887,357 |
5.4 |
$1,106 |
4.7 |
| 2024Q2 |
6,693 |
1.0 |
$97,771,610 |
9.9 |
$1,124 |
8.7 |
| 2024Q3 |
6,986 |
3.7 |
$104,886,075 |
12.3 |
$1,155 |
8.3 |
| 2024Q4 |
6,404 |
1.3 |
$104,365,633 |
3.5 |
$1,254 |
2.2 |
| 2025Q1 |
5,972 |
-1.2 |
$86,740,512 |
-0.2 |
$1,117 |
1.0 |
| 2025Q2 |
6,598 |
-1.4 |
$98,372,157 |
0.6 |
$1,147 |
2.1 |
| 2025Q3b |
6,605 |
-5.5 |
$95,028,409 |
-9.4 |
$1,107 |
-4.2 |
|
|
|
|
|
|
|
|
|
|
|
|
|
|
| aNorth American Industry Classification System. |
|
|
|
|
| bPreliminary. |
|
|
|
|
|
|
| Source: Quarterly Census of Employment and Wages. |
|
|
|
|
| Prepared by M. Moore, Research & Planning, WY DWS, 4/3/26. |
|
|
|
|
Figure: Average Monthly Employment in Carbon County, 2001Q1-2025Q3
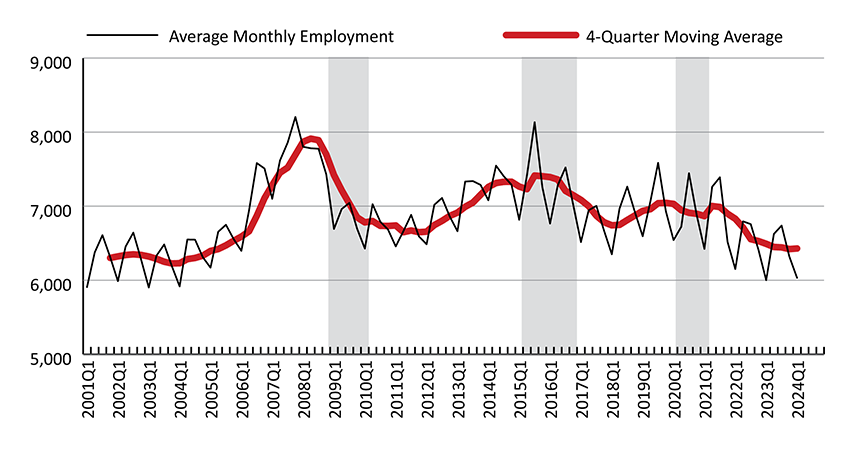
Figure: Over-the-Year Percent Change in Average Monthly Employment and Total Wages in Carbon County, 2002Q1-2025Q3

Shaded areas indicate periods of economic downturn: 2009Q1-2010Q1, 2015Q2-2016Q4, and 2020Q2-2021Q1.
Source: Quarterly Census of Employment and Wages.
Prepared by M. Moore, Research & Planning, WY DWS, 4/3/26.
 Hire Wyo