Wyoming QCEW Summary Statistics by County of Employment, 2001-2025
Campbell County, 2025Q3
Average Monthly Employment: 24,702
Total Wages: $418,759,857
Average Weekly Wage: $1,304
Published April 2026.
| Table: Over-the-Year Change in Average Monthly Employment, Total Wages, and Average Weekly Wage in Campbell County, WY, 2001Q1-2025Q3 |
| Published April 2026. |
|
|
|
|
|
|
|
|
|
|
|
|
|
Average Monthly Employment |
Total Wages |
Average Weekly Wage |
| Year/Quarter |
N |
% Change |
$ |
% Change |
$ |
% Change |
| 2001Q1 |
18,687 |
|
$158,220,893 |
|
$651 |
|
| 2001Q2 |
19,816 |
|
$174,462,229 |
|
$677 |
|
| 2001Q3 |
20,836 |
|
$193,833,979 |
|
$716 |
|
| 2001Q4 |
20,505 |
|
$193,876,064 |
|
$727 |
|
| 2002Q1 |
20,665 |
10.6 |
$191,862,347 |
21.3 |
$714 |
9.7 |
| 2002Q2 |
21,126 |
6.6 |
$189,668,904 |
8.7 |
$691 |
2.0 |
| 2002Q3 |
21,291 |
2.2 |
$198,369,114 |
2.3 |
$717 |
0.2 |
| 2002Q4 |
20,671 |
0.8 |
$203,507,361 |
5.0 |
$757 |
4.1 |
| 2003Q1 |
20,028 |
-3.1 |
$185,678,268 |
-3.2 |
$713 |
-0.1 |
| 2003Q2 |
20,588 |
-2.5 |
$189,961,199 |
0.2 |
$710 |
2.8 |
| 2003Q3 |
21,083 |
-1.0 |
$200,674,953 |
1.2 |
$732 |
2.2 |
| 2003Q4 |
20,923 |
1.2 |
$214,035,062 |
5.2 |
$787 |
3.9 |
| 2004Q1 |
20,638 |
3.0 |
$203,835,130 |
9.8 |
$760 |
6.5 |
| 2004Q2 |
21,561 |
4.7 |
$208,477,423 |
9.7 |
$744 |
4.8 |
| 2004Q3 |
21,604 |
2.5 |
$224,182,768 |
11.7 |
$798 |
9.0 |
| 2004Q4 |
21,619 |
3.3 |
$236,421,410 |
10.5 |
$841 |
6.9 |
| 2005Q1 |
21,907 |
6.1 |
$224,706,177 |
10.2 |
$789 |
3.9 |
| 2005Q2 |
23,044 |
6.9 |
$229,965,900 |
10.3 |
$768 |
3.2 |
| 2005Q3 |
23,637 |
9.4 |
$255,484,569 |
14.0 |
$831 |
4.2 |
| 2005Q4 |
23,962 |
10.8 |
$279,692,506 |
18.3 |
$898 |
6.7 |
| 2006Q1 |
24,450 |
11.6 |
$275,446,564 |
22.6 |
$867 |
9.8 |
| 2006Q2 |
25,746 |
11.7 |
$302,551,076 |
31.6 |
$904 |
17.8 |
| 2006Q3 |
25,812 |
9.2 |
$303,853,856 |
18.9 |
$906 |
8.9 |
| 2006Q4 |
26,369 |
10.0 |
$341,052,772 |
21.9 |
$995 |
10.8 |
| 2007Q1 |
26,623 |
8.9 |
$325,343,074 |
18.1 |
$940 |
8.5 |
| 2007Q2 |
27,277 |
5.9 |
$331,621,131 |
9.6 |
$935 |
3.5 |
| 2007Q3 |
27,285 |
5.7 |
$329,909,734 |
8.6 |
$930 |
2.7 |
| 2007Q4 |
27,877 |
5.7 |
$378,350,357 |
10.9 |
$1,044 |
4.9 |
| 2008Q1 |
28,025 |
5.3 |
$365,769,159 |
12.4 |
$1,004 |
6.8 |
| 2008Q2 |
28,968 |
6.2 |
$375,896,128 |
13.4 |
$998 |
6.7 |
| 2008Q3 |
29,329 |
7.5 |
$376,773,300 |
14.2 |
$988 |
6.2 |
| 2008Q4 |
30,137 |
8.1 |
$423,402,465 |
11.9 |
$1,081 |
3.5 |
| 2009Q1 |
29,106 |
3.9 |
$377,369,450 |
3.2 |
$997 |
-0.7 |
| 2009Q2 |
29,411 |
1.5 |
$375,377,405 |
-0.1 |
$982 |
-1.6 |
| 2009Q3 |
28,545 |
-2.7 |
$368,107,962 |
-2.3 |
$992 |
0.4 |
| 2009Q4 |
28,364 |
-5.9 |
$386,234,681 |
-8.8 |
$1,047 |
-3.1 |
| 2010Q1 |
27,351 |
-6.0 |
$372,038,041 |
-1.4 |
$1,046 |
4.9 |
| 2010Q2 |
27,755 |
-5.6 |
$359,209,563 |
-4.3 |
$996 |
1.4 |
| 2010Q3 |
27,882 |
-2.3 |
$375,698,827 |
2.1 |
$1,037 |
4.5 |
| 2010Q4 |
28,466 |
0.4 |
$421,910,661 |
9.2 |
$1,140 |
8.8 |
| 2011Q1 |
27,109 |
-0.9 |
$378,377,941 |
1.7 |
$1,074 |
2.6 |
| 2011Q2 |
27,518 |
-0.9 |
$369,513,236 |
2.9 |
$1,033 |
3.8 |
| 2011Q3 |
27,168 |
-2.6 |
$375,730,224 |
0.0 |
$1,064 |
2.6 |
| 2011Q4 |
28,033 |
-1.5 |
$397,594,333 |
-5.8 |
$1,091 |
-4.3 |
| 2012Q1 |
27,690 |
2.1 |
$398,153,853 |
5.2 |
$1,106 |
3.0 |
| 2012Q2 |
28,072 |
2.0 |
$377,017,854 |
2.0 |
$1,033 |
0.0 |
| 2012Q3 |
27,499 |
1.2 |
$367,608,803 |
-2.2 |
$1,028 |
-3.3 |
| 2012Q4 |
27,712 |
-1.1 |
$400,218,637 |
0.7 |
$1,111 |
1.8 |
| 2013Q1 |
27,010 |
-2.5 |
$381,971,010 |
-4.1 |
$1,088 |
-1.6 |
| 2013Q2 |
27,392 |
-2.4 |
$376,250,698 |
-0.2 |
$1,057 |
2.3 |
| 2013Q3 |
27,156 |
-1.2 |
$371,814,972 |
1.1 |
$1,053 |
2.4 |
| 2013Q4 |
27,777 |
0.2 |
$405,490,524 |
1.3 |
$1,123 |
1.1 |
| 2014Q1 |
27,529 |
1.9 |
$394,236,145 |
3.2 |
$1,102 |
1.3 |
| 2014Q2 |
28,634 |
4.5 |
$395,763,742 |
5.2 |
$1,063 |
0.6 |
| 2014Q3 |
29,038 |
6.9 |
$413,731,546 |
11.3 |
$1,096 |
4.1 |
| 2014Q4 |
28,807 |
3.7 |
$438,918,788 |
8.2 |
$1,172 |
4.4 |
| 2015Q1 |
28,165 |
2.3 |
$413,364,324 |
4.9 |
$1,129 |
2.5 |
| 2015Q2 |
28,046 |
-2.1 |
$382,967,441 |
-3.2 |
$1,050 |
-1.2 |
| 2015Q3 |
27,943 |
-3.8 |
$390,425,084 |
-5.6 |
$1,075 |
-1.9 |
| 2015Q4 |
27,441 |
-4.7 |
$414,956,034 |
-5.5 |
$1,163 |
-0.8 |
| 2016Q1 |
26,113 |
-7.3 |
$354,055,699 |
-14.3 |
$1,043 |
-7.6 |
| 2016Q2 |
25,151 |
-10.3 |
$330,259,824 |
-13.8 |
$1,010 |
-3.8 |
| 2016Q3 |
24,547 |
-12.2 |
$330,221,094 |
-15.4 |
$1,035 |
-3.7 |
| 2016Q4 |
24,102 |
-12.2 |
$336,959,577 |
-18.8 |
$1,075 |
-7.5 |
| 2017Q1 |
23,754 |
-9.0 |
$330,548,212 |
-6.6 |
$1,070 |
2.6 |
| 2017Q2 |
24,374 |
-3.1 |
$328,263,692 |
-0.6 |
$1,036 |
2.6 |
| 2017Q3 |
24,467 |
-0.3 |
$334,974,388 |
1.4 |
$1,053 |
1.8 |
| 2017Q4 |
24,623 |
2.2 |
$354,868,300 |
5.3 |
$1,109 |
3.1 |
| 2018Q1 |
24,266 |
2.2 |
$354,083,213 |
7.1 |
$1,122 |
4.9 |
| 2018Q2 |
25,049 |
2.8 |
$354,788,374 |
8.1 |
$1,090 |
5.2 |
| 2018Q3 |
24,808 |
1.4 |
$346,668,454 |
3.5 |
$1,075 |
2.1 |
| 2018Q4 |
25,016 |
1.6 |
$375,820,086 |
5.9 |
$1,156 |
4.2 |
| 2019Q1 |
24,619 |
1.5 |
$366,669,450 |
3.6 |
$1,146 |
2.1 |
| 2019Q2 |
25,435 |
1.5 |
$365,829,586 |
3.1 |
$1,106 |
1.5 |
| 2019Q3 |
25,234 |
1.7 |
$361,481,999 |
4.3 |
$1,102 |
2.5 |
| 2019Q4 |
25,424 |
1.6 |
$402,972,284 |
7.2 |
$1,219 |
5.5 |
| 2020Q1 |
24,919 |
1.2 |
$368,650,830 |
0.5 |
$1,138 |
-0.7 |
| 2020Q2 |
23,051 |
-9.4 |
$331,536,088 |
-9.4 |
$1,106 |
0.0 |
| 2020Q3 |
22,667 |
-10.2 |
$317,290,947 |
-12.2 |
$1,077 |
-2.3 |
| 2020Q4 |
22,891 |
-10.0 |
$348,415,302 |
-13.5 |
$1,171 |
-4.0 |
| 2021Q1 |
22,384 |
-10.2 |
$313,943,600 |
-14.8 |
$1,079 |
-5.2 |
| 2021Q2 |
22,937 |
-0.5 |
$324,334,968 |
-2.2 |
$1,088 |
-1.7 |
| 2021Q3 |
22,885 |
1.0 |
$333,991,559 |
5.3 |
$1,123 |
4.3 |
| 2021Q4 |
23,465 |
2.5 |
$374,168,090 |
7.4 |
$1,227 |
4.8 |
| 2022Q1 |
23,349 |
4.3 |
$361,787,527 |
15.2 |
$1,192 |
10.5 |
| 2022Q2 |
24,240 |
5.7 |
$375,036,997 |
15.6 |
$1,190 |
9.4 |
| 2022Q3 |
24,270 |
6.1 |
$393,952,085 |
18.0 |
$1,249 |
11.2 |
| 2022Q4 |
24,562 |
4.7 |
$400,594,796 |
7.1 |
$1,255 |
2.3 |
| 2023Q1 |
24,585 |
5.3 |
$424,307,375 |
17.3 |
$1,328 |
11.4 |
| 2023Q2 |
25,179 |
3.9 |
$401,366,325 |
7.0 |
$1,226 |
3.0 |
| 2023Q3 |
24,832 |
2.3 |
$405,027,676 |
2.8 |
$1,255 |
0.5 |
| 2023Q4 |
25,190 |
2.6 |
$426,754,015 |
6.5 |
$1,303 |
3.9 |
| 2024Q1 |
24,808 |
0.9 |
$422,037,699 |
-0.5 |
$1,309 |
-1.4 |
| 2024Q2 |
25,088 |
-0.4 |
$395,900,215 |
-1.4 |
$1,214 |
-1.0 |
| 2024Q3 |
24,774 |
-0.2 |
$408,394,327 |
0.8 |
$1,268 |
1.1 |
| 2024Q4 |
24,673 |
-2.1 |
$434,161,800 |
1.7 |
$1,354 |
3.9 |
| 2025Q1 |
24,404 |
-1.6 |
$421,016,905 |
-0.2 |
$1,327 |
1.4 |
| 2025Q2 |
24,849 |
-1.0 |
$415,510,079 |
5.0 |
$1,286 |
6.0 |
| 2025Q3b |
24,702 |
-0.3 |
$418,759,857 |
2.5 |
$1,304 |
2.8 |
|
|
|
|
|
|
|
|
|
|
|
|
|
|
| aNorth American Industry Classification System. |
|
|
|
|
| bPreliminary. |
|
|
|
|
|
|
| Source: Quarterly Census of Employment and Wages. |
|
|
|
|
| Prepared by M. Moore, Research & Planning, WY DWS, 4/3/26. |
|
|
|
|
Figure: Average Monthly Employment in Campbell County, 2001Q1-2025Q3
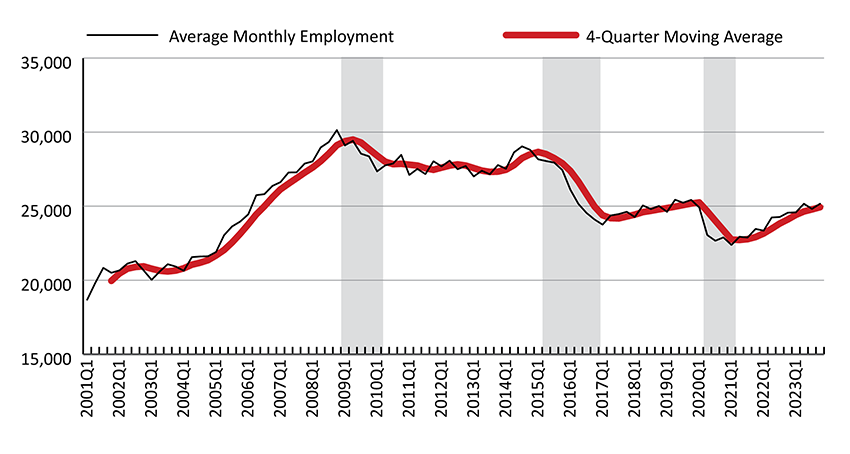
Figure: Over-the-Year Percent Change in Average Monthly Employment and Total Wages in Campbell County, 2002Q1-2025Q3
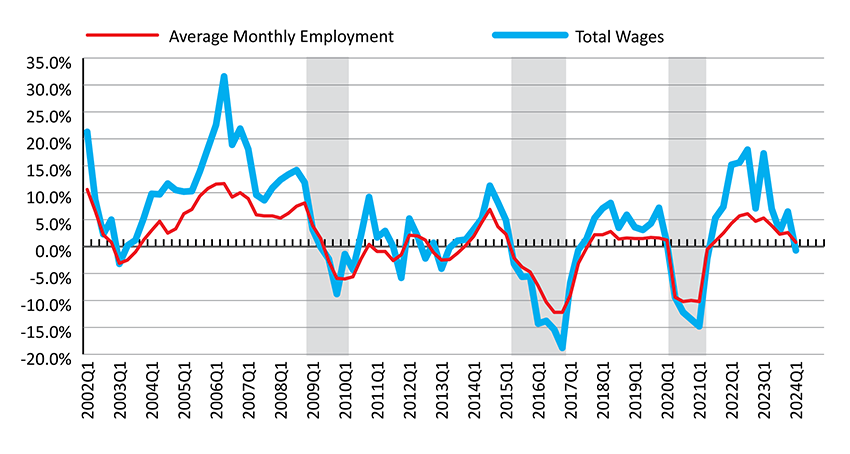
Shaded areas indicate periods of economic downturn: 2009Q1-2010Q1, 2015Q2-2016Q4, and 2020Q2-2021Q1.
Source: Quarterly Census of Employment and Wages.
Prepared by M. Moore, Research & Planning, WY DWS, 4/3/26.
 Hire Wyo