Wyoming QCEW Summary Statistics by County of Employment, 2001-2025
Albany County, 2025Q3
Average Monthly Employment: 17,074
Total Wages: $244,895,456
Average Weekly Wage: $1,103
Published April 2026.
| Table: Over-the-Year Change in Average Monthly Employment, Total Wages, and Average Weekly Wage in Albany County, WY, 2001Q1-2025Q3 |
| Published April 2026. |
|
|
|
|
|
|
|
|
|
|
|
|
|
Average Monthly Employment |
Total Wages |
Average Weekly Wage |
| Year/Quarter |
N |
% Change |
$ |
% Change |
$ |
% Change |
| 2001Q1 |
14,096 |
|
$81,807,594 |
|
$446 |
|
| 2001Q2 |
14,376 |
|
$88,797,040 |
|
$475 |
|
| 2001Q3 |
14,216 |
|
$89,509,464 |
|
$484 |
|
| 2001Q4 |
14,597 |
|
$92,855,966 |
|
$489 |
|
| 2002Q1 |
14,450 |
2.5 |
$91,181,148 |
11.5 |
$485 |
8.7 |
| 2002Q2 |
14,658 |
2.0 |
$93,539,684 |
5.3 |
$491 |
3.3 |
| 2002Q3 |
14,159 |
-0.4 |
$98,775,162 |
10.4 |
$537 |
10.8 |
| 2002Q4 |
14,910 |
2.1 |
$101,004,849 |
8.8 |
$521 |
6.5 |
| 2003Q1 |
14,721 |
1.9 |
$94,597,053 |
3.7 |
$494 |
1.8 |
| 2003Q2 |
14,921 |
1.8 |
$101,681,470 |
8.7 |
$524 |
6.8 |
| 2003Q3 |
14,699 |
3.8 |
$100,448,396 |
1.7 |
$526 |
-2.0 |
| 2003Q4 |
15,388 |
3.2 |
$108,945,119 |
7.9 |
$545 |
4.5 |
| 2004Q1 |
16,557 |
12.5 |
$103,439,837 |
9.3 |
$481 |
-2.8 |
| 2004Q2 |
16,910 |
13.3 |
$113,854,802 |
12.0 |
$518 |
-1.2 |
| 2004Q3 |
16,664 |
13.4 |
$112,430,753 |
11.9 |
$519 |
-1.3 |
| 2004Q4 |
17,028 |
10.7 |
$110,595,232 |
1.5 |
$500 |
-8.3 |
| 2005Q1 |
15,105 |
-8.8 |
$104,328,674 |
0.9 |
$531 |
10.6 |
| 2005Q2 |
15,375 |
-9.1 |
$112,276,765 |
-1.4 |
$562 |
8.5 |
| 2005Q3 |
15,163 |
-9.0 |
$112,928,125 |
0.4 |
$573 |
10.4 |
| 2005Q4 |
15,566 |
-8.6 |
$115,656,749 |
4.6 |
$572 |
14.4 |
| 2006Q1 |
15,038 |
-0.4 |
$107,757,643 |
3.3 |
$551 |
3.7 |
| 2006Q2 |
15,421 |
0.3 |
$117,112,381 |
4.3 |
$584 |
4.0 |
| 2006Q3 |
14,876 |
-1.9 |
$114,646,402 |
1.5 |
$593 |
3.5 |
| 2006Q4 |
15,359 |
-1.3 |
$122,528,177 |
5.9 |
$614 |
7.4 |
| 2007Q1 |
15,222 |
1.2 |
$115,070,553 |
6.8 |
$581 |
5.5 |
| 2007Q2 |
15,589 |
1.1 |
$127,356,003 |
8.7 |
$628 |
7.6 |
| 2007Q3 |
15,127 |
1.7 |
$123,863,391 |
8.0 |
$630 |
6.2 |
| 2007Q4 |
15,567 |
1.4 |
$131,035,371 |
6.9 |
$647 |
5.5 |
| 2008Q1 |
15,362 |
0.9 |
$123,975,736 |
7.7 |
$621 |
6.8 |
| 2008Q2 |
15,765 |
1.1 |
$132,887,225 |
4.3 |
$648 |
3.2 |
| 2008Q3 |
15,398 |
1.8 |
$133,336,958 |
7.6 |
$666 |
5.8 |
| 2008Q4 |
15,884 |
2.0 |
$138,664,961 |
5.8 |
$672 |
3.7 |
| 2009Q1 |
15,555 |
1.3 |
$129,167,377 |
4.2 |
$639 |
2.9 |
| 2009Q2 |
15,735 |
-0.2 |
$137,922,551 |
3.8 |
$674 |
4.0 |
| 2009Q3 |
15,626 |
1.5 |
$138,591,139 |
3.9 |
$682 |
2.4 |
| 2009Q4 |
15,818 |
-0.4 |
$143,761,185 |
3.7 |
$699 |
4.1 |
| 2010Q1 |
15,028 |
-3.4 |
$128,516,135 |
-0.5 |
$658 |
3.0 |
| 2010Q2 |
15,255 |
-3.1 |
$141,114,566 |
2.3 |
$712 |
5.5 |
| 2010Q3 |
15,015 |
-3.9 |
$137,111,504 |
-1.1 |
$702 |
3.0 |
| 2010Q4 |
15,372 |
-2.8 |
$140,859,925 |
-2.0 |
$705 |
0.8 |
| 2011Q1 |
15,019 |
-0.1 |
$131,904,182 |
2.6 |
$676 |
2.7 |
| 2011Q2 |
15,452 |
1.3 |
$143,194,764 |
1.5 |
$713 |
0.2 |
| 2011Q3 |
15,321 |
2.0 |
$143,482,983 |
4.6 |
$720 |
2.6 |
| 2011Q4 |
15,578 |
1.3 |
$152,096,495 |
8.0 |
$751 |
6.6 |
| 2012Q1 |
15,131 |
0.7 |
$134,763,281 |
2.2 |
$685 |
1.4 |
| 2012Q2 |
15,462 |
0.1 |
$145,242,971 |
1.4 |
$723 |
1.4 |
| 2012Q3 |
15,228 |
-0.6 |
$140,026,406 |
-2.4 |
$707 |
-1.8 |
| 2012Q4 |
15,493 |
-0.5 |
$143,123,399 |
-5.9 |
$711 |
-5.4 |
| 2013Q1 |
15,199 |
0.4 |
$136,472,959 |
1.3 |
$691 |
0.8 |
| 2013Q2 |
15,561 |
0.6 |
$145,428,539 |
0.1 |
$719 |
-0.5 |
| 2013Q3 |
15,282 |
0.4 |
$141,102,416 |
0.8 |
$710 |
0.4 |
| 2013Q4 |
15,671 |
1.1 |
$147,364,841 |
3.0 |
$723 |
1.8 |
| 2014Q1 |
15,259 |
0.4 |
$140,026,470 |
2.6 |
$706 |
2.2 |
| 2014Q2 |
15,549 |
-0.1 |
$149,355,734 |
2.7 |
$739 |
2.8 |
| 2014Q3 |
15,405 |
0.8 |
$145,475,047 |
3.1 |
$726 |
2.3 |
| 2014Q4 |
15,519 |
-1.0 |
$147,804,668 |
0.3 |
$733 |
1.3 |
| 2015Q1 |
15,223 |
-0.2 |
$143,240,343 |
2.3 |
$724 |
2.5 |
| 2015Q2 |
15,783 |
1.5 |
$151,926,799 |
1.7 |
$740 |
0.2 |
| 2015Q3 |
15,781 |
2.4 |
$152,788,534 |
5.0 |
$745 |
2.5 |
| 2015Q4 |
15,934 |
2.7 |
$158,321,077 |
7.1 |
$764 |
4.3 |
| 2016Q1 |
15,621 |
2.6 |
$147,568,650 |
3.0 |
$727 |
0.4 |
| 2016Q2 |
16,005 |
1.4 |
$156,650,622 |
3.1 |
$753 |
1.7 |
| 2016Q3 |
15,669 |
-0.7 |
$157,927,913 |
3.4 |
$775 |
4.1 |
| 2016Q4 |
15,662 |
-1.7 |
$153,402,182 |
-3.1 |
$753 |
-1.4 |
| 2017Q1 |
15,263 |
-2.3 |
$147,016,331 |
-0.4 |
$741 |
2.0 |
| 2017Q2 |
15,673 |
-2.1 |
$159,747,827 |
2.0 |
$784 |
4.1 |
| 2017Q3 |
15,422 |
-1.6 |
$156,838,434 |
-0.7 |
$782 |
0.9 |
| 2017Q4 |
15,495 |
-1.1 |
$160,189,372 |
4.4 |
$795 |
5.6 |
| 2018Q1 |
15,231 |
-0.2 |
$150,224,019 |
2.2 |
$759 |
2.4 |
| 2018Q2 |
15,680 |
0.0 |
$158,617,968 |
-0.7 |
$778 |
-0.8 |
| 2018Q3 |
15,511 |
0.6 |
$161,951,414 |
3.3 |
$803 |
2.7 |
| 2018Q4 |
15,699 |
1.3 |
$162,555,001 |
1.5 |
$797 |
0.2 |
| 2019Q1 |
15,359 |
0.8 |
$155,082,198 |
3.2 |
$777 |
2.4 |
| 2019Q2 |
15,757 |
0.5 |
$163,670,908 |
3.2 |
$799 |
2.7 |
| 2019Q3 |
15,707 |
1.3 |
$167,721,077 |
3.6 |
$821 |
2.3 |
| 2019Q4 |
15,871 |
1.1 |
$170,257,333 |
4.7 |
$825 |
3.6 |
| 2020Q1 |
15,527 |
1.1 |
$162,700,627 |
4.9 |
$806 |
3.8 |
| 2020Q2 |
14,801 |
-6.1 |
$167,702,592 |
2.5 |
$872 |
9.1 |
| 2020Q3 |
15,457 |
-1.6 |
$172,236,530 |
2.7 |
$857 |
4.4 |
| 2020Q4 |
15,673 |
-1.2 |
$182,627,425 |
7.3 |
$896 |
8.6 |
| 2021Q1 |
15,557 |
0.2 |
$166,278,825 |
2.2 |
$822 |
2.0 |
| 2021Q2 |
15,967 |
7.9 |
$181,076,218 |
8.0 |
$872 |
0.1 |
| 2021Q3 |
16,192 |
4.8 |
$185,462,433 |
7.7 |
$881 |
2.8 |
| 2021Q4 |
16,326 |
4.2 |
$193,545,068 |
6.0 |
$912 |
1.7 |
| 2022Q1 |
16,387 |
5.3 |
$181,477,506 |
9.1 |
$852 |
3.6 |
| 2022Q2 |
16,557 |
3.7 |
$196,196,606 |
8.4 |
$912 |
4.5 |
| 2022Q3 |
16,619 |
2.6 |
$204,036,672 |
10.0 |
$944 |
7.2 |
| 2022Q4 |
16,783 |
2.8 |
$205,369,879 |
6.1 |
$941 |
3.2 |
| 2023Q1 |
16,495 |
0.7 |
$205,060,225 |
13.0 |
$956 |
12.3 |
| 2023Q2 |
16,722 |
1.0 |
$205,770,907 |
4.9 |
$947 |
3.8 |
| 2023Q3 |
16,641 |
0.1 |
$217,199,625 |
6.5 |
$1,004 |
6.3 |
| 2023Q4 |
16,921 |
0.8 |
$217,274,578 |
5.8 |
$988 |
4.9 |
| 2024Q1 |
16,727 |
1.4 |
$214,241,932 |
4.5 |
$985 |
3.0 |
| 2024Q2 |
17,072 |
2.1 |
$220,874,792 |
7.3 |
$995 |
5.1 |
| 2024Q3 |
16,985 |
2.1 |
$247,344,415 |
13.9 |
$1,120 |
11.6 |
| 2024Q4 |
17,444 |
3.1 |
$235,991,908 |
8.6 |
$1,041 |
5.4 |
| 2025Q1 |
16,888 |
1.0 |
$225,129,810 |
5.1 |
$1,025 |
4.1 |
| 2025Q2 |
17,316 |
1.4 |
$229,881,347 |
4.1 |
$1,021 |
2.6 |
| 2025Q3b |
17,074 |
0.5 |
$244,895,456 |
-1.0 |
$1,103 |
-1.5 |
|
|
|
|
|
|
|
|
|
|
|
|
|
|
| aNorth American Industry Classification System. |
|
|
|
|
| bPreliminary. |
|
|
|
|
|
|
| Source: Quarterly Census of Employment and Wages. |
|
|
|
|
| Prepared by M. Moore, Research & Planning, WY DWS. |
|
|
|
|
Figure: Average Monthly Employment in Albany County, 2001Q1-2025Q3

Figure: Over-the-Year Percent Change in Average Monthly Employment and Total Wages in Albany County, 2002Q1-2025Q3
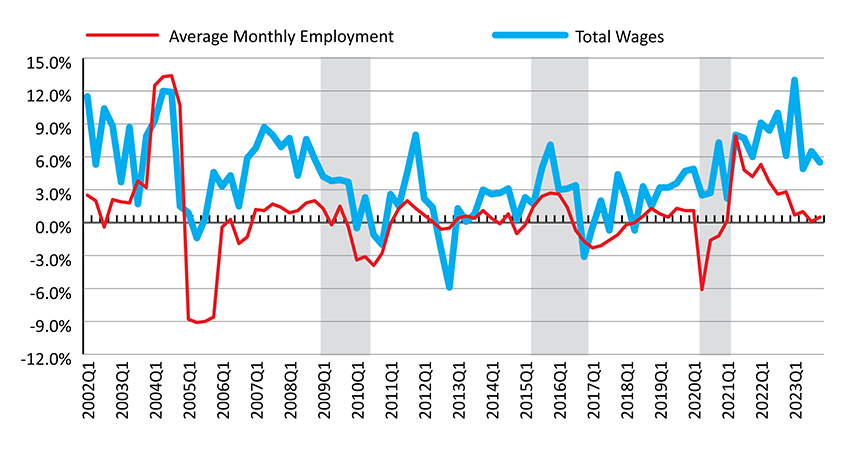
Shaded areas indicate periods of economic downturn: 2009Q1-2010Q1, 2015Q2-2016Q4, and 2020Q2-2021Q1.
Source: Quarterly Census of Employment and Wages.
Prepared by M. Moore, Research & Planning, WY DWS, 4/3/26.
 Hire Wyo