Wyoming QCEW Summary Statistics by Industry, 2001-2025
Wholesale Trade (NAICSa 42), 2025Q3
Average Monthly Employment: 8,049
Total Wages: $161,036,392
Average Weekly Wage: $1,539
aNorth American Industry Classification System.
Published April 2026.
| Table: Over-the-Year Change in Private Wholesale Trade Sector (NAICSa Sector 42) Average Monthly Employment (AME), Total Wages, and Average Weekly Wage (AWW) Changes by Year/Quarter in Wyoming |
| Published April 2026. |
|
|
|
|
|
|
|
|
|
|
|
|
|
Average Monthly Employment |
Total Wages |
Average Weekly Wage |
| Year/Quarter |
N |
% Change |
$ |
% Change |
$ |
% Change |
| 2001Q1 |
6,552 |
|
$59,370,252 |
|
$697 |
|
| 2001Q2 |
6,847 |
|
$58,593,797 |
|
$658 |
|
| 2001Q3 |
6,936 |
|
$62,333,111 |
|
$691 |
|
| 2001Q4 |
6,891 |
|
$69,809,240 |
|
$779 |
|
| 2002Q1 |
6,941 |
5.9 |
$63,492,067 |
6.9 |
$704 |
0.9 |
| 2002Q2 |
7,049 |
3.0 |
$63,571,520 |
8.5 |
$694 |
5.4 |
| 2002Q3 |
7,073 |
2.0 |
$64,450,414 |
3.4 |
$701 |
1.4 |
| 2002Q4 |
7,022 |
1.9 |
$68,114,112 |
-2.4 |
$746 |
-4.3 |
| 2003Q1 |
6,864 |
-1.1 |
$65,266,190 |
2.8 |
$731 |
4.0 |
| 2003Q2 |
6,981 |
-1.0 |
$66,254,536 |
4.2 |
$730 |
5.2 |
| 2003Q3 |
7,088 |
0.2 |
$66,181,213 |
2.7 |
$718 |
2.5 |
| 2003Q4 |
7,078 |
0.8 |
$73,460,562 |
7.8 |
$798 |
7.0 |
| 2004Q1 |
7,170 |
4.5 |
$70,750,173 |
8.4 |
$759 |
3.8 |
| 2004Q2 |
7,380 |
5.7 |
$75,308,571 |
13.7 |
$785 |
7.5 |
| 2004Q3 |
7,435 |
4.9 |
$73,496,796 |
11.1 |
$760 |
5.9 |
| 2004Q4 |
7,391 |
4.4 |
$84,505,008 |
15.0 |
$879 |
10.2 |
| 2005Q1 |
7,390 |
3.1 |
$76,768,780 |
8.5 |
$799 |
5.3 |
| 2005Q2 |
7,758 |
5.1 |
$81,283,441 |
7.9 |
$806 |
2.7 |
| 2005Q3 |
7,904 |
6.3 |
$84,319,370 |
14.7 |
$821 |
7.9 |
| 2005Q4 |
7,939 |
7.4 |
$94,260,208 |
11.5 |
$913 |
3.9 |
| 2006Q1 |
7,883 |
6.7 |
$90,705,470 |
18.2 |
$885 |
10.8 |
| 2006Q2 |
8,216 |
5.9 |
$94,136,438 |
15.8 |
$881 |
9.4 |
| 2006Q3 |
8,320 |
5.3 |
$95,567,819 |
13.3 |
$884 |
7.7 |
| 2006Q4 |
8,369 |
5.4 |
$114,321,589 |
21.3 |
$1,051 |
15.0 |
| 2007Q1 |
8,532 |
8.2 |
$109,100,793 |
20.3 |
$984 |
11.1 |
| 2007Q2 |
8,817 |
7.3 |
$106,515,582 |
13.2 |
$929 |
5.4 |
| 2007Q3 |
8,830 |
6.1 |
$106,413,336 |
11.3 |
$927 |
4.9 |
| 2007Q4 |
8,826 |
5.5 |
$118,971,181 |
4.1 |
$1,037 |
-1.3 |
| 2008Q1 |
8,861 |
3.9 |
$119,547,913 |
9.6 |
$1,038 |
5.5 |
| 2008Q2 |
9,140 |
3.7 |
$115,981,427 |
8.9 |
$976 |
5.0 |
| 2008Q3 |
9,200 |
4.2 |
$120,051,031 |
12.8 |
$1,004 |
8.3 |
| 2008Q4 |
9,212 |
4.4 |
$139,491,747 |
17.2 |
$1,165 |
12.3 |
| 2009Q1 |
8,986 |
1.4 |
$118,980,168 |
-0.5 |
$1,018 |
-1.9 |
| 2009Q2 |
8,841 |
-3.3 |
$109,826,478 |
-5.3 |
$956 |
-2.1 |
| 2009Q3 |
8,598 |
-6.5 |
$108,482,306 |
-9.6 |
$971 |
-3.3 |
| 2009Q4 |
8,391 |
-8.9 |
$121,650,699 |
-12.8 |
$1,115 |
-4.2 |
| 2010Q1 |
8,351 |
-7.1 |
$105,398,787 |
-11.4 |
$971 |
-4.7 |
| 2010Q2 |
8,468 |
-4.2 |
$106,373,986 |
-3.1 |
$966 |
1.1 |
| 2010Q3 |
8,495 |
-1.2 |
$113,267,547 |
4.4 |
$1,026 |
5.7 |
| 2010Q4 |
8,527 |
1.6 |
$133,741,572 |
9.9 |
$1,207 |
8.2 |
| 2011Q1 |
8,590 |
2.9 |
$114,578,082 |
8.7 |
$1,026 |
5.7 |
| 2011Q2 |
8,822 |
4.2 |
$117,007,106 |
10.0 |
$1,020 |
5.6 |
| 2011Q3 |
8,913 |
4.9 |
$124,713,597 |
10.1 |
$1,076 |
4.9 |
| 2011Q4 |
9,004 |
5.6 |
$139,801,918 |
4.5 |
$1,194 |
-1.0 |
| 2012Q1 |
9,066 |
5.5 |
$129,711,931 |
13.2 |
$1,101 |
7.3 |
| 2012Q2 |
9,276 |
5.1 |
$123,877,370 |
5.9 |
$1,027 |
0.7 |
| 2012Q3 |
9,196 |
3.2 |
$127,741,708 |
2.4 |
$1,069 |
-0.7 |
| 2012Q4 |
9,111 |
1.2 |
$146,111,827 |
4.5 |
$1,234 |
3.3 |
| 2013Q1 |
9,068 |
0.0 |
$127,598,682 |
-1.6 |
$1,082 |
-1.7 |
| 2013Q2 |
9,194 |
-0.9 |
$125,441,229 |
1.3 |
$1,049 |
2.2 |
| 2013Q3 |
9,312 |
1.3 |
$130,987,048 |
2.5 |
$1,082 |
1.3 |
| 2013Q4 |
9,428 |
3.5 |
$151,241,945 |
3.5 |
$1,234 |
0.0 |
| 2014Q1 |
9,268 |
2.2 |
$133,399,060 |
4.5 |
$1,107 |
2.3 |
| 2014Q2 |
9,522 |
3.6 |
$136,569,044 |
8.9 |
$1,103 |
5.1 |
| 2014Q3 |
9,585 |
2.9 |
$140,815,223 |
7.5 |
$1,130 |
4.4 |
| 2014Q4 |
9,623 |
2.1 |
$183,427,425 |
21.3 |
$1,466 |
18.8 |
| 2015Q1 |
9,608 |
3.7 |
$142,967,542 |
7.2 |
$1,145 |
3.4 |
| 2015Q2 |
9,609 |
0.9 |
$135,317,981 |
-0.9 |
$1,083 |
-1.8 |
| 2015Q3 |
9,471 |
-1.2 |
$135,872,322 |
-3.5 |
$1,104 |
-2.3 |
| 2015Q4 |
9,329 |
-3.1 |
$150,807,714 |
-17.8 |
$1,244 |
-15.2 |
| 2016Q1 |
8,963 |
-6.7 |
$123,221,087 |
-13.8 |
$1,058 |
-7.6 |
| 2016Q2 |
8,565 |
-10.9 |
$122,042,952 |
-9.8 |
$1,096 |
1.2 |
| 2016Q3 |
8,311 |
-12.2 |
$117,326,311 |
-13.6 |
$1,086 |
-1.6 |
| 2016Q4 |
8,154 |
-12.6 |
$122,546,046 |
-18.7 |
$1,156 |
-7.0 |
| 2017Q1 |
8,035 |
-10.3 |
$115,060,772 |
-6.6 |
$1,101 |
4.2 |
| 2017Q2 |
8,096 |
-5.5 |
$118,915,508 |
-2.6 |
$1,130 |
3.1 |
| 2017Q3 |
8,168 |
-1.7 |
$123,798,926 |
5.5 |
$1,166 |
7.4 |
| 2017Q4 |
8,129 |
-0.3 |
$134,515,081 |
9.8 |
$1,273 |
10.1 |
| 2018Q1 |
8,026 |
-0.1 |
$126,380,138 |
9.8 |
$1,211 |
10.0 |
| 2018Q2 |
8,183 |
1.1 |
$125,212,622 |
5.3 |
$1,177 |
4.2 |
| 2018Q3 |
8,250 |
1.0 |
$126,129,856 |
1.9 |
$1,176 |
0.9 |
| 2018Q4 |
8,333 |
2.5 |
$144,978,370 |
7.8 |
$1,338 |
5.1 |
| 2019Q1 |
8,348 |
4.0 |
$136,032,441 |
7.6 |
$1,253 |
3.5 |
| 2019Q2 |
8,449 |
3.3 |
$136,118,390 |
8.7 |
$1,239 |
5.3 |
| 2019Q3 |
8,423 |
2.1 |
$132,427,290 |
5.0 |
$1,209 |
2.8 |
| 2019Q4 |
8,358 |
0.3 |
$147,960,882 |
2.1 |
$1,362 |
1.8 |
| 2020Q1 |
8,223 |
-1.5 |
$135,124,278 |
-0.7 |
$1,264 |
0.8 |
| 2020Q2 |
7,728 |
-8.5 |
$120,236,065 |
-11.7 |
$1,197 |
-3.4 |
| 2020Q3 |
7,354 |
-12.7 |
$111,285,428 |
-16.0 |
$1,164 |
-3.8 |
| 2020Q4 |
7,322 |
-12.4 |
$130,282,864 |
-11.9 |
$1,369 |
0.5 |
| 2021Q1 |
7,225 |
-12.1 |
$115,627,623 |
-14.4 |
$1,231 |
-2.6 |
| 2021Q2 |
7,348 |
-4.9 |
$117,892,697 |
-1.9 |
$1,234 |
3.1 |
| 2021Q3 |
7,339 |
-0.2 |
$121,062,056 |
8.8 |
$1,269 |
9.0 |
| 2021Q4 |
7,373 |
3.9 |
$140,158,235 |
5.9 |
$1,462 |
2.0 |
| 2022Q1 |
7,508 |
3.9 |
$133,266,075 |
15.3 |
$1,365 |
10.9 |
| 2022Q2 |
7,693 |
4.7 |
$133,837,302 |
13.5 |
$1,338 |
8.4 |
| 2022Q3 |
7,856 |
7.0 |
$143,170,886 |
18.3 |
$1,402 |
10.5 |
| 2022Q4 |
7,903 |
7.2 |
$154,534,022 |
10.3 |
$1,504 |
2.9 |
| 2023Q1 |
7,878 |
4.9 |
$153,419,740 |
15.1 |
$1,498 |
9.7 |
| 2023Q2 |
7,989 |
3.8 |
$144,511,825 |
8.0 |
$1,391 |
4.0 |
| 2023Q3 |
7,994 |
1.8 |
$147,648,742 |
3.1 |
$1,421 |
1.3 |
| 2023Q4 |
7,979 |
1.0 |
$163,805,212 |
6.0 |
$1,579 |
5.0 |
| 2024Q1 |
7,977 |
1.3 |
$161,741,905 |
5.4 |
$1,560 |
4.1 |
| 2024Q2 |
8,052 |
0.8 |
$149,526,570 |
3.5 |
$1,428 |
2.7 |
| 2024Q3 |
8,107 |
1.4 |
$155,578,523 |
5.4 |
$1,476 |
3.9 |
| 2024Q4 |
8,051 |
0.9 |
$168,834,008 |
3.1 |
$1,613 |
2.1 |
| 2025Q1 |
7,877 |
-1.3 |
$161,534,791 |
-0.1 |
$1,577 |
1.1 |
| 2025Q2 |
7,995 |
-0.7 |
$156,080,934 |
4.4 |
$1,502 |
5.1 |
| 2025Q3b |
8,049 |
-0.7 |
$161,036,392 |
3.5 |
$1,539 |
4.3 |
|
|
|
|
|
|
|
|
|
|
|
|
|
|
| aNorth American Industry Classification System. |
|
|
|
|
| bPreliminary. |
|
|
|
|
|
|
| Source: Quarterly Census of Employment and Wages. |
|
|
|
|
| Prepared by M. Moore, Research & Planning, WY DWS, 4/3/26. |
|
|
|
|
Figure: Average Monthly Employment in Wholesale Trade (NAICS 42) in Wyoming, 2001Q1-2025Q3
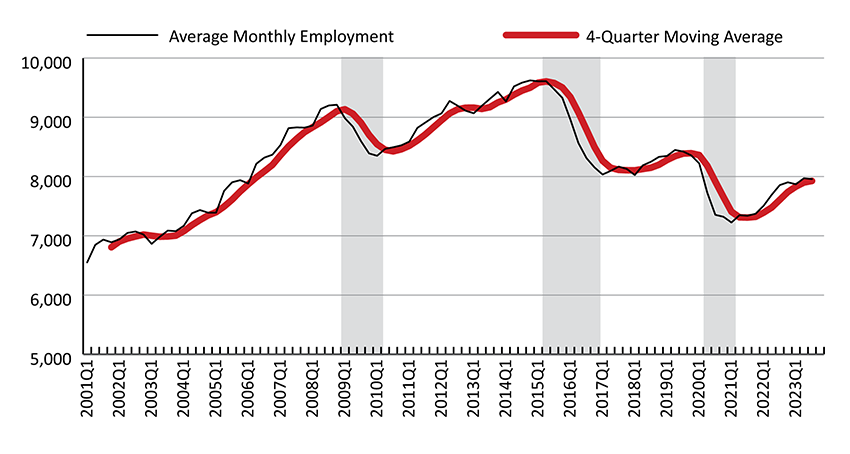
Figure: Over-the-Year Percent Change in Average Monthly Employment and Total Wages in Wholesale Trade (NAICS 42) in Wyoming, 2002Q1-2025Q3
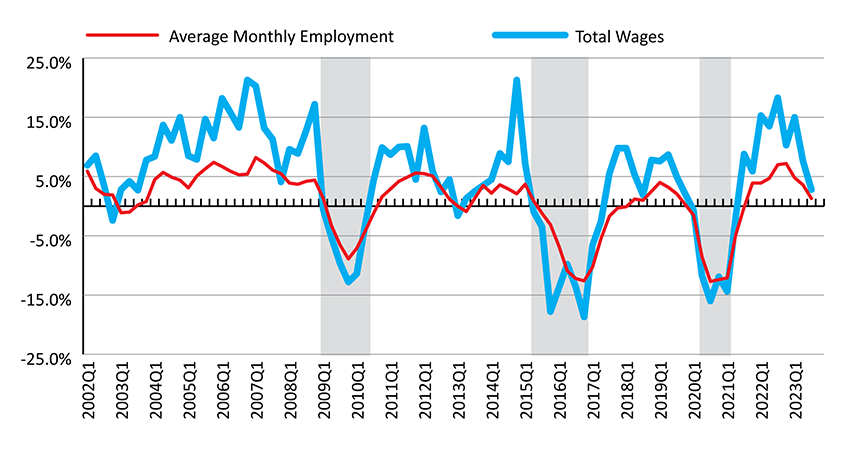
Shaded areas indicate periods of economic downturn: 2009Q1-2010Q1, 2015Q2-2016Q4, and 2020Q2-2021Q1.
Source: Quarterly Census of Employment and Wages.
Prepared by M. Moore, Research & Planning, WY DWS, 4/3/26.
 Hire Wyo