Wyoming QCEW Summary Statistics by Industry, 2001-2025
Retail Trade (NAICSa 44-45), 2025Q3
Average Monthly Employment: 30,874
Total Wages: $303,724,082
Average Weekly Wage: $757
North American Industry Classification System.
Published April 2026.
| Table: Over-the-Year Change in Private Retail Trade Sector (NAICSa Sectors 44-45) Average Monthly Employment (AME), Total Wages, and Average Weekly Wage (AWW) Changes by Year/Quarter in Wyoming |
| Published April 2026. |
|
|
|
|
|
|
|
|
|
|
|
|
|
Average Monthly Employment |
Total Wages |
Average Weekly Wage |
| Year/Quarter |
N |
% Change |
$ |
% Change |
$ |
% Change |
| 2001Q1 |
29,375 |
|
$134,259,646 |
|
$352 |
|
| 2001Q2 |
30,700 |
|
$135,937,638 |
|
$341 |
|
| 2001Q3 |
31,150 |
|
$147,018,232 |
|
$363 |
|
| 2001Q4 |
29,813 |
|
$149,178,054 |
|
$385 |
|
| 2002Q1 |
28,769 |
-2.1 |
$137,451,586 |
2.4 |
$368 |
4.5 |
| 2002Q2 |
30,247 |
-1.5 |
$139,329,383 |
2.5 |
$354 |
4.0 |
| 2002Q3 |
31,212 |
0.2 |
$152,669,409 |
3.8 |
$376 |
3.6 |
| 2002Q4 |
30,404 |
2.0 |
$152,777,227 |
2.4 |
$387 |
0.4 |
| 2003Q1 |
28,475 |
-1.0 |
$140,059,851 |
1.9 |
$378 |
2.9 |
| 2003Q2 |
29,787 |
-1.5 |
$141,787,626 |
1.8 |
$366 |
3.3 |
| 2003Q3 |
31,005 |
-0.7 |
$154,686,990 |
1.3 |
$384 |
2.0 |
| 2003Q4 |
30,216 |
-0.6 |
$157,650,121 |
3.2 |
$401 |
3.8 |
| 2004Q1 |
28,743 |
0.9 |
$144,038,607 |
2.8 |
$385 |
1.9 |
| 2004Q2 |
30,018 |
0.8 |
$148,840,792 |
5.0 |
$381 |
4.2 |
| 2004Q3 |
30,953 |
-0.2 |
$161,284,897 |
4.3 |
$401 |
4.4 |
| 2004Q4 |
30,175 |
-0.1 |
$167,288,334 |
6.1 |
$426 |
6.3 |
| 2005Q1 |
28,872 |
0.4 |
$148,072,907 |
2.8 |
$395 |
2.3 |
| 2005Q2 |
30,257 |
0.8 |
$158,103,857 |
6.2 |
$402 |
5.4 |
| 2005Q3 |
31,495 |
1.7 |
$170,475,706 |
5.7 |
$416 |
3.9 |
| 2005Q4 |
30,787 |
2.0 |
$175,363,623 |
4.8 |
$438 |
2.7 |
| 2006Q1 |
29,681 |
2.8 |
$161,432,269 |
9.0 |
$418 |
6.1 |
| 2006Q2 |
30,665 |
1.4 |
$172,742,088 |
9.3 |
$433 |
7.8 |
| 2006Q3 |
31,818 |
1.0 |
$179,981,265 |
5.6 |
$435 |
4.5 |
| 2006Q4 |
31,335 |
1.8 |
$193,237,725 |
10.2 |
$474 |
8.3 |
| 2007Q1 |
30,907 |
4.1 |
$177,636,308 |
10.0 |
$442 |
5.7 |
| 2007Q2 |
31,666 |
3.3 |
$188,315,854 |
9.0 |
$457 |
5.6 |
| 2007Q3 |
32,936 |
3.5 |
$194,910,466 |
8.3 |
$455 |
4.6 |
| 2007Q4 |
32,452 |
3.6 |
$209,633,737 |
8.5 |
$497 |
4.8 |
| 2008Q1 |
31,421 |
1.7 |
$189,077,091 |
6.4 |
$463 |
4.7 |
| 2008Q2 |
31,940 |
0.9 |
$196,563,895 |
4.4 |
$473 |
3.5 |
| 2008Q3 |
33,046 |
0.3 |
$201,651,173 |
3.5 |
$469 |
3.1 |
| 2008Q4 |
32,251 |
-0.6 |
$209,528,703 |
-0.1 |
$500 |
0.6 |
| 2009Q1 |
30,323 |
-3.5 |
$181,625,208 |
-3.9 |
$461 |
-0.5 |
| 2009Q2 |
30,690 |
-3.9 |
$186,511,072 |
-5.1 |
$467 |
-1.2 |
| 2009Q3 |
31,414 |
-4.9 |
$189,312,821 |
-6.1 |
$464 |
-1.2 |
| 2009Q4 |
30,254 |
-6.2 |
$199,067,962 |
-5.0 |
$506 |
1.3 |
| 2010Q1 |
28,740 |
-5.2 |
$168,056,785 |
-7.5 |
$450 |
-2.4 |
| 2010Q2 |
29,594 |
-3.6 |
$184,542,957 |
-1.1 |
$480 |
2.6 |
| 2010Q3 |
30,146 |
-4.0 |
$193,487,408 |
2.2 |
$494 |
6.5 |
| 2010Q4 |
29,484 |
-2.5 |
$196,122,576 |
-1.5 |
$512 |
1.1 |
| 2011Q1 |
28,096 |
-2.2 |
$177,517,284 |
5.6 |
$486 |
8.1 |
| 2011Q2 |
29,105 |
-1.7 |
$183,037,315 |
-0.8 |
$484 |
0.9 |
| 2011Q3 |
30,106 |
-0.1 |
$199,288,884 |
3.0 |
$509 |
3.1 |
| 2011Q4 |
29,475 |
0.0 |
$195,928,045 |
-0.1 |
$511 |
-0.1 |
| 2012Q1 |
28,300 |
0.7 |
$185,264,048 |
4.4 |
$504 |
3.6 |
| 2012Q2 |
29,390 |
1.0 |
$190,301,691 |
4.0 |
$498 |
3.0 |
| 2012Q3 |
30,265 |
0.5 |
$199,169,941 |
-0.1 |
$506 |
-0.6 |
| 2012Q4 |
29,811 |
1.1 |
$222,224,899 |
13.4 |
$573 |
12.1 |
| 2013Q1 |
28,459 |
0.6 |
$188,179,967 |
1.6 |
$509 |
1.0 |
| 2013Q2 |
29,706 |
1.1 |
$194,908,045 |
2.4 |
$505 |
1.3 |
| 2013Q3 |
30,795 |
1.8 |
$204,879,209 |
2.9 |
$512 |
1.1 |
| 2013Q4 |
30,204 |
1.3 |
$210,996,407 |
-5.1 |
$537 |
-6.3 |
| 2014Q1 |
28,593 |
0.5 |
$191,112,531 |
1.6 |
$514 |
1.1 |
| 2014Q2 |
29,766 |
0.2 |
$198,750,559 |
2.0 |
$514 |
1.8 |
| 2014Q3 |
30,634 |
-0.5 |
$209,944,287 |
2.5 |
$527 |
3.0 |
| 2014Q4 |
30,218 |
0.0 |
$220,266,234 |
4.4 |
$561 |
4.3 |
| 2015Q1 |
29,397 |
2.8 |
$198,606,050 |
3.9 |
$520 |
1.1 |
| 2015Q2 |
30,790 |
3.4 |
$209,635,546 |
5.5 |
$524 |
2.0 |
| 2015Q3 |
31,757 |
3.7 |
$220,836,202 |
5.2 |
$535 |
1.5 |
| 2015Q4 |
31,229 |
3.3 |
$228,870,328 |
3.9 |
$564 |
0.5 |
| 2016Q1 |
30,058 |
2.2 |
$198,737,763 |
0.1 |
$509 |
-2.1 |
| 2016Q2 |
30,766 |
-0.1 |
$211,862,035 |
1.1 |
$530 |
1.1 |
| 2016Q3 |
31,395 |
-1.1 |
$218,789,268 |
-0.9 |
$536 |
0.2 |
| 2016Q4 |
30,481 |
-2.4 |
$217,379,375 |
-5.0 |
$549 |
-2.7 |
| 2017Q1 |
28,919 |
-3.8 |
$199,887,755 |
0.6 |
$532 |
4.5 |
| 2017Q2 |
29,646 |
-3.6 |
$206,762,925 |
-2.4 |
$536 |
1.3 |
| 2017Q3 |
30,714 |
-2.2 |
$214,791,264 |
-1.8 |
$538 |
0.3 |
| 2017Q4 |
29,511 |
-3.2 |
$222,145,562 |
2.2 |
$579 |
5.6 |
| 2018Q1 |
28,340 |
-2.0 |
$201,434,142 |
0.8 |
$547 |
2.8 |
| 2018Q2 |
29,392 |
-0.9 |
$209,419,528 |
1.3 |
$548 |
2.2 |
| 2018Q3 |
30,171 |
-1.8 |
$217,032,058 |
1.0 |
$553 |
2.9 |
| 2018Q4 |
29,246 |
-0.9 |
$222,753,329 |
0.3 |
$586 |
1.2 |
| 2019Q1 |
28,246 |
-0.3 |
$207,664,392 |
3.1 |
$566 |
3.4 |
| 2019Q2 |
28,956 |
-1.5 |
$212,564,168 |
1.5 |
$565 |
3.0 |
| 2019Q3 |
29,549 |
-2.1 |
$220,935,991 |
1.8 |
$575 |
3.9 |
| 2019Q4 |
28,928 |
-1.1 |
$227,985,303 |
2.3 |
$606 |
3.5 |
| 2020Q1 |
28,054 |
-0.7 |
$213,272,969 |
2.7 |
$585 |
3.4 |
| 2020Q2 |
27,479 |
-5.1 |
$218,636,297 |
2.9 |
$612 |
8.4 |
| 2020Q3 |
29,554 |
0.0 |
$229,096,101 |
3.7 |
$596 |
3.7 |
| 2020Q4 |
29,555 |
2.2 |
$249,283,172 |
9.3 |
$649 |
7.0 |
| 2021Q1 |
28,841 |
2.8 |
$225,131,566 |
5.6 |
$600 |
2.7 |
| 2021Q2 |
29,467 |
7.2 |
$244,803,054 |
12.0 |
$639 |
4.4 |
| 2021Q3 |
30,081 |
1.8 |
$258,334,503 |
12.8 |
$661 |
10.8 |
| 2021Q4 |
30,274 |
2.4 |
$265,703,225 |
6.6 |
$675 |
4.1 |
| 2022Q1 |
29,824 |
3.4 |
$261,388,599 |
16.1 |
$674 |
12.3 |
| 2022Q2 |
30,400 |
3.2 |
$259,538,852 |
6.0 |
$657 |
2.8 |
| 2022Q3 |
30,920 |
2.8 |
$285,519,952 |
10.5 |
$710 |
7.5 |
| 2022Q4 |
30,366 |
0.3 |
$274,240,228 |
3.2 |
$695 |
2.9 |
| 2023Q1 |
29,633 |
-0.6 |
$276,231,217 |
5.7 |
$717 |
6.4 |
| 2023Q2 |
30,117 |
-0.9 |
$266,778,538 |
2.8 |
$681 |
3.8 |
| 2023Q3 |
30,866 |
-0.2 |
$290,340,529 |
1.7 |
$724 |
1.9 |
| 2023Q4 |
30,431 |
0.2 |
$284,547,030 |
3.8 |
$719 |
3.5 |
| 2024Q1 |
29,556 |
-0.3 |
$282,536,997 |
2.3 |
$735 |
2.5 |
| 2024Q2 |
30,232 |
0.4 |
$272,576,529 |
2.2 |
$694 |
1.8 |
| 2024Q3 |
30,786 |
-0.3 |
$296,670,851 |
2.2 |
$741 |
2.4 |
| 2024Q4 |
30,328 |
-0.3 |
$291,543,864 |
2.5 |
$739 |
2.8 |
| 2025Q1 |
29,570 |
0.0 |
$285,343,096 |
1.0 |
$742 |
0.9 |
| 2025Q2 |
30,254 |
0.1 |
$276,631,585 |
1.5 |
$703 |
1.4 |
| 2025Q3b |
30,874 |
0.3 |
$303,724,082 |
2.4 |
$757 |
2.1 |
|
|
|
|
|
|
|
|
|
|
|
|
|
|
| aNorth American Industry Classification System. |
|
|
|
|
| bPreliminary. |
|
|
|
|
|
|
| Source: Quarterly Census of Employment and Wages. |
|
|
|
|
| Prepared by M. Moore, Research & Planning, WY DWS, 4/3/26. |
|
|
|
|
Figure: Average Monthly Employment in Retail Trade (NAICS 44-45) in Wyoming, 2001Q1-2025Q3
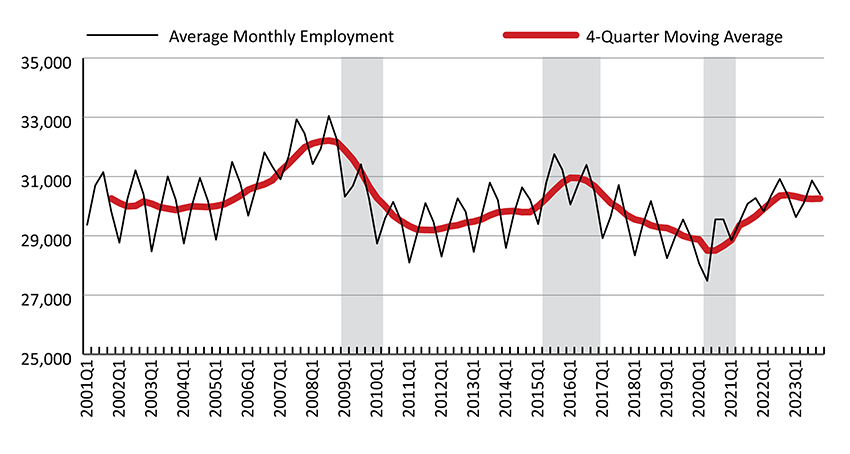
Figure: Over-the-Year Percent Change in Average Monthly Employment and Total Wages in Retail Trade (NAICS 44-45) in Wyoming, 2002Q1-2025Q3
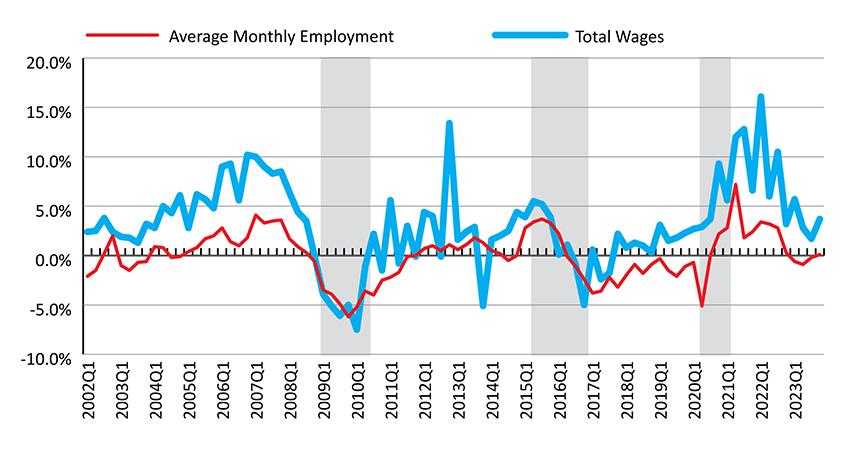
Shaded areas indicate periods of economic downturn: 2009Q1-2010Q1, 2015Q2-2016Q4, and 2020Q2-2021Q1.
Source: Quarterly Census of Employment and Wages.
Prepared by M. Moore, Research & Planning, WY DWS, 4/3/26.
 Hire Wyo