Wyoming QCEW Summary Statistics by Industry, 2001-2025
Professional & Business Services (NAICSa 54-56), 2025Q3
Average Monthly Employment: 22,892
Total Wages: $458,369,859
Average Weekly Wage: $1,540
North American Industry Classification System.
Published April 2026.
| Table: Over-the-Year Change in Professional & Business Services Supersector (NAICSa Sectors 54-56) Average Monthly Employment (AME), Total Wages, and Average Weekly Wage (AWW) Changes by Year/Quarter in Wyoming |
| Published April 2026. |
|
|
|
|
|
|
|
|
|
|
|
|
|
Average Monthly Employment |
Total Wages |
Average Weekly Wage |
| Year/Quarter |
N |
% Change |
$ |
% Change |
$ |
% Change |
| 2001Q1 |
15,061 |
|
$96,145,263 |
|
$491 |
|
| 2001Q2 |
15,979 |
|
$102,924,686 |
|
$495 |
|
| 2001Q3 |
16,208 |
|
$106,211,072 |
|
$504 |
|
| 2001Q4 |
15,308 |
|
$128,221,845 |
|
$644 |
|
| 2002Q1 |
14,746 |
-2.1 |
$98,687,431 |
2.6 |
$515 |
4.8 |
| 2002Q2 |
15,807 |
-1.1 |
$104,166,359 |
1.2 |
$507 |
2.3 |
| 2002Q3 |
16,255 |
0.3 |
$110,047,587 |
3.6 |
$521 |
3.3 |
| 2002Q4 |
15,536 |
1.5 |
$139,262,854 |
8.6 |
$690 |
7.0 |
| 2003Q1 |
14,387 |
-2.4 |
$98,701,758 |
0.0 |
$528 |
2.5 |
| 2003Q2 |
15,910 |
0.7 |
$108,757,238 |
4.4 |
$526 |
3.7 |
| 2003Q3 |
16,673 |
2.6 |
$118,115,052 |
7.3 |
$545 |
4.6 |
| 2003Q4 |
15,581 |
0.3 |
$141,745,763 |
1.8 |
$700 |
1.5 |
| 2004Q1 |
14,326 |
-0.4 |
$116,009,066 |
17.5 |
$623 |
18.0 |
| 2004Q2 |
15,665 |
-1.5 |
$119,582,373 |
10.0 |
$587 |
11.7 |
| 2004Q3 |
16,184 |
-2.9 |
$125,489,579 |
6.2 |
$596 |
9.5 |
| 2004Q4 |
15,134 |
-2.9 |
$146,565,651 |
3.4 |
$745 |
6.4 |
| 2005Q1 |
14,711 |
2.7 |
$121,250,714 |
4.5 |
$634 |
1.8 |
| 2005Q2 |
15,983 |
2.0 |
$129,370,806 |
8.2 |
$623 |
6.0 |
| 2005Q3 |
16,721 |
3.3 |
$148,790,665 |
18.6 |
$685 |
14.8 |
| 2005Q4 |
15,971 |
5.5 |
$159,397,354 |
8.8 |
$768 |
3.1 |
| 2006Q1 |
15,625 |
6.2 |
$134,400,493 |
10.8 |
$662 |
4.4 |
| 2006Q2 |
17,284 |
8.1 |
$156,580,720 |
21.0 |
$697 |
11.9 |
| 2006Q3 |
17,970 |
7.5 |
$169,008,939 |
13.6 |
$723 |
5.7 |
| 2006Q4 |
17,262 |
8.1 |
$187,557,747 |
17.7 |
$836 |
8.9 |
| 2007Q1 |
17,135 |
9.7 |
$158,308,345 |
17.8 |
$711 |
7.4 |
| 2007Q2 |
18,783 |
8.7 |
$183,682,063 |
17.3 |
$752 |
7.9 |
| 2007Q3 |
19,385 |
7.9 |
$185,087,893 |
9.5 |
$734 |
1.5 |
| 2007Q4 |
18,233 |
5.6 |
$219,702,204 |
17.1 |
$927 |
10.9 |
| 2008Q1 |
17,525 |
2.3 |
$180,893,193 |
14.3 |
$794 |
11.7 |
| 2008Q2 |
18,957 |
0.9 |
$197,476,387 |
7.5 |
$801 |
6.5 |
| 2008Q3 |
19,664 |
1.4 |
$200,574,139 |
8.4 |
$785 |
6.8 |
| 2008Q4 |
18,447 |
1.2 |
$225,441,100 |
2.6 |
$940 |
1.4 |
| 2009Q1 |
17,130 |
-2.3 |
$183,671,863 |
1.5 |
$825 |
3.9 |
| 2009Q2 |
17,527 |
-7.5 |
$179,723,077 |
-9.0 |
$789 |
-1.6 |
| 2009Q3 |
17,781 |
-9.6 |
$182,363,694 |
-9.1 |
$789 |
0.5 |
| 2009Q4 |
16,730 |
-9.3 |
$205,152,488 |
-9.0 |
$943 |
0.3 |
| 2010Q1 |
15,973 |
-6.8 |
$174,675,809 |
-4.9 |
$841 |
2.0 |
| 2010Q2 |
17,308 |
-1.2 |
$182,882,294 |
1.8 |
$813 |
3.0 |
| 2010Q3 |
18,338 |
3.1 |
$192,115,719 |
5.3 |
$806 |
2.1 |
| 2010Q4 |
17,148 |
2.5 |
$218,983,042 |
6.7 |
$982 |
4.1 |
| 2011Q1 |
16,459 |
3.0 |
$191,575,141 |
9.7 |
$895 |
6.4 |
| 2011Q2 |
17,795 |
2.8 |
$195,396,213 |
6.8 |
$845 |
3.9 |
| 2011Q3 |
18,847 |
2.8 |
$205,013,702 |
6.7 |
$837 |
3.8 |
| 2011Q4 |
17,937 |
4.6 |
$235,209,971 |
7.4 |
$1,009 |
2.7 |
| 2012Q1 |
17,211 |
4.6 |
$199,746,523 |
4.3 |
$893 |
-0.3 |
| 2012Q2 |
18,250 |
2.6 |
$210,110,268 |
7.5 |
$886 |
4.8 |
| 2012Q3 |
18,730 |
-0.6 |
$211,478,378 |
3.2 |
$869 |
3.8 |
| 2012Q4 |
17,763 |
-1.0 |
$253,337,887 |
7.7 |
$1,097 |
8.8 |
| 2013Q1 |
17,075 |
-0.8 |
$216,129,068 |
8.2 |
$974 |
9.1 |
| 2013Q2 |
18,335 |
0.5 |
$208,639,768 |
-0.7 |
$875 |
-1.2 |
| 2013Q3 |
18,905 |
0.9 |
$216,748,098 |
2.5 |
$882 |
1.5 |
| 2013Q4 |
18,240 |
2.7 |
$249,999,304 |
-1.3 |
$1,054 |
-3.9 |
| 2014Q1 |
17,337 |
1.5 |
$207,759,522 |
-3.9 |
$922 |
-5.3 |
| 2014Q2 |
18,690 |
1.9 |
$224,378,452 |
7.5 |
$923 |
5.5 |
| 2014Q3 |
19,270 |
1.9 |
$239,050,203 |
10.3 |
$954 |
8.2 |
| 2014Q4 |
18,459 |
1.2 |
$257,490,045 |
3.0 |
$1,073 |
1.8 |
| 2015Q1 |
17,607 |
1.6 |
$216,068,892 |
4.0 |
$944 |
2.4 |
| 2015Q2 |
18,716 |
0.1 |
$227,377,299 |
1.3 |
$935 |
1.2 |
| 2015Q3 |
19,332 |
0.3 |
$228,342,068 |
-4.5 |
$909 |
-4.8 |
| 2015Q4 |
18,325 |
-0.7 |
$259,580,696 |
0.8 |
$1,090 |
1.6 |
| 2016Q1 |
16,958 |
-3.7 |
$203,347,034 |
-5.9 |
$922 |
-2.3 |
| 2016Q2 |
17,992 |
-3.9 |
$206,177,521 |
-9.3 |
$881 |
-5.7 |
| 2016Q3 |
18,591 |
-3.8 |
$217,282,324 |
-4.8 |
$899 |
-1.1 |
| 2016Q4 |
17,635 |
-3.8 |
$237,233,540 |
-8.6 |
$1,035 |
-5.0 |
| 2017Q1 |
17,078 |
0.7 |
$208,009,533 |
2.3 |
$937 |
1.6 |
| 2017Q2 |
18,058 |
0.4 |
$217,452,678 |
5.5 |
$926 |
5.1 |
| 2017Q3 |
18,967 |
2.0 |
$227,419,299 |
4.7 |
$922 |
2.6 |
| 2017Q4 |
18,018 |
2.2 |
$252,548,018 |
6.5 |
$1,078 |
4.2 |
| 2018Q1 |
17,417 |
2.0 |
$222,108,498 |
6.8 |
$981 |
4.7 |
| 2018Q2 |
18,754 |
3.9 |
$235,460,966 |
8.3 |
$956 |
3.2 |
| 2018Q3 |
19,663 |
3.7 |
$249,092,119 |
9.5 |
$974 |
5.6 |
| 2018Q4 |
19,117 |
6.1 |
$282,129,821 |
11.7 |
$1,135 |
5.3 |
| 2019Q1 |
18,169 |
4.3 |
$240,107,729 |
8.1 |
$1,017 |
3.6 |
| 2019Q2 |
19,403 |
3.5 |
$255,391,798 |
8.5 |
$1,012 |
5.9 |
| 2019Q3 |
20,072 |
2.1 |
$273,896,767 |
10.0 |
$1,050 |
7.8 |
| 2019Q4 |
19,141 |
0.1 |
$310,460,346 |
10.0 |
$1,248 |
9.9 |
| 2020Q1 |
18,025 |
-0.8 |
$251,917,188 |
4.9 |
$1,075 |
5.8 |
| 2020Q2 |
18,153 |
-6.4 |
$238,202,117 |
-6.7 |
$1,009 |
-0.3 |
| 2020Q3 |
18,707 |
-6.8 |
$261,145,677 |
-4.7 |
$1,074 |
2.3 |
| 2020Q4 |
18,640 |
-2.6 |
$355,754,114 |
14.6 |
$1,468 |
17.7 |
| 2021Q1 |
18,443 |
2.3 |
$280,468,100 |
11.3 |
$1,170 |
8.8 |
| 2021Q2 |
19,758 |
8.8 |
$310,672,521 |
30.4 |
$1,210 |
19.9 |
| 2021Q3 |
20,452 |
9.3 |
$315,216,633 |
20.7 |
$1,186 |
10.4 |
| 2021Q4 |
20,009 |
7.3 |
$490,487,135 |
37.9 |
$1,886 |
28.5 |
| 2022Q1 |
19,498 |
5.7 |
$377,834,171 |
34.7 |
$1,491 |
27.5 |
| 2022Q2 |
20,764 |
5.1 |
$371,826,776 |
19.7 |
$1,378 |
13.9 |
| 2022Q3 |
21,655 |
5.9 |
$366,468,630 |
16.3 |
$1,302 |
9.8 |
| 2022Q4 |
20,889 |
4.4 |
$409,695,162 |
-16.5 |
$1,509 |
-20.0 |
| 2023Q1 |
20,512 |
5.2 |
$446,703,202 |
18.2 |
$1,675 |
12.3 |
| 2023Q2 |
22,136 |
6.6 |
$426,368,612 |
14.7 |
$1,482 |
7.5 |
| 2023Q3 |
22,685 |
4.8 |
$402,260,711 |
9.8 |
$1,364 |
4.8 |
| 2023Q4 |
21,477 |
2.8 |
$431,419,567 |
5.3 |
$1,545 |
2.4 |
| 2024Q1 |
21,079 |
2.8 |
$454,853,748 |
1.8 |
$1,660 |
-0.9 |
| 2024Q2 |
22,418 |
1.3 |
$478,202,921 |
12.2 |
$1,641 |
10.7 |
| 2024Q3 |
23,098 |
1.8 |
$503,383,252 |
25.1 |
$1,676 |
22.9 |
| 2024Q4 |
21,855 |
1.8 |
$451,230,565 |
4.6 |
$1,588 |
2.8 |
| 2025Q1 |
21,032 |
-0.2 |
$454,328,453 |
-0.1 |
$1,662 |
0.1 |
| 2025Q2 |
22,437 |
0.1 |
$426,343,855 |
-10.8 |
$1,462 |
-10.9 |
| 2025Q3b |
22,892 |
-0.9 |
$458,369,859 |
-8.9 |
$1,540 |
-8.1 |
|
|
|
|
|
|
|
| aNorth American Industry Classification System. |
|
|
|
|
| bPreliminary. |
|
|
|
|
|
|
| Source: Quarterly Census of Employment and Wages. |
|
|
|
|
| Prepared by M. Moore, Research & Planning, WY DWS, 4/3/26. |
|
|
|
|
Figure: Average Monthly Employment in Professional & Business Services (NAICS 54-56) in Wyoming, 2001Q1-2025Q3
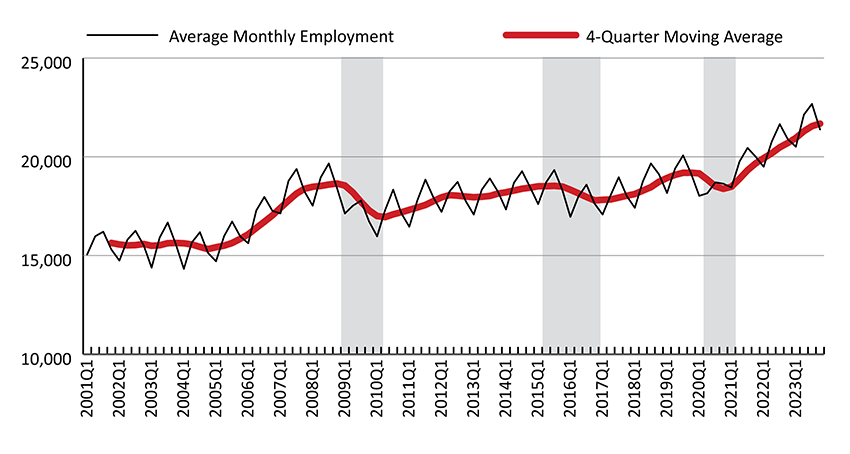
Figure: Over-the-Year Percent Change in Average Monthly Employment and Total Wages in Professional & Business Services (NAICS 54-56) in Wyoming, 2002Q1-2025Q3
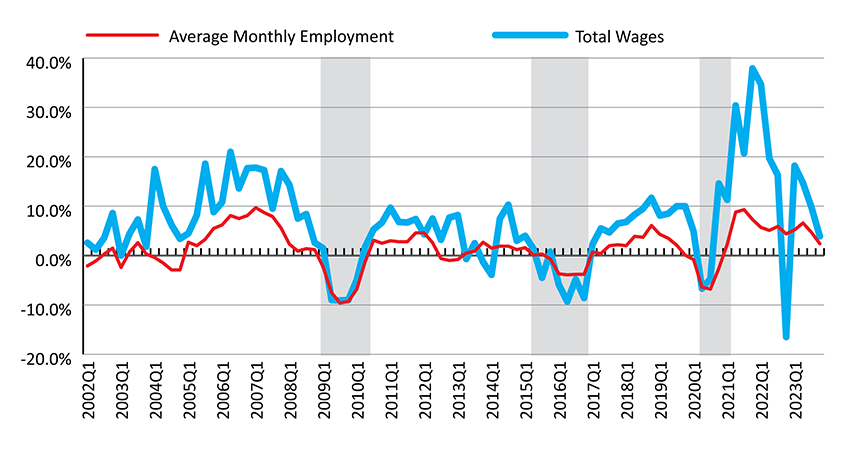
Shaded areas indicate periods of economic downturn: 2009Q1-2010Q1, 2015Q2-2016Q4, and 2020Q2-2021Q1.
Source: Quarterly Census of Employment and Wages.
Prepared by M. Moore, Research & Planning, WY DWS, 4/3/26.
 Hire Wyo