Wyoming QCEW Summary Statistics by Industry, 2001-2025
Other Services, Except Public Administration (NAICSa 81), 2025Q3
Average Monthly Employment: 7,759
Total Wages: $102,826,273
Average Weekly Wage: $975
North American Industry Classification System.
Published April 2026.
| Table: Over-the-Year Change in Other Services, except Public Administration Sector (NAICSa Sector 81) Average Monthly Employment (AME), Total Wages, and Average Weekly Wage (AWW) Changes by Year/Quarter in Wyoming |
| Published April 2026. |
|
|
|
|
|
|
|
|
|
|
|
|
|
Average Monthly Employment |
Total Wages |
Average Weekly Wage |
| Year/Quarter |
N |
% Change |
$ |
% Change |
$ |
% Change |
| 2001Q1 |
7,287 |
|
$35,976,300 |
|
$380 |
|
| 2001Q2 |
7,681 |
|
$38,263,588 |
|
$383 |
|
| 2001Q3 |
7,921 |
|
$41,428,026 |
|
$402 |
|
| 2001Q4 |
7,887 |
|
$42,622,767 |
|
$416 |
|
| 2002Q1 |
7,368 |
1.1 |
$37,498,627 |
4.2 |
$391 |
3.1 |
| 2002Q2 |
7,680 |
0.0 |
$41,054,499 |
7.3 |
$411 |
7.3 |
| 2002Q3 |
7,766 |
-1.9 |
$40,960,321 |
-1.1 |
$406 |
0.8 |
| 2002Q4 |
7,438 |
-5.7 |
$41,726,652 |
-2.1 |
$432 |
3.8 |
| 2003Q1 |
7,351 |
-0.2 |
$37,519,850 |
0.1 |
$393 |
0.3 |
| 2003Q2 |
7,432 |
-3.2 |
$39,596,390 |
-3.6 |
$410 |
-0.3 |
| 2003Q3 |
7,614 |
-2.0 |
$42,008,231 |
2.6 |
$424 |
4.6 |
| 2003Q4 |
7,427 |
-0.2 |
$42,356,267 |
1.5 |
$439 |
1.7 |
| 2004Q1 |
7,311 |
-0.5 |
$38,357,502 |
2.2 |
$404 |
2.8 |
| 2004Q2 |
7,539 |
1.4 |
$40,380,304 |
2.0 |
$412 |
0.5 |
| 2004Q3 |
7,753 |
1.8 |
$42,412,905 |
1.0 |
$421 |
-0.9 |
| 2004Q4 |
7,429 |
0.0 |
$43,422,312 |
2.5 |
$450 |
2.5 |
| 2005Q1 |
7,323 |
0.2 |
$40,329,411 |
5.1 |
$424 |
5.0 |
| 2005Q2 |
7,541 |
0.0 |
$42,559,845 |
5.4 |
$434 |
5.4 |
| 2005Q3 |
7,876 |
1.6 |
$46,620,385 |
9.9 |
$455 |
8.2 |
| 2005Q4 |
7,521 |
1.2 |
$47,357,644 |
9.1 |
$484 |
7.7 |
| 2006Q1 |
7,761 |
6.0 |
$49,042,756 |
21.6 |
$486 |
14.7 |
| 2006Q2 |
8,277 |
9.8 |
$54,888,749 |
29.0 |
$510 |
17.5 |
| 2006Q3 |
8,484 |
7.7 |
$57,152,385 |
22.6 |
$518 |
13.8 |
| 2006Q4 |
8,280 |
10.1 |
$61,176,684 |
29.2 |
$568 |
17.3 |
| 2007Q1 |
8,251 |
6.3 |
$61,079,526 |
24.5 |
$569 |
17.1 |
| 2007Q2 |
8,734 |
5.5 |
$69,246,436 |
26.2 |
$610 |
19.6 |
| 2007Q3 |
8,649 |
1.9 |
$64,939,751 |
13.6 |
$578 |
11.5 |
| 2007Q4 |
8,332 |
0.6 |
$66,198,510 |
8.2 |
$611 |
7.5 |
| 2008Q1 |
8,121 |
-1.6 |
$63,087,845 |
3.3 |
$598 |
4.9 |
| 2008Q2 |
8,380 |
-4.1 |
$64,047,544 |
-7.5 |
$588 |
-3.6 |
| 2008Q3 |
8,574 |
-0.9 |
$68,070,876 |
4.8 |
$611 |
5.7 |
| 2008Q4 |
8,363 |
0.4 |
$69,875,378 |
5.6 |
$643 |
5.2 |
| 2009Q1 |
8,269 |
1.8 |
$64,819,469 |
2.7 |
$603 |
0.9 |
| 2009Q2 |
8,392 |
0.1 |
$68,499,976 |
7.0 |
$628 |
6.8 |
| 2009Q3 |
8,207 |
-4.3 |
$62,173,764 |
-8.7 |
$583 |
-4.6 |
| 2009Q4 |
7,773 |
-7.1 |
$63,012,970 |
-9.8 |
$624 |
-3.0 |
| 2010Q1 |
7,628 |
-7.7 |
$57,726,627 |
-10.9 |
$582 |
-3.5 |
| 2010Q2 |
7,948 |
-5.3 |
$66,376,287 |
-3.1 |
$642 |
2.3 |
| 2010Q3 |
8,131 |
-0.9 |
$78,408,810 |
26.1 |
$742 |
27.3 |
| 2010Q4 |
7,999 |
2.9 |
$68,695,807 |
9.0 |
$661 |
5.9 |
| 2011Q1 |
7,927 |
3.9 |
$63,839,318 |
10.6 |
$619 |
6.4 |
| 2011Q2 |
8,325 |
4.7 |
$68,508,382 |
3.2 |
$633 |
-1.5 |
| 2011Q3 |
8,615 |
6.0 |
$74,025,319 |
-5.6 |
$661 |
-10.9 |
| 2011Q4 |
8,364 |
4.6 |
$74,403,851 |
8.3 |
$684 |
3.6 |
| 2012Q1 |
8,275 |
4.4 |
$71,171,159 |
11.5 |
$662 |
6.8 |
| 2012Q2 |
8,640 |
3.8 |
$72,804,983 |
6.3 |
$648 |
2.4 |
| 2012Q3 |
8,858 |
2.8 |
$77,764,127 |
5.1 |
$675 |
2.2 |
| 2012Q4 |
8,462 |
1.2 |
$76,072,723 |
2.2 |
$692 |
1.1 |
| 2013Q1 |
8,147 |
-1.5 |
$70,123,305 |
-1.5 |
$662 |
0.1 |
| 2013Q2 |
8,263 |
-4.4 |
$72,220,666 |
-0.8 |
$672 |
3.7 |
| 2013Q3 |
8,416 |
-5.0 |
$74,485,639 |
-4.2 |
$681 |
0.8 |
| 2013Q4 |
8,005 |
-5.4 |
$75,546,263 |
-0.7 |
$726 |
5.0 |
| 2014Q1 |
7,685 |
-5.7 |
$65,156,109 |
-7.1 |
$652 |
-1.5 |
| 2014Q2 |
7,902 |
-4.4 |
$67,965,978 |
-5.9 |
$662 |
-1.6 |
| 2014Q3 |
7,972 |
-5.3 |
$69,622,830 |
-6.5 |
$672 |
-1.3 |
| 2014Q4 |
7,785 |
-2.8 |
$73,900,869 |
-2.2 |
$730 |
0.6 |
| 2015Q1 |
7,599 |
-1.1 |
$65,858,105 |
1.1 |
$667 |
2.2 |
| 2015Q2 |
7,833 |
-0.9 |
$69,624,958 |
2.4 |
$684 |
3.3 |
| 2015Q3 |
7,878 |
-1.2 |
$70,927,008 |
1.9 |
$693 |
3.1 |
| 2015Q4 |
7,486 |
-3.8 |
$69,379,736 |
-6.1 |
$713 |
-2.4 |
| 2016Q1 |
7,176 |
-5.6 |
$59,710,943 |
-9.3 |
$640 |
-4.0 |
| 2016Q2 |
7,521 |
-4.0 |
$65,834,209 |
-5.4 |
$673 |
-1.5 |
| 2016Q3 |
7,383 |
-6.3 |
$63,180,034 |
-10.9 |
$658 |
-5.0 |
| 2016Q4 |
7,094 |
-5.2 |
$62,886,847 |
-9.4 |
$682 |
-4.3 |
| 2017Q1 |
6,975 |
-2.8 |
$59,282,251 |
-0.7 |
$654 |
2.1 |
| 2017Q2 |
7,264 |
-3.4 |
$62,171,211 |
-5.6 |
$658 |
-2.2 |
| 2017Q3 |
7,496 |
1.5 |
$65,046,176 |
3.0 |
$667 |
1.4 |
| 2017Q4 |
7,163 |
1.0 |
$66,650,847 |
6.0 |
$716 |
5.0 |
| 2018Q1 |
7,047 |
1.0 |
$63,826,411 |
7.7 |
$697 |
6.6 |
| 2018Q2 |
7,366 |
1.4 |
$66,372,428 |
6.8 |
$693 |
5.3 |
| 2018Q3 |
7,457 |
-0.5 |
$67,926,617 |
4.4 |
$701 |
5.0 |
| 2018Q4 |
7,173 |
0.1 |
$71,636,007 |
7.5 |
$768 |
7.3 |
| 2019Q1 |
7,002 |
-0.6 |
$66,808,758 |
4.7 |
$734 |
5.3 |
| 2019Q2 |
7,216 |
-2.0 |
$69,569,830 |
4.8 |
$742 |
7.0 |
| 2019Q3 |
7,400 |
-0.8 |
$71,733,851 |
5.6 |
$746 |
6.4 |
| 2019Q4 |
7,135 |
-0.5 |
$74,072,071 |
3.4 |
$799 |
3.9 |
| 2020Q1 |
7,068 |
0.9 |
$69,158,520 |
3.5 |
$753 |
2.6 |
| 2020Q2 |
6,461 |
-10.5 |
$63,623,646 |
-8.5 |
$758 |
2.1 |
| 2020Q3 |
6,822 |
-7.8 |
$66,247,136 |
-7.6 |
$747 |
0.2 |
| 2020Q4 |
6,727 |
-5.7 |
$73,355,822 |
-1.0 |
$839 |
5.0 |
| 2021Q1 |
6,635 |
-6.1 |
$64,473,755 |
-6.8 |
$747 |
-0.7 |
| 2021Q2 |
6,975 |
8.0 |
$70,539,709 |
10.9 |
$778 |
2.7 |
| 2021Q3 |
7,076 |
3.7 |
$74,042,238 |
11.8 |
$805 |
7.7 |
| 2021Q4 |
6,877 |
2.2 |
$80,901,759 |
10.3 |
$905 |
7.9 |
| 2022Q1 |
6,755 |
1.8 |
$71,697,329 |
11.2 |
$816 |
9.2 |
| 2022Q2 |
7,115 |
2.0 |
$80,159,467 |
13.6 |
$867 |
11.4 |
| 2022Q3 |
7,298 |
3.1 |
$84,337,594 |
13.9 |
$889 |
10.4 |
| 2022Q4 |
7,118 |
3.5 |
$86,662,163 |
7.1 |
$937 |
3.5 |
| 2023Q1 |
7,100 |
5.1 |
$82,503,620 |
15.1 |
$894 |
9.5 |
| 2023Q2 |
7,345 |
3.2 |
$84,355,614 |
5.2 |
$883 |
1.9 |
| 2023Q3 |
7,431 |
1.8 |
$87,226,657 |
3.4 |
$903 |
1.6 |
| 2023Q4 |
7,337 |
3.1 |
$93,383,995 |
7.8 |
$979 |
4.5 |
| 2024Q1 |
7,239 |
2.0 |
$87,705,527 |
6.3 |
$932 |
4.3 |
| 2024Q2 |
7,586 |
3.3 |
$93,203,170 |
10.5 |
$945 |
7.0 |
| 2024Q3 |
7,589 |
2.1 |
$93,068,340 |
6.7 |
$943 |
4.5 |
| 2024Q4 |
7,395 |
0.8 |
$97,733,816 |
4.7 |
$1,017 |
3.8 |
| 2025Q1 |
7,369 |
1.8 |
$92,032,194 |
4.9 |
$961 |
3.1 |
| 2025Q2 |
7,787 |
2.6 |
$102,837,118 |
10.3 |
$1,016 |
7.5 |
| 2025Q3b |
7,759 |
2.2 |
$98,378,729 |
5.7 |
$975 |
3.4 |
|
|
|
|
|
|
|
|
|
|
|
|
|
|
| aNorth American Industry Classification System. |
|
|
|
|
| bPreliminary. |
|
|
|
|
|
|
| Source: Quarterly Census of Employment and Wages. |
|
|
|
|
| Prepared by M. Moore, Research & Planning, WY DWS, 4/3/26. |
|
|
|
|
Figure: Average Monthly Employment in Other Services, Except Public Administration (NAICS 81) in Wyoming, 2001Q1-2025Q3
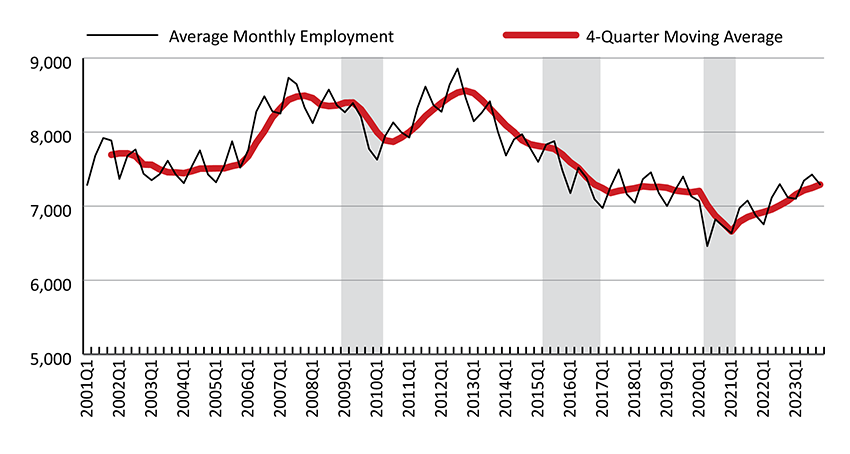
Figure: Over-the-Year Percent Change in Average Monthly Employment and Total Wages in Other Services, Except Public Administration (NAICS 81) in Wyoming, 2002Q1-2025Q3
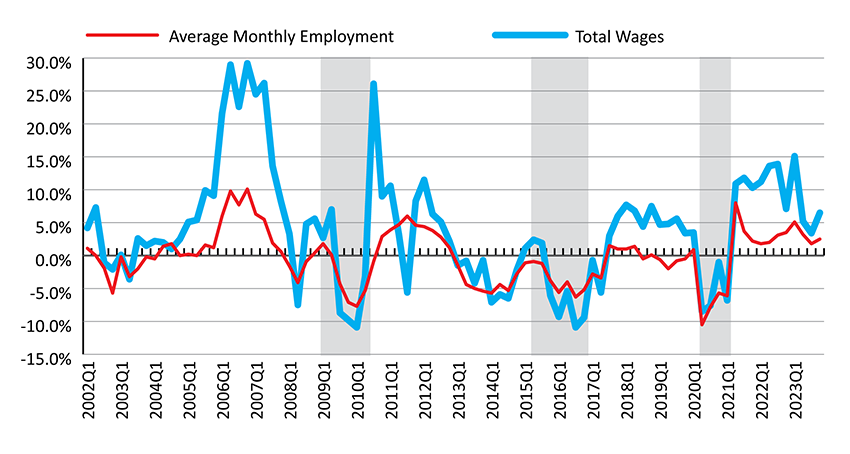
Shaded areas indicate periods of economic downturn: 2009Q1-2010Q1, 2015Q2-2016Q4, and 2020Q2-2021Q1.
Source: Quarterly Census of Employment and Wages.
Prepared by M. Moore, Research & Planning, WY DWS, 4/3/26.
 Hire Wyo