Wyoming QCEW Summary Statistics by Industry, 2001-2025
Support Activities for Mining (NAICSa 213), 2025Q3
Average Monthly Employment: 6,295
Total Wages: $150,727,025
Average Weekly Wage: $1,842
North American Industry Classification System.
Published April 2026.
| Table: Over-the-Year Change in Private Support Activities for Mining Sector (NAICSa Subsector 213) Average Monthly Employment (AME), Total Wages, and Average Weekly Wage (AWW) Changes by Year/Quarter in Wyoming |
| Published April 2026. |
|
|
|
|
|
|
|
|
|
|
|
|
|
Average Monthly Employment |
Total Wages |
Average Weekly Wage |
| Year/Quarter |
N |
% Change |
$ |
% Change |
$ |
% Change |
| 2001Q1 |
6,822 |
|
$76,235,518 |
|
$860 |
|
| 2001Q2 |
7,565 |
|
$85,836,581 |
|
$873 |
|
| 2001Q3 |
8,232 |
|
$91,518,241 |
|
$855 |
|
| 2001Q4 |
8,348 |
|
$97,453,286 |
|
$898 |
|
| 2002Q1 |
7,303 |
7.1 |
$82,525,443 |
8.3 |
$869 |
1.1 |
| 2002Q2 |
6,967 |
-7.9 |
$77,461,837 |
-9.8 |
$855 |
-2.0 |
| 2002Q3 |
7,354 |
-10.7 |
$81,677,687 |
-10.8 |
$854 |
-0.1 |
| 2002Q4 |
6,985 |
-16.3 |
$87,017,101 |
-10.7 |
$958 |
6.7 |
| 2003Q1 |
6,866 |
-6.0 |
$78,602,664 |
-4.8 |
$881 |
1.3 |
| 2003Q2 |
7,474 |
7.3 |
$85,612,601 |
10.5 |
$881 |
3.0 |
| 2003Q3 |
8,225 |
11.8 |
$95,743,992 |
17.2 |
$895 |
4.8 |
| 2003Q4 |
8,360 |
19.7 |
$107,061,557 |
23.0 |
$985 |
2.8 |
| 2004Q1 |
8,464 |
23.3 |
$103,530,151 |
31.7 |
$941 |
6.8 |
| 2004Q2 |
8,926 |
19.4 |
$111,677,204 |
30.4 |
$962 |
9.2 |
| 2004Q3 |
9,794 |
19.1 |
$119,614,102 |
24.9 |
$939 |
4.9 |
| 2004Q4 |
10,133 |
21.2 |
$138,732,462 |
29.6 |
$1,053 |
6.9 |
| 2005Q1 |
10,125 |
19.6 |
$130,412,552 |
26.0 |
$991 |
5.3 |
| 2005Q2 |
10,794 |
20.9 |
$145,638,671 |
30.4 |
$1,038 |
7.8 |
| 2005Q3 |
11,540 |
17.8 |
$165,206,032 |
38.1 |
$1,101 |
17.2 |
| 2005Q4 |
12,007 |
18.5 |
$178,899,133 |
29.0 |
$1,146 |
8.8 |
| 2006Q1 |
12,752 |
25.9 |
$189,437,575 |
45.3 |
$1,143 |
15.3 |
| 2006Q2 |
13,406 |
24.2 |
$199,608,327 |
37.1 |
$1,145 |
10.4 |
| 2006Q3 |
14,126 |
22.4 |
$223,075,039 |
35.0 |
$1,215 |
10.3 |
| 2006Q4 |
14,384 |
19.8 |
$242,794,197 |
35.7 |
$1,298 |
13.3 |
| 2007Q1 |
13,961 |
9.5 |
$232,333,260 |
22.6 |
$1,280 |
12.0 |
| 2007Q2 |
13,779 |
2.8 |
$222,113,270 |
11.3 |
$1,240 |
8.3 |
| 2007Q3 |
13,804 |
-2.3 |
$235,953,297 |
5.8 |
$1,315 |
8.2 |
| 2007Q4 |
13,976 |
-2.8 |
$252,792,589 |
4.1 |
$1,391 |
7.2 |
| 2008Q1 |
14,014 |
0.4 |
$243,723,780 |
4.9 |
$1,338 |
4.5 |
| 2008Q2 |
14,283 |
3.7 |
$244,801,515 |
10.2 |
$1,318 |
6.3 |
| 2008Q3 |
15,313 |
10.9 |
$274,386,707 |
16.3 |
$1,378 |
4.8 |
| 2008Q4 |
15,776 |
12.9 |
$299,450,488 |
18.5 |
$1,460 |
4.9 |
| 2009Q1 |
14,150 |
1.0 |
$244,726,516 |
0.4 |
$1,330 |
-0.6 |
| 2009Q2 |
11,453 |
-19.8 |
$177,501,263 |
-27.5 |
$1,192 |
-9.6 |
| 2009Q3 |
10,562 |
-31.0 |
$169,818,533 |
-38.1 |
$1,237 |
-10.3 |
| 2009Q4 |
10,591 |
-32.9 |
$186,223,244 |
-37.8 |
$1,353 |
-7.4 |
| 2010Q1 |
10,377 |
-26.7 |
$166,987,289 |
-31.8 |
$1,238 |
-7.0 |
| 2010Q2 |
10,759 |
-6.1 |
$177,716,655 |
0.1 |
$1,271 |
6.6 |
| 2010Q3 |
11,698 |
10.8 |
$207,519,901 |
22.2 |
$1,365 |
10.3 |
| 2010Q4 |
12,215 |
15.3 |
$234,844,373 |
26.1 |
$1,479 |
9.3 |
| 2011Q1 |
12,247 |
18.0 |
$210,894,925 |
26.3 |
$1,325 |
7.0 |
| 2011Q2 |
12,682 |
17.9 |
$224,317,606 |
26.2 |
$1,361 |
7.1 |
| 2011Q3 |
13,620 |
16.4 |
$263,216,538 |
26.8 |
$1,487 |
8.9 |
| 2011Q4 |
14,167 |
16.0 |
$283,921,612 |
20.9 |
$1,542 |
4.2 |
| 2012Q1 |
13,686 |
11.7 |
$262,436,137 |
24.4 |
$1,475 |
11.4 |
| 2012Q2 |
13,273 |
4.7 |
$254,902,190 |
13.6 |
$1,477 |
8.6 |
| 2012Q3 |
12,930 |
-5.1 |
$250,998,836 |
-4.6 |
$1,493 |
0.4 |
| 2012Q4 |
12,941 |
-8.7 |
$266,641,058 |
-6.1 |
$1,585 |
2.8 |
| 2013Q1 |
12,263 |
-10.4 |
$234,022,489 |
-10.8 |
$1,468 |
-0.5 |
| 2013Q2 |
12,252 |
-7.7 |
$235,499,873 |
-7.6 |
$1,479 |
0.1 |
| 2013Q3 |
12,680 |
-1.9 |
$249,530,713 |
-0.6 |
$1,514 |
1.4 |
| 2013Q4 |
12,916 |
-0.2 |
$277,540,161 |
4.1 |
$1,653 |
4.3 |
| 2014Q1 |
12,952 |
5.6 |
$262,679,347 |
12.2 |
$1,560 |
6.3 |
| 2014Q2 |
13,090 |
6.8 |
$265,402,148 |
12.7 |
$1,560 |
5.5 |
| 2014Q3 |
13,500 |
6.5 |
$277,429,488 |
11.2 |
$1,581 |
4.4 |
| 2014Q4 |
13,844 |
7.2 |
$304,876,174 |
9.8 |
$1,694 |
2.5 |
| 2015Q1 |
12,529 |
-3.3 |
$248,944,345 |
-5.2 |
$1,528 |
-2.0 |
| 2015Q2 |
9,976 |
-23.8 |
$183,438,923 |
-30.9 |
$1,414 |
-9.3 |
| 2015Q3 |
9,385 |
-30.5 |
$176,120,358 |
-36.5 |
$1,444 |
-8.7 |
| 2015Q4 |
8,707 |
-37.1 |
$171,072,196 |
-43.9 |
$1,511 |
-10.8 |
| 2016Q1 |
7,416 |
-40.8 |
$124,298,583 |
-50.1 |
$1,289 |
-15.6 |
| 2016Q2 |
6,191 |
-37.9 |
$103,786,092 |
-43.4 |
$1,289 |
-8.8 |
| 2016Q3 |
6,273 |
-33.2 |
$110,565,003 |
-37.2 |
$1,356 |
-6.1 |
| 2016Q4 |
6,765 |
-22.3 |
$121,889,451 |
-28.7 |
$1,386 |
-8.3 |
| 2017Q1 |
7,454 |
0.5 |
$135,696,065 |
9.2 |
$1,400 |
8.6 |
| 2017Q2 |
8,024 |
29.6 |
$149,585,677 |
44.1 |
$1,434 |
11.2 |
| 2017Q3 |
8,558 |
36.4 |
$163,619,684 |
48.0 |
$1,471 |
8.5 |
| 2017Q4 |
9,274 |
37.1 |
$188,595,485 |
54.7 |
$1,564 |
12.9 |
| 2018Q1 |
9,345 |
25.4 |
$182,063,127 |
34.2 |
$1,499 |
7.0 |
| 2018Q2 |
9,204 |
14.7 |
$180,236,175 |
20.5 |
$1,506 |
5.0 |
| 2018Q3 |
9,663 |
12.9 |
$194,031,321 |
18.6 |
$1,545 |
5.0 |
| 2018Q4 |
10,004 |
7.9 |
$213,216,250 |
13.1 |
$1,640 |
4.8 |
| 2019Q1 |
9,977 |
6.8 |
$199,175,032 |
9.4 |
$1,536 |
2.5 |
| 2019Q2 |
9,987 |
8.5 |
$201,696,719 |
11.9 |
$1,553 |
3.1 |
| 2019Q3 |
10,128 |
4.8 |
$209,860,723 |
8.2 |
$1,594 |
3.2 |
| 2019Q4 |
9,831 |
-1.7 |
$215,703,454 |
1.2 |
$1,688 |
2.9 |
| 2020Q1 |
8,938 |
-10.4 |
$176,542,060 |
-11.4 |
$1,519 |
-1.1 |
| 2020Q2 |
5,993 |
-40.0 |
$115,683,364 |
-42.6 |
$1,485 |
-4.4 |
| 2020Q3 |
4,661 |
-54.0 |
$77,555,603 |
-63.0 |
$1,280 |
-19.7 |
| 2020Q4 |
4,636 |
-52.8 |
$88,826,781 |
-58.8 |
$1,474 |
-12.7 |
| 2021Q1 |
4,885 |
-45.3 |
$83,269,034 |
-52.8 |
$1,311 |
-13.7 |
| 2021Q2 |
5,207 |
-13.1 |
$95,795,742 |
-17.2 |
$1,415 |
-4.7 |
| 2021Q3 |
5,587 |
19.9 |
$106,980,659 |
37.9 |
$1,473 |
15.1 |
| 2021Q4 |
6,019 |
29.8 |
$130,555,155 |
47.0 |
$1,668 |
13.2 |
| 2022Q1 |
5,973 |
22.3 |
$114,309,014 |
37.3 |
$1,472 |
12.3 |
| 2022Q2 |
6,280 |
20.6 |
$131,127,966 |
36.9 |
$1,606 |
13.5 |
| 2022Q3 |
6,772 |
21.2 |
$155,145,083 |
45.0 |
$1,762 |
19.6 |
| 2022Q4 |
6,971 |
15.8 |
$162,303,435 |
24.3 |
$1,791 |
7.3 |
| 2023Q1 |
6,925 |
16.0 |
$157,340,711 |
37.6 |
$1,748 |
18.7 |
| 2023Q2 |
6,981 |
11.2 |
$153,976,005 |
17.4 |
$1,697 |
5.6 |
| 2023Q3 |
7,058 |
4.2 |
$161,798,320 |
4.3 |
$1,763 |
0.1 |
| 2023Q4 |
7,080 |
1.6 |
$171,505,400 |
5.7 |
$1,863 |
4.0 |
| 2024Q1 |
6,685 |
-3.5 |
$153,503,770 |
-2.4 |
$1,766 |
1.1 |
| 2024Q2 |
6,584 |
-5.7 |
$145,253,345 |
-5.7 |
$1,697 |
0.0 |
| 2024Q3 |
6,679 |
-5.4 |
$157,152,092 |
-2.9 |
$1,810 |
2.6 |
| 2024Q4 |
6,715 |
-5.2 |
$166,912,509 |
-2.7 |
$1,912 |
2.6 |
| 2025Q1 |
6,614 |
-1.1 |
$153,696,108 |
0.1 |
$1,787 |
1.2 |
| 2025Q2 |
6,605 |
0.3 |
$152,506,636 |
5.0 |
$1,776 |
4.7 |
| 2025Q3b |
6,295 |
-5.7 |
$150,727,025 |
-4.1 |
$1,842 |
1.8 |
|
|
|
|
|
|
|
|
|
|
|
|
|
|
| aNorth American Industry Classification System. |
|
|
|
|
| bPreliminary. |
|
|
|
|
|
|
| Source: Quarterly Census of Employment and Wages. |
|
|
|
|
| Prepared by M. Moore, Research & Planning, WY DWS, 4/3/26. |
|
|
|
|
Figure: Average Monthly Employment in Support Activities for Mining (NAICS 213) in Wyoming, 2001Q1-2025Q3
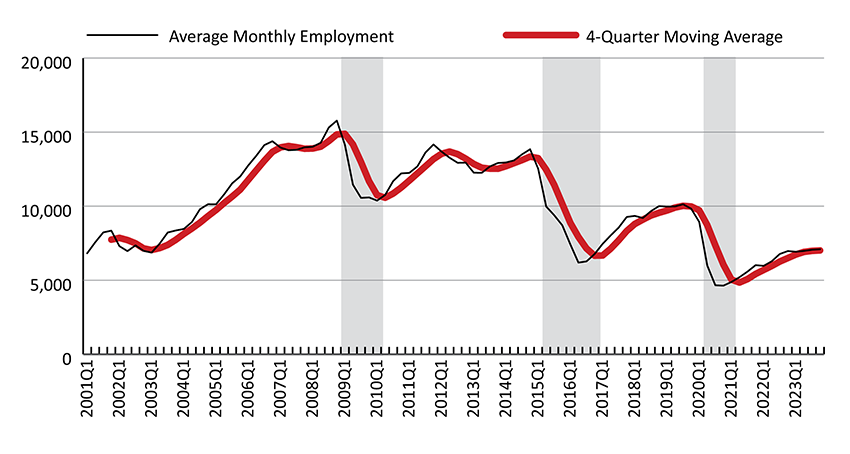
Figure: Over-the-Year Percent Change in Average Monthly Employment and Total Wages in Support Activities for Mining (NAICS 213) in Wyoming, 2002Q1-2025Q3
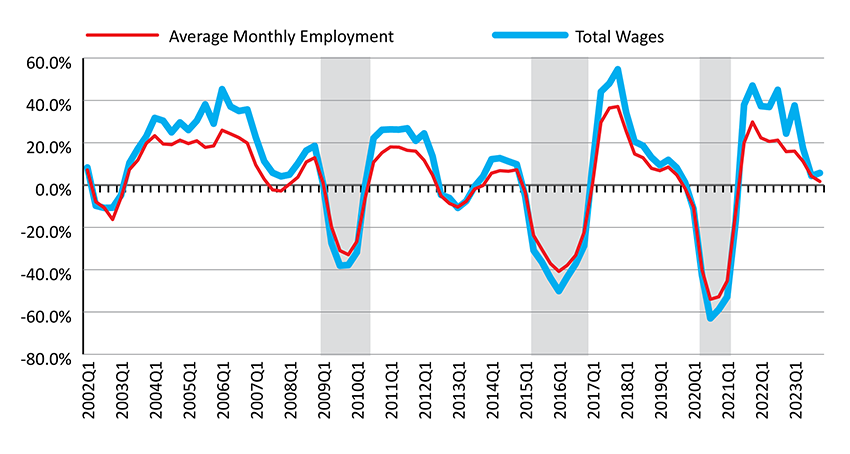
Shaded areas indicate periods of economic downturn: 2009Q1-2010Q1, 2015Q2-2016Q4, and 2020Q2-2021Q1.
Source: Quarterly Census of Employment and Wages.
Prepared by M. Moore, Research & Planning, WY DWS, 4/3/26.
 Hire Wyo