Wyoming QCEW Summary Statistics by Industry, 2001-2025
Mining, Including Oil & Gas (NAICSa 21), 2025Q2
Average Monthly Employment: 15,716
Total Wages: $418,819,518
Average Weekly Wage: $2,050
North American Industry Classification System.
Published January 2026.
| Table: Over-the-Year Change in Private Mining Sector (NAICSa Sector 21) Average Monthly Employment (AME), Total Wages, and Average Weekly Wage (AWW) Changes by Year/Quarter in Wyoming |
| Published January 2026. |
|
|
|
|
|
|
|
|
|
|
|
|
|
Average Monthly Employment |
Total Wages |
Average Weekly Wage |
| Year/Quarter |
N |
% Change |
$ |
% Change |
$ |
% Change |
| 2001Q1 |
16,718 |
|
$228,013,756 |
|
$1,049 |
|
| 2001Q2 |
17,914 |
|
$238,382,987 |
|
$1,024 |
|
| 2001Q3 |
18,993 |
|
$243,325,696 |
|
$985 |
|
| 2001Q4 |
19,108 |
|
$259,754,530 |
|
$1,046 |
|
| 2002Q1 |
18,031 |
7.9 |
$255,642,198 |
12.1 |
$1,091 |
4.0 |
| 2002Q2 |
17,712 |
-1.1 |
$233,328,312 |
-2.1 |
$1,013 |
-1.0 |
| 2002Q3 |
18,174 |
-4.3 |
$241,534,267 |
-0.7 |
$1,022 |
3.7 |
| 2002Q4 |
17,501 |
-8.4 |
$251,884,768 |
-3.0 |
$1,107 |
5.9 |
| 2003Q1 |
17,278 |
-4.2 |
$248,007,450 |
-3.0 |
$1,104 |
1.2 |
| 2003Q2 |
17,968 |
1.4 |
$245,426,250 |
5.2 |
$1,051 |
3.7 |
| 2003Q3 |
19,062 |
4.9 |
$260,227,079 |
7.7 |
$1,050 |
2.7 |
| 2003Q4 |
19,155 |
9.5 |
$282,938,810 |
12.3 |
$1,136 |
2.6 |
| 2004Q1 |
19,086 |
10.5 |
$282,594,880 |
13.9 |
$1,139 |
3.2 |
| 2004Q2 |
19,689 |
9.6 |
$278,817,266 |
13.6 |
$1,089 |
3.7 |
| 2004Q3 |
20,852 |
9.4 |
$298,845,368 |
14.8 |
$1,102 |
5.0 |
| 2004Q4 |
21,142 |
10.4 |
$327,905,367 |
15.9 |
$1,193 |
5.0 |
| 2005Q1 |
21,239 |
11.3 |
$324,239,411 |
14.7 |
$1,174 |
3.1 |
| 2005Q2 |
22,232 |
12.9 |
$330,294,044 |
18.5 |
$1,143 |
4.9 |
| 2005Q3 |
23,298 |
11.7 |
$363,670,975 |
21.7 |
$1,201 |
8.9 |
| 2005Q4 |
23,861 |
12.9 |
$383,949,240 |
17.1 |
$1,238 |
3.8 |
| 2006Q1 |
24,934 |
17.4 |
$414,435,589 |
27.8 |
$1,279 |
8.9 |
| 2006Q2 |
26,268 |
18.2 |
$428,067,841 |
29.6 |
$1,254 |
9.7 |
| 2006Q3 |
27,385 |
17.5 |
$459,116,406 |
26.2 |
$1,290 |
7.4 |
| 2006Q4 |
27,353 |
14.6 |
$492,965,922 |
28.4 |
$1,386 |
12.0 |
| 2007Q1 |
26,998 |
8.3 |
$497,791,110 |
20.1 |
$1,418 |
10.9 |
| 2007Q2 |
27,192 |
3.5 |
$473,357,351 |
10.6 |
$1,339 |
6.8 |
| 2007Q3 |
27,511 |
0.5 |
$478,900,515 |
4.3 |
$1,339 |
3.8 |
| 2007Q4 |
27,688 |
1.2 |
$523,055,126 |
6.1 |
$1,453 |
4.8 |
| 2008Q1 |
28,038 |
3.9 |
$539,754,632 |
8.4 |
$1,481 |
4.4 |
| 2008Q2 |
28,619 |
5.2 |
$535,744,877 |
13.2 |
$1,440 |
7.5 |
| 2008Q3 |
30,037 |
9.2 |
$548,618,267 |
14.6 |
$1,405 |
4.9 |
| 2008Q4 |
30,372 |
9.7 |
$596,500,382 |
14.0 |
$1,511 |
4.0 |
| 2009Q1 |
28,114 |
0.3 |
$539,327,547 |
-0.1 |
$1,476 |
-0.3 |
| 2009Q2 |
25,238 |
-11.8 |
$440,852,731 |
-17.7 |
$1,344 |
-6.7 |
| 2009Q3 |
24,387 |
-18.8 |
$431,582,548 |
-21.3 |
$1,361 |
-3.1 |
| 2009Q4 |
24,125 |
-20.6 |
$458,821,228 |
-23.1 |
$1,463 |
-3.2 |
| 2010Q1 |
24,014 |
-14.6 |
$479,617,566 |
-11.1 |
$1,536 |
4.1 |
| 2010Q2 |
24,562 |
-2.7 |
$447,465,110 |
1.5 |
$1,401 |
4.3 |
| 2010Q3 |
25,688 |
5.3 |
$477,014,973 |
10.5 |
$1,428 |
4.9 |
| 2010Q4 |
26,128 |
8.3 |
$532,712,895 |
16.1 |
$1,568 |
7.2 |
| 2011Q1 |
26,182 |
9.0 |
$540,591,285 |
12.7 |
$1,588 |
3.4 |
| 2011Q2 |
26,772 |
9.0 |
$510,176,562 |
14.0 |
$1,466 |
4.6 |
| 2011Q3 |
27,998 |
9.0 |
$560,144,403 |
17.4 |
$1,539 |
7.7 |
| 2011Q4 |
28,585 |
9.4 |
$584,218,982 |
9.7 |
$1,572 |
0.2 |
| 2012Q1 |
28,178 |
7.6 |
$617,397,445 |
14.2 |
$1,685 |
6.1 |
| 2012Q2 |
27,830 |
4.0 |
$545,527,221 |
6.9 |
$1,508 |
2.9 |
| 2012Q3 |
27,506 |
-1.8 |
$548,024,809 |
-2.2 |
$1,533 |
-0.4 |
| 2012Q4 |
27,307 |
-4.5 |
$581,790,169 |
-0.4 |
$1,639 |
4.2 |
| 2013Q1 |
26,477 |
-6.0 |
$578,160,686 |
-6.4 |
$1,680 |
-0.3 |
| 2013Q2 |
26,397 |
-5.1 |
$536,731,909 |
-1.6 |
$1,564 |
3.7 |
| 2013Q3 |
26,757 |
-2.7 |
$551,650,116 |
0.7 |
$1,586 |
3.5 |
| 2013Q4 |
26,823 |
-1.8 |
$593,146,617 |
2.0 |
$1,701 |
3.8 |
| 2014Q1 |
26,818 |
1.3 |
$608,739,995 |
5.3 |
$1,746 |
4.0 |
| 2014Q2 |
27,024 |
2.4 |
$571,869,128 |
6.5 |
$1,628 |
4.1 |
| 2014Q3 |
27,587 |
3.1 |
$588,456,023 |
6.7 |
$1,641 |
3.5 |
| 2014Q4 |
27,708 |
3.3 |
$637,365,029 |
7.5 |
$1,769 |
4.0 |
| 2015Q1 |
26,527 |
-1.1 |
$612,932,840 |
0.7 |
$1,777 |
1.8 |
| 2015Q2 |
23,845 |
-11.8 |
$505,180,513 |
-11.7 |
$1,630 |
0.1 |
| 2015Q3 |
23,023 |
-16.5 |
$476,917,847 |
-19.0 |
$1,593 |
-2.9 |
| 2015Q4 |
22,046 |
-20.4 |
$499,432,081 |
-21.6 |
$1,743 |
-1.5 |
| 2016Q1 |
20,434 |
-23.0 |
$436,003,345 |
-28.9 |
$1,641 |
-7.7 |
| 2016Q2 |
18,429 |
-22.7 |
$378,690,011 |
-25.0 |
$1,581 |
-3.0 |
| 2016Q3 |
17,961 |
-22.0 |
$374,336,226 |
-21.5 |
$1,603 |
0.6 |
| 2016Q4 |
18,285 |
-17.1 |
$396,511,627 |
-20.6 |
$1,668 |
-4.3 |
| 2017Q1 |
18,685 |
-8.6 |
$425,807,331 |
-2.3 |
$1,753 |
6.8 |
| 2017Q2 |
19,318 |
4.8 |
$412,220,015 |
8.9 |
$1,641 |
3.8 |
| 2017Q3 |
19,955 |
11.1 |
$424,110,107 |
13.3 |
$1,635 |
2.0 |
| 2017Q4 |
20,568 |
12.5 |
$459,219,071 |
15.8 |
$1,717 |
3.0 |
| 2018Q1 |
20,491 |
9.7 |
$480,930,478 |
12.9 |
$1,805 |
3.0 |
| 2018Q2 |
20,374 |
5.5 |
$444,665,368 |
7.9 |
$1,679 |
2.3 |
| 2018Q3 |
20,830 |
4.4 |
$454,614,551 |
7.2 |
$1,679 |
2.7 |
| 2018Q4 |
21,078 |
2.5 |
$486,466,644 |
5.9 |
$1,775 |
3.4 |
| 2019Q1 |
20,997 |
2.5 |
$517,500,454 |
7.6 |
$1,896 |
5.0 |
| 2019Q2 |
20,913 |
2.6 |
$462,967,360 |
4.1 |
$1,703 |
1.4 |
| 2019Q3 |
20,661 |
-0.8 |
$460,659,942 |
1.3 |
$1,715 |
2.2 |
| 2019Q4 |
20,484 |
-2.8 |
$492,815,850 |
1.3 |
$1,851 |
4.2 |
| 2020Q1 |
19,696 |
-6.2 |
$468,315,533 |
-9.5 |
$1,829 |
-3.5 |
| 2020Q2 |
16,372 |
-21.7 |
$358,359,105 |
-22.6 |
$1,684 |
-1.1 |
| 2020Q3 |
14,670 |
-29.0 |
$310,884,198 |
-32.5 |
$1,630 |
-5.0 |
| 2020Q4 |
14,560 |
-28.9 |
$345,469,987 |
-29.9 |
$1,825 |
-1.4 |
| 2021Q1 |
14,216 |
-27.8 |
$329,677,391 |
-29.6 |
$1,784 |
-2.5 |
| 2021Q2 |
14,479 |
-11.6 |
$325,866,350 |
-9.1 |
$1,731 |
2.8 |
| 2021Q3 |
14,922 |
1.7 |
$339,788,354 |
9.3 |
$1,752 |
7.5 |
| 2021Q4 |
15,411 |
5.8 |
$389,304,168 |
12.7 |
$1,943 |
6.5 |
| 2022Q1 |
15,636 |
10.0 |
$390,122,290 |
18.3 |
$1,919 |
7.6 |
| 2022Q2 |
16,114 |
11.3 |
$388,755,244 |
19.3 |
$1,856 |
7.2 |
| 2022Q3 |
16,561 |
11.0 |
$416,450,543 |
22.6 |
$1,934 |
10.4 |
| 2022Q4 |
16,877 |
9.5 |
$428,584,047 |
10.1 |
$1,953 |
0.5 |
| 2023Q1 |
16,972 |
8.5 |
$475,109,071 |
21.8 |
$2,153 |
12.2 |
| 2023Q2 |
17,072 |
5.9 |
$427,369,310 |
9.9 |
$1,926 |
3.8 |
| 2023Q3 |
17,165 |
3.6 |
$432,498,225 |
3.9 |
$1,938 |
0.2 |
| 2023Q4 |
17,095 |
1.3 |
$451,020,470 |
5.2 |
$2,030 |
3.9 |
| 2024Q1 |
16,136 |
-4.9 |
$444,292,358 |
-6.5 |
$2,118 |
-1.6 |
| 2024Q2 |
16,033 |
-6.1 |
$404,699,163 |
-5.3 |
$1,942 |
0.8 |
| 2024Q3 |
16,091 |
-6.3 |
$415,678,013 |
-3.9 |
$1,987 |
2.5 |
| 2024Q4 |
15,977 |
-6.5 |
$447,774,730 |
-0.7 |
$2,156 |
6.2 |
| 2025Q1 |
15,628 |
-3.1 |
$438,112,310 |
-1.4 |
$2,156 |
1.8 |
| 2025Q2b |
15,716 |
-2.0 |
$418,819,518 |
3.5 |
$2,050 |
5.6 |
|
|
|
|
|
|
|
| aNorth American Industry Classification System. |
|
|
|
|
| bPreliminary. |
|
|
|
|
|
|
| Source: Quarterly Census of Employment and Wages. |
|
|
|
|
| Prepared by M. Moore, Research & Planning, WY DWS, 1/9/26. |
|
|
|
|
Figure: Average Monthly Employment in Mining, Including Oil & Gas (NAICS 21) in Wyoming, 2001Q1-2025Q2
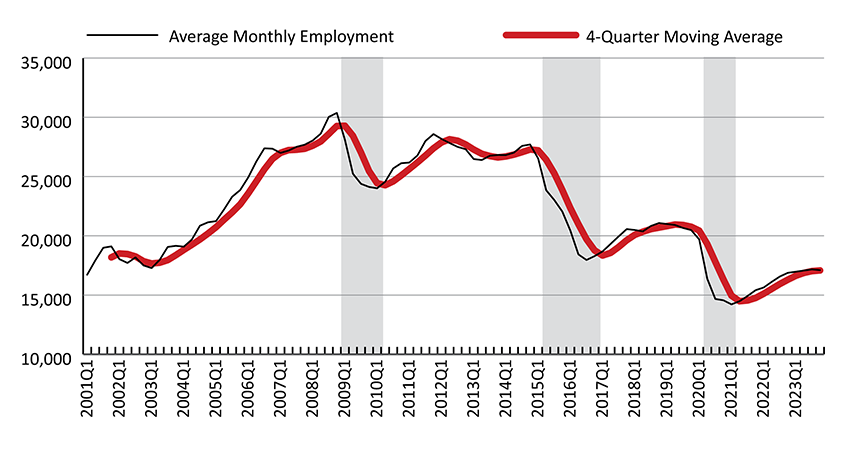
Figure: Over-the-Year Percent Change in Average Monthly Employment and Total Wages in Mining, Including Oil & Gas (NAICS 21) in Wyoming, 2002Q1-2025Q2
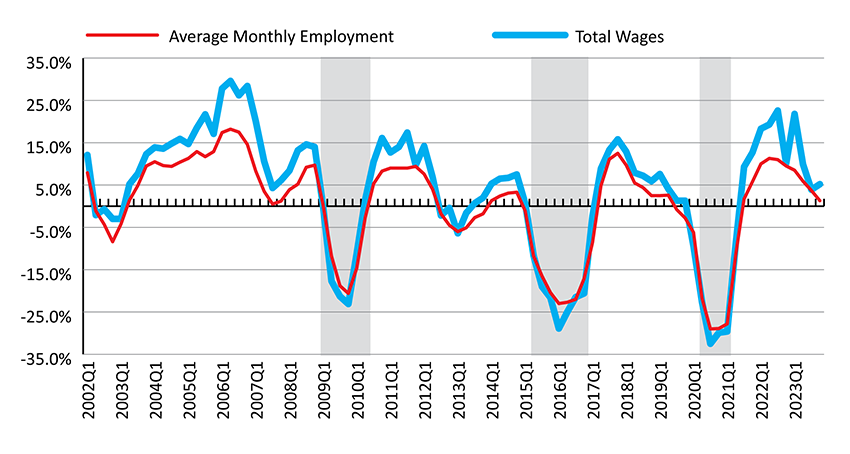
*Changes in employment in mining in 2024 were due in part to non-economic code changes.
Shaded areas indicate periods of economic downturn: 2009Q1-2010Q1, 2015Q2-2016Q4, and 2020Q2-2021Q1.
Source: Quarterly Census of Employment and Wages.
Prepared by M. Moore, Research & Planning, WY DWS, 1/9/26.
 Hire Wyo