Wyoming QCEW Summary Statistics by Industry, 2001-2025
Manufacturing (NAICSa 31-33), 2025Q3
Average Monthly Employment: 10,586
Total Wages: $208,311,105
Average Weekly Wage: $1,514
North American Industry Classification System.
Published April 2026.
| Table: Over-the-Year Change in Private Manufacturing Sector (NAICSa Sectors 31-33) Average Monthly Employment (AME), Total Wages, and Average Weekly Wage (AWW) Changes by Year/Quarter in Wyoming |
| Published April 2026. |
|
|
|
|
|
|
|
|
|
|
|
|
|
Average Monthly Employment |
Total Wages |
Average Weekly Wage |
| Year/Quarter |
N |
% Change |
$ |
% Change |
$ |
% Change |
| 2001Q1 |
10,192 |
|
$94,608,033 |
|
$714 |
|
| 2001Q2 |
9,956 |
|
$89,878,326 |
|
$694 |
|
| 2001Q3 |
10,063 |
|
$90,598,192 |
|
$693 |
|
| 2001Q4 |
10,203 |
|
$95,374,857 |
|
$719 |
|
| 2002Q1 |
9,309 |
-8.7 |
$88,110,112 |
-6.9 |
$728 |
2.0 |
| 2002Q2 |
9,384 |
-5.7 |
$85,383,662 |
-5.0 |
$700 |
0.8 |
| 2002Q3 |
9,509 |
-5.5 |
$87,579,563 |
-3.3 |
$708 |
2.3 |
| 2002Q4 |
9,672 |
-5.2 |
$87,868,965 |
-7.9 |
$699 |
-2.8 |
| 2003Q1 |
8,934 |
-4.0 |
$84,901,816 |
-3.6 |
$731 |
0.4 |
| 2003Q2 |
9,088 |
-3.2 |
$82,037,059 |
-3.9 |
$694 |
-0.8 |
| 2003Q3 |
9,344 |
-1.7 |
$87,856,772 |
0.3 |
$723 |
2.1 |
| 2003Q4 |
9,678 |
0.1 |
$93,109,807 |
6.0 |
$740 |
5.9 |
| 2004Q1 |
9,110 |
2.0 |
$87,394,240 |
2.9 |
$738 |
0.9 |
| 2004Q2 |
9,343 |
2.8 |
$87,615,334 |
6.8 |
$721 |
3.9 |
| 2004Q3 |
9,552 |
2.2 |
$95,378,958 |
8.6 |
$768 |
6.2 |
| 2004Q4 |
9,745 |
0.7 |
$98,521,911 |
5.8 |
$778 |
5.1 |
| 2005Q1 |
9,465 |
3.9 |
$94,172,844 |
7.8 |
$765 |
3.7 |
| 2005Q2 |
9,571 |
2.4 |
$94,863,350 |
8.3 |
$762 |
5.7 |
| 2005Q3 |
9,746 |
2.0 |
$99,278,309 |
4.1 |
$784 |
2.0 |
| 2005Q4 |
10,056 |
3.2 |
$105,765,074 |
7.4 |
$809 |
4.0 |
| 2006Q1 |
9,768 |
3.2 |
$102,679,847 |
9.0 |
$809 |
5.7 |
| 2006Q2 |
10,028 |
4.8 |
$104,939,691 |
10.6 |
$805 |
5.6 |
| 2006Q3 |
10,294 |
5.6 |
$106,054,518 |
6.8 |
$793 |
1.1 |
| 2006Q4 |
10,493 |
4.3 |
$117,479,634 |
11.1 |
$861 |
6.4 |
| 2007Q1 |
10,193 |
4.3 |
$114,480,756 |
11.5 |
$864 |
6.8 |
| 2007Q2 |
10,067 |
0.4 |
$113,304,410 |
8.0 |
$866 |
7.6 |
| 2007Q3 |
10,119 |
-1.7 |
$114,217,803 |
7.7 |
$868 |
9.6 |
| 2007Q4 |
10,331 |
-1.5 |
$123,757,922 |
5.3 |
$921 |
7.0 |
| 2008Q1 |
9,816 |
-3.7 |
$118,970,194 |
3.9 |
$932 |
7.9 |
| 2008Q2 |
9,855 |
-2.1 |
$116,581,552 |
2.9 |
$910 |
5.1 |
| 2008Q3 |
10,009 |
-1.1 |
$119,073,177 |
4.3 |
$915 |
5.4 |
| 2008Q4 |
10,169 |
-1.6 |
$130,916,566 |
5.8 |
$990 |
7.5 |
| 2009Q1 |
9,277 |
-5.5 |
$112,460,489 |
-5.5 |
$933 |
0.0 |
| 2009Q2 |
8,956 |
-9.1 |
$109,382,458 |
-6.2 |
$940 |
3.2 |
| 2009Q3 |
9,104 |
-9.0 |
$110,932,836 |
-6.8 |
$937 |
2.4 |
| 2009Q4 |
9,109 |
-10.4 |
$121,048,854 |
-7.5 |
$1,022 |
3.2 |
| 2010Q1 |
8,479 |
-8.6 |
$106,849,963 |
-5.0 |
$969 |
3.9 |
| 2010Q2 |
8,472 |
-5.4 |
$108,157,608 |
-1.1 |
$982 |
4.5 |
| 2010Q3 |
8,786 |
-3.5 |
$111,320,379 |
0.3 |
$975 |
4.0 |
| 2010Q4 |
9,115 |
0.1 |
$125,209,643 |
3.4 |
$1,057 |
3.4 |
| 2011Q1 |
8,701 |
2.6 |
$115,744,551 |
8.3 |
$1,023 |
5.6 |
| 2011Q2 |
8,940 |
5.5 |
$120,084,927 |
11.0 |
$1,033 |
5.2 |
| 2011Q3 |
9,320 |
6.1 |
$133,281,143 |
19.7 |
$1,100 |
12.9 |
| 2011Q4 |
9,741 |
6.9 |
$134,775,180 |
7.6 |
$1,064 |
0.7 |
| 2012Q1 |
9,140 |
5.0 |
$128,181,419 |
10.7 |
$1,079 |
5.4 |
| 2012Q2 |
9,162 |
2.5 |
$126,023,377 |
4.9 |
$1,058 |
2.4 |
| 2012Q3 |
9,440 |
1.3 |
$127,360,173 |
-4.4 |
$1,038 |
-5.7 |
| 2012Q4 |
9,681 |
-0.6 |
$141,255,292 |
4.8 |
$1,122 |
5.5 |
| 2013Q1 |
9,271 |
1.4 |
$132,487,032 |
3.4 |
$1,099 |
1.9 |
| 2013Q2 |
9,276 |
1.2 |
$131,435,367 |
4.3 |
$1,090 |
3.0 |
| 2013Q3 |
9,579 |
1.5 |
$134,765,732 |
5.8 |
$1,082 |
4.3 |
| 2013Q4 |
9,793 |
1.2 |
$145,789,323 |
3.2 |
$1,145 |
2.0 |
| 2014Q1 |
9,578 |
3.3 |
$148,008,822 |
11.7 |
$1,189 |
8.1 |
| 2014Q2 |
9,641 |
3.9 |
$142,248,705 |
8.2 |
$1,135 |
4.1 |
| 2014Q3 |
9,912 |
3.5 |
$145,638,794 |
8.1 |
$1,130 |
4.4 |
| 2014Q4 |
10,116 |
3.3 |
$158,320,419 |
8.6 |
$1,204 |
5.1 |
| 2015Q1 |
9,732 |
1.6 |
$154,210,768 |
4.2 |
$1,219 |
2.5 |
| 2015Q2 |
9,625 |
-0.2 |
$144,348,381 |
1.5 |
$1,154 |
1.6 |
| 2015Q3 |
9,827 |
-0.9 |
$151,358,541 |
3.9 |
$1,185 |
4.8 |
| 2015Q4 |
9,852 |
-2.6 |
$162,988,451 |
2.9 |
$1,273 |
5.7 |
| 2016Q1 |
9,275 |
-4.7 |
$151,793,365 |
-1.6 |
$1,259 |
3.3 |
| 2016Q2 |
9,072 |
-5.7 |
$141,660,642 |
-1.9 |
$1,201 |
4.1 |
| 2016Q3 |
9,256 |
-5.8 |
$148,607,088 |
-1.8 |
$1,235 |
4.2 |
| 2016Q4 |
9,315 |
-5.5 |
$148,794,544 |
-8.7 |
$1,229 |
-3.4 |
| 2017Q1 |
9,174 |
-1.1 |
$161,126,538 |
6.1 |
$1,351 |
7.3 |
| 2017Q2 |
9,102 |
0.3 |
$147,034,715 |
3.8 |
$1,243 |
3.4 |
| 2017Q3 |
9,550 |
3.2 |
$146,167,937 |
-1.6 |
$1,177 |
-4.7 |
| 2017Q4 |
9,693 |
4.1 |
$163,585,224 |
9.9 |
$1,298 |
5.7 |
| 2018Q1 |
9,441 |
2.9 |
$166,155,718 |
3.1 |
$1,354 |
0.2 |
| 2018Q2 |
9,490 |
4.3 |
$152,738,276 |
3.9 |
$1,238 |
-0.4 |
| 2018Q3 |
9,872 |
3.4 |
$158,390,052 |
8.4 |
$1,234 |
4.8 |
| 2018Q4 |
10,079 |
4.0 |
$174,579,667 |
6.7 |
$1,332 |
2.6 |
| 2019Q1 |
9,986 |
5.8 |
$179,784,595 |
8.2 |
$1,385 |
2.3 |
| 2019Q2 |
9,948 |
4.8 |
$165,256,850 |
8.2 |
$1,278 |
3.2 |
| 2019Q3 |
10,133 |
2.6 |
$166,288,185 |
5.0 |
$1,262 |
2.3 |
| 2019Q4 |
10,106 |
0.3 |
$179,015,532 |
2.5 |
$1,363 |
2.3 |
| 2020Q1 |
9,857 |
-1.3 |
$179,357,516 |
-0.2 |
$1,400 |
1.1 |
| 2020Q2 |
9,375 |
-5.8 |
$157,704,182 |
-4.6 |
$1,294 |
1.3 |
| 2020Q3 |
9,471 |
-6.5 |
$161,330,995 |
-3.0 |
$1,310 |
3.8 |
| 2020Q4 |
9,617 |
-4.8 |
$175,146,419 |
-2.2 |
$1,401 |
2.8 |
| 2021Q1 |
9,463 |
-4.0 |
$162,377,700 |
-9.5 |
$1,320 |
-5.7 |
| 2021Q2 |
9,650 |
2.9 |
$165,178,207 |
4.7 |
$1,317 |
1.8 |
| 2021Q3 |
9,972 |
5.3 |
$166,853,440 |
3.4 |
$1,287 |
-1.8 |
| 2021Q4 |
9,999 |
4.0 |
$185,704,008 |
6.0 |
$1,429 |
2.0 |
| 2022Q1 |
9,820 |
3.8 |
$213,182,921 |
31.3 |
$1,670 |
26.5 |
| 2022Q2 |
10,064 |
4.3 |
$179,077,414 |
8.4 |
$1,369 |
4.0 |
| 2022Q3 |
10,368 |
4.0 |
$194,047,461 |
16.3 |
$1,440 |
11.9 |
| 2022Q4 |
10,534 |
5.4 |
$209,582,064 |
12.9 |
$1,530 |
7.1 |
| 2023Q1 |
10,369 |
5.6 |
$195,328,292 |
-8.4 |
$1,449 |
-13.2 |
| 2023Q2 |
10,340 |
2.7 |
$183,904,396 |
2.7 |
$1,368 |
0.0 |
| 2023Q3 |
10,508 |
1.4 |
$207,464,080 |
6.9 |
$1,519 |
5.5 |
| 2023Q4 |
10,508 |
-0.2 |
$226,243,116 |
7.9 |
$1,656 |
8.2 |
| 2024Q1 |
10,297 |
-0.7 |
$202,758,647 |
3.8 |
$1,515 |
4.5 |
| 2024Q2 |
10,372 |
0.3 |
$197,012,933 |
7.1 |
$1,461 |
6.8 |
| 2024Q3 |
10,510 |
0.0 |
$202,911,138 |
-2.2 |
$1,485 |
-2.2 |
| 2024Q4 |
10,512 |
0.0 |
$221,144,367 |
-2.3 |
$1,618 |
-2.3 |
| 2025Q1 |
10,437 |
1.4 |
$212,933,279 |
5.0 |
$1,569 |
3.6 |
| 2025Q2 |
10,417 |
0.4 |
$211,150,392 |
7.2 |
$1,559 |
6.7 |
| 2025Q3b |
10,586 |
0.7 |
$208,311,105 |
2.7 |
$1,514 |
1.9 |
|
|
|
|
|
|
|
|
|
|
|
|
|
|
| aNorth American Industry Classification System. |
|
|
|
|
| bPreliminary. |
|
|
|
|
|
|
| Source: Quarterly Census of Employment and Wages. |
|
|
|
|
| Prepared by M. Moore, Research & Planning, WY DWS, 4/3/26. |
|
|
|
|
Figure: Average Monthly Employment in Manufacturing (NAICS 31-33) in Wyoming, 2001Q1-2025Q3
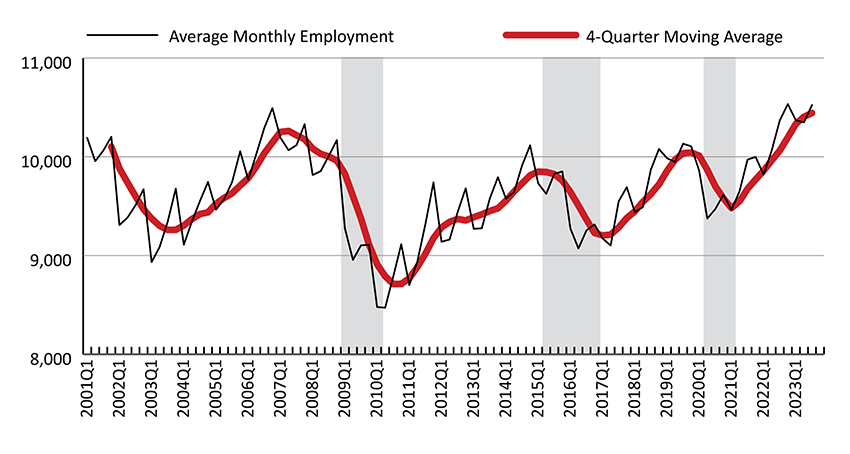
Figure: Over-the-Year Percent Change in Average Monthly Employment and Total Wages in Manufacturing (NAICS 31-33) in Wyoming, 2002Q1-2025Q3
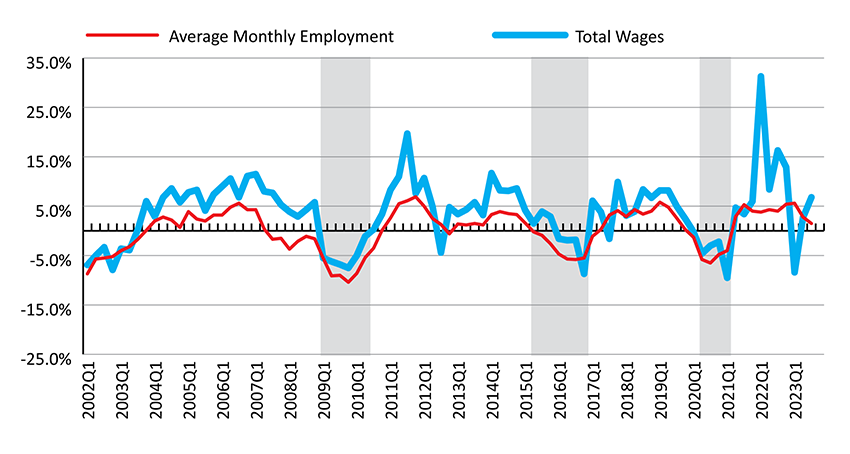
Shaded areas indicate periods of economic downturn: 2009Q1-2010Q1, 2015Q2-2016Q4, and 2020Q2-2021Q1.
Source: Quarterly Census of Employment and Wages.
Prepared by M. Moore, Research & Planning, WY DWS, 4/3/26.
 Hire Wyo