Wyoming QCEW Summary Statistics by Industry, 2001-2025
Local Government, 2025Q3
Local government includes Wyoming's counties, cities, towns, school districts, community colleges, tribal governments, and other municipalities.
Average Monthly Employment: 44,780
Total Wages: $654,977,997
Average Weekly Wage: $1,125
Published April 2026.
| Table: Over-the-Year Change in Local Government (Ownership 30) Average Monthly Employment (AME), Total Wages, and Average Weekly Wage (AWW) Changes by Year/Quarter in Wyoming |
| Published April 2026. |
|
|
|
|
|
|
|
|
|
|
|
|
|
Average Monthly Employment |
Total Wages |
Average Weekly Wage |
| Year/Quarter |
N |
% Change |
$ |
% Change |
$ |
% Change |
| 2001Q1 |
38,005 |
|
$229,711,690 |
|
$465 |
|
| 2001Q2 |
38,550 |
|
$264,026,837 |
|
$527 |
|
| 2001Q3 |
33,760 |
|
$209,128,099 |
|
$476 |
|
| 2001Q4 |
38,392 |
|
$252,171,936 |
|
$505 |
|
| 2002Q1 |
38,621 |
1.6 |
$252,806,827 |
10.1 |
$504 |
8.3 |
| 2002Q2 |
38,895 |
0.9 |
$289,663,960 |
9.7 |
$573 |
8.7 |
| 2002Q3 |
34,092 |
1.0 |
$221,356,264 |
5.8 |
$499 |
4.8 |
| 2002Q4 |
39,084 |
1.8 |
$268,074,524 |
6.3 |
$528 |
4.4 |
| 2003Q1 |
38,981 |
0.9 |
$264,570,375 |
4.7 |
$522 |
3.7 |
| 2003Q2 |
39,533 |
1.6 |
$300,493,024 |
3.7 |
$585 |
2.1 |
| 2003Q3 |
34,136 |
0.1 |
$234,134,135 |
5.8 |
$528 |
5.6 |
| 2003Q4 |
39,178 |
0.2 |
$279,580,513 |
4.3 |
$549 |
4.0 |
| 2004Q1 |
39,149 |
0.4 |
$273,015,356 |
3.2 |
$536 |
2.7 |
| 2004Q2 |
39,799 |
0.7 |
$309,880,133 |
3.1 |
$599 |
2.4 |
| 2004Q3 |
34,627 |
1.4 |
$249,673,191 |
6.6 |
$555 |
5.1 |
| 2004Q4 |
39,708 |
1.4 |
$297,692,752 |
6.5 |
$577 |
5.1 |
| 2005Q1 |
39,853 |
1.8 |
$290,069,798 |
6.2 |
$560 |
4.4 |
| 2005Q2 |
40,562 |
1.9 |
$332,844,944 |
7.4 |
$631 |
5.4 |
| 2005Q3 |
35,504 |
2.5 |
$275,227,479 |
10.2 |
$596 |
7.5 |
| 2005Q4 |
40,529 |
2.1 |
$323,606,294 |
8.7 |
$614 |
6.5 |
| 2006Q1 |
40,457 |
1.5 |
$317,186,455 |
9.3 |
$603 |
7.7 |
| 2006Q2 |
41,144 |
1.4 |
$370,824,362 |
11.4 |
$693 |
9.8 |
| 2006Q3 |
36,010 |
1.4 |
$296,097,747 |
7.6 |
$633 |
6.1 |
| 2006Q4 |
41,444 |
2.3 |
$363,479,744 |
12.3 |
$675 |
9.8 |
| 2007Q1 |
41,589 |
2.8 |
$364,379,389 |
14.9 |
$674 |
11.8 |
| 2007Q2 |
42,510 |
3.3 |
$421,336,800 |
13.6 |
$762 |
10.0 |
| 2007Q3 |
37,072 |
3.0 |
$329,676,850 |
11.3 |
$684 |
8.1 |
| 2007Q4 |
43,037 |
3.8 |
$399,654,862 |
10.0 |
$714 |
5.9 |
| 2008Q1 |
42,864 |
3.1 |
$394,810,660 |
8.4 |
$709 |
5.1 |
| 2008Q2 |
43,987 |
3.5 |
$453,156,428 |
7.6 |
$792 |
3.9 |
| 2008Q3 |
38,511 |
3.9 |
$364,509,373 |
10.6 |
$728 |
6.4 |
| 2008Q4 |
44,617 |
3.7 |
$435,559,605 |
9.0 |
$751 |
5.1 |
| 2009Q1 |
44,453 |
3.7 |
$421,697,720 |
6.8 |
$730 |
3.0 |
| 2009Q2 |
45,501 |
3.4 |
$484,582,203 |
6.9 |
$819 |
3.4 |
| 2009Q3 |
39,907 |
3.6 |
$383,224,875 |
5.1 |
$739 |
1.5 |
| 2009Q4 |
45,789 |
2.6 |
$457,990,787 |
5.1 |
$769 |
2.5 |
| 2010Q1 |
45,543 |
2.5 |
$433,154,208 |
2.7 |
$732 |
0.3 |
| 2010Q2 |
46,175 |
1.5 |
$496,047,145 |
2.4 |
$826 |
0.9 |
| 2010Q3 |
40,102 |
0.5 |
$393,151,311 |
2.6 |
$754 |
2.1 |
| 2010Q4 |
46,218 |
0.9 |
$464,159,631 |
1.3 |
$773 |
0.4 |
| 2011Q1 |
45,837 |
0.6 |
$439,145,064 |
1.4 |
$737 |
0.7 |
| 2011Q2 |
46,453 |
0.6 |
$508,561,758 |
2.5 |
$842 |
1.9 |
| 2011Q3 |
40,341 |
0.6 |
$404,986,174 |
3.0 |
$772 |
2.4 |
| 2011Q4 |
46,547 |
0.7 |
$468,743,727 |
1.0 |
$775 |
0.3 |
| 2012Q1 |
46,443 |
1.3 |
$462,483,449 |
5.3 |
$766 |
3.9 |
| 2012Q2 |
47,259 |
1.7 |
$520,042,351 |
2.3 |
$846 |
0.5 |
| 2012Q3 |
41,142 |
2.0 |
$413,273,670 |
2.0 |
$773 |
0.1 |
| 2012Q4 |
47,279 |
1.6 |
$483,517,830 |
3.2 |
$787 |
1.6 |
| 2013Q1 |
46,931 |
1.1 |
$471,327,477 |
1.9 |
$773 |
0.9 |
| 2013Q2 |
47,571 |
0.7 |
$530,230,102 |
2.0 |
$857 |
1.3 |
| 2013Q3 |
41,169 |
0.1 |
$422,772,886 |
2.3 |
$790 |
2.2 |
| 2013Q4 |
47,222 |
-0.1 |
$495,048,332 |
2.4 |
$806 |
2.5 |
| 2014Q1 |
46,794 |
-0.3 |
$477,265,694 |
1.3 |
$785 |
1.6 |
| 2014Q2 |
47,520 |
-0.1 |
$534,598,188 |
0.8 |
$865 |
0.9 |
| 2014Q3 |
41,717 |
1.3 |
$438,617,407 |
3.7 |
$809 |
2.4 |
| 2014Q4 |
47,289 |
0.1 |
$513,914,024 |
3.8 |
$836 |
3.7 |
| 2015Q1 |
46,760 |
-0.1 |
$488,605,217 |
2.4 |
$804 |
2.5 |
| 2015Q2 |
47,645 |
0.3 |
$545,245,384 |
2.0 |
$880 |
1.7 |
| 2015Q3 |
42,475 |
1.8 |
$459,291,021 |
4.7 |
$832 |
2.8 |
| 2015Q4 |
47,869 |
1.2 |
$536,403,322 |
4.4 |
$862 |
3.1 |
| 2016Q1 |
47,419 |
1.4 |
$502,929,100 |
2.9 |
$816 |
1.5 |
| 2016Q2 |
48,146 |
1.1 |
$559,653,628 |
2.6 |
$894 |
1.6 |
| 2016Q3 |
42,613 |
0.3 |
$475,701,922 |
3.6 |
$859 |
3.2 |
| 2016Q4 |
47,159 |
-1.5 |
$516,919,668 |
-3.6 |
$843 |
-2.2 |
| 2017Q1 |
46,761 |
-1.4 |
$508,934,416 |
1.2 |
$837 |
2.6 |
| 2017Q2 |
47,272 |
-1.8 |
$557,122,720 |
-0.5 |
$907 |
1.4 |
| 2017Q3 |
41,695 |
-2.2 |
$461,515,299 |
-3.0 |
$851 |
-0.8 |
| 2017Q4 |
46,320 |
-1.8 |
$519,597,307 |
0.5 |
$863 |
2.3 |
| 2018Q1 |
45,586 |
-2.5 |
$498,734,184 |
-2.0 |
$842 |
0.5 |
| 2018Q2 |
46,255 |
-2.1 |
$548,818,744 |
-1.5 |
$913 |
0.7 |
| 2018Q3 |
41,446 |
-0.6 |
$467,911,162 |
1.4 |
$868 |
2.0 |
| 2018Q4 |
45,868 |
-1.0 |
$523,443,835 |
0.7 |
$878 |
1.7 |
| 2019Q1 |
45,787 |
0.4 |
$512,822,641 |
2.8 |
$862 |
2.4 |
| 2019Q2 |
46,559 |
0.7 |
$558,909,927 |
1.8 |
$923 |
1.2 |
| 2019Q3 |
42,482 |
2.5 |
$485,340,065 |
3.7 |
$879 |
1.2 |
| 2019Q4 |
46,511 |
1.4 |
$547,497,347 |
4.6 |
$905 |
3.1 |
| 2020Q1 |
46,091 |
0.7 |
$528,393,615 |
3.0 |
$882 |
2.4 |
| 2020Q2 |
43,328 |
-6.9 |
$562,494,478 |
0.6 |
$999 |
8.1 |
| 2020Q3 |
40,754 |
-4.1 |
$489,730,842 |
0.9 |
$924 |
5.2 |
| 2020Q4 |
45,253 |
-2.7 |
$569,309,089 |
4.0 |
$968 |
6.9 |
| 2021Q1 |
44,836 |
-2.7 |
$530,279,805 |
0.4 |
$910 |
3.2 |
| 2021Q2 |
45,439 |
4.9 |
$581,978,882 |
3.5 |
$985 |
-1.3 |
| 2021Q3 |
41,352 |
1.5 |
$523,196,119 |
6.8 |
$973 |
5.3 |
| 2021Q4 |
45,062 |
-0.4 |
$585,573,818 |
2.9 |
$1,000 |
3.3 |
| 2022Q1 |
44,717 |
-0.3 |
$547,027,538 |
3.2 |
$941 |
3.4 |
| 2022Q2 |
45,089 |
-0.8 |
$596,080,023 |
2.4 |
$1,017 |
3.2 |
| 2022Q3 |
41,904 |
1.3 |
$558,841,037 |
6.8 |
$1,026 |
5.4 |
| 2022Q4 |
45,784 |
1.6 |
$602,996,065 |
3.0 |
$1,013 |
1.3 |
| 2023Q1 |
45,469 |
1.7 |
$591,245,312 |
8.1 |
$1,000 |
6.3 |
| 2023Q2 |
46,178 |
2.4 |
$631,730,855 |
6.0 |
$1,052 |
3.5 |
| 2023Q3 |
42,555 |
1.6 |
$575,622,427 |
3.0 |
$1,040 |
1.4 |
| 2023Q4 |
46,214 |
0.9 |
$628,218,102 |
4.2 |
$1,046 |
3.2 |
| 2024Q1 |
47,115 |
3.6 |
$646,307,041 |
9.3 |
$1,055 |
5.5 |
| 2024Q2 |
47,607 |
3.1 |
$678,063,808 |
7.3 |
$1,096 |
4.1 |
| 2024Q3 |
44,563 |
4.7 |
$633,264,811 |
10.0 |
$1,093 |
5.1 |
| 2024Q4 |
47,778 |
3.4 |
$674,628,782 |
7.4 |
$1,086 |
3.9 |
| 2025Q1 |
47,678 |
1.2 |
$671,062,264 |
3.8 |
$1,083 |
2.6 |
| 2025Q2 |
48,090 |
1.0 |
$707,875,310 |
4.4 |
$1,132 |
3.3 |
| 2025Q3b |
44,780 |
0.5 |
$654,977,997 |
3.4 |
$1,125 |
2.9 |
|
|
|
|
|
|
|
|
|
|
|
|
|
|
| aPreliminary. |
|
|
|
|
|
|
| Source: Quarterly Census of Employment and Wages. |
|
|
|
|
| Prepared by M. Moore, Research & Planning, WY DWS, 4/3/26. |
|
|
|
|
Figure: Average Monthly Employment in Local Government in Wyoming, 2001Q1-2025Q3
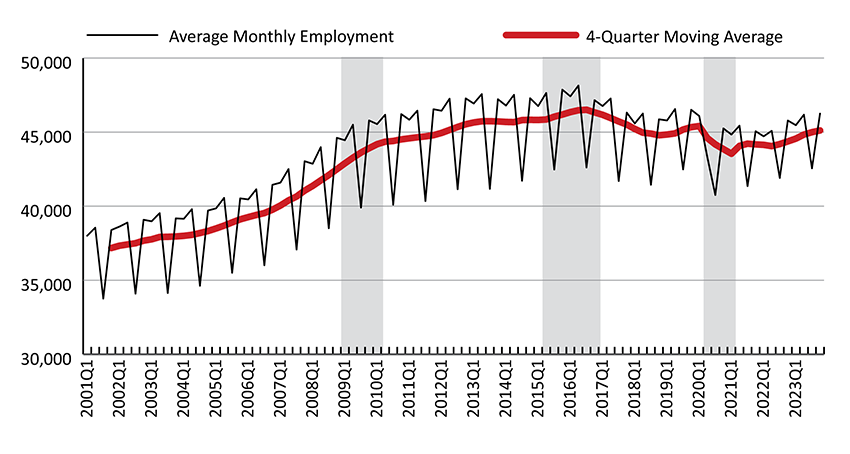
Figure: Over-the-Year Percent Change in Average Monthly Employment and Total Wages in Local Government in Wyoming, 2002Q1-2025Q3
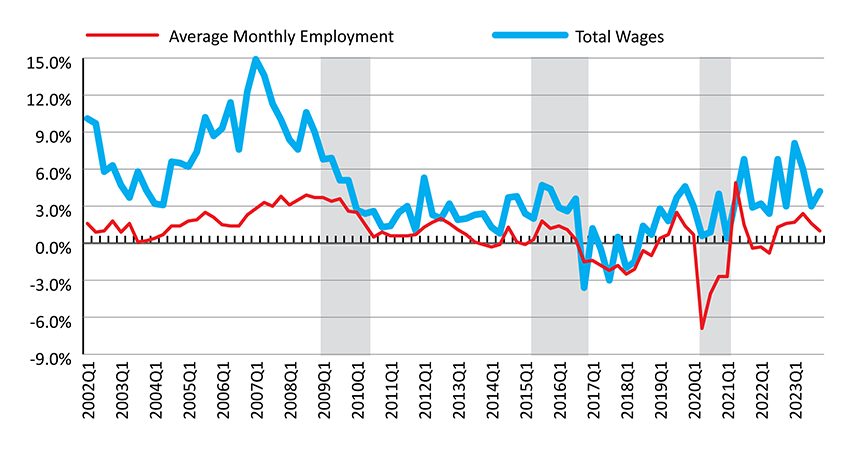
Shaded areas indicate periods of economic downturn: 2009Q1-2010Q1, 2015Q2-2016Q4, and 2020Q2-2021Q1.
Source: Quarterly Census of Employment and Wages.
Prepared by M. Moore, Research & Planning, WY DWS, 4/3/26.
 Hire Wyo