Wyoming QCEW Summary Statistics by Industry, 2001-2025
Federal Government, 2025Q3
Average Monthly Employment: 8,221
Total Wages: $208,209,822
Average Weekly Wage: $1,948
Published April 2026.
| Table: Over-the-Year Change in Federal Government (Ownership 10) Average Monthly Employment (AME), Total Wages, and Average Weekly Wage (AWW) Changes by Year/Quarter in Wyoming |
| Published April 2026. |
|
|
|
|
|
|
|
|
|
|
|
|
|
Average Monthly Employment |
Total Wages |
Average Weekly Wage |
| Year/Quarter |
N |
% Change |
$ |
% Change |
$ |
% Change |
| 2001Q1 |
6,684 |
|
$70,690,435 |
|
$814 |
|
| 2001Q2 |
7,323 |
|
$75,577,467 |
|
$794 |
|
| 2001Q3 |
8,130 |
|
$82,543,364 |
|
$781 |
|
| 2001Q4 |
7,345 |
|
$78,194,341 |
|
$819 |
|
| 2002Q1 |
6,813 |
1.9 |
$72,227,671 |
2.2 |
$815 |
0.2 |
| 2002Q2 |
7,385 |
0.8 |
$78,393,782 |
3.7 |
$817 |
2.9 |
| 2002Q3 |
8,275 |
1.8 |
$85,769,132 |
3.9 |
$797 |
2.1 |
| 2002Q4 |
7,651 |
4.2 |
$86,758,881 |
11.0 |
$872 |
6.5 |
| 2003Q1 |
7,115 |
4.4 |
$78,793,240 |
9.1 |
$852 |
4.5 |
| 2003Q2 |
7,665 |
3.8 |
$83,664,283 |
6.7 |
$840 |
2.8 |
| 2003Q3 |
8,411 |
1.6 |
$92,976,518 |
8.4 |
$850 |
6.7 |
| 2003Q4 |
7,370 |
-3.7 |
$87,708,753 |
1.1 |
$915 |
4.9 |
| 2004Q1 |
7,126 |
0.1 |
$86,675,439 |
10.0 |
$936 |
9.8 |
| 2004Q2 |
7,660 |
-0.1 |
$91,742,867 |
9.7 |
$921 |
9.7 |
| 2004Q3 |
8,283 |
-1.5 |
$101,546,378 |
9.2 |
$943 |
10.9 |
| 2004Q4 |
7,345 |
-0.3 |
$88,483,508 |
0.9 |
$927 |
1.2 |
| 2005Q1 |
7,066 |
-0.8 |
$87,665,482 |
1.1 |
$954 |
2.0 |
| 2005Q2 |
7,544 |
-1.5 |
$92,768,258 |
1.1 |
$946 |
2.7 |
| 2005Q3 |
8,044 |
-2.9 |
$101,407,629 |
-0.1 |
$970 |
2.8 |
| 2005Q4 |
7,138 |
-2.8 |
$91,271,128 |
3.2 |
$984 |
6.2 |
| 2006Q1 |
6,838 |
-3.2 |
$92,159,112 |
5.1 |
$1,037 |
8.6 |
| 2006Q2 |
7,306 |
-3.2 |
$93,613,677 |
0.9 |
$986 |
4.2 |
| 2006Q3 |
7,934 |
-1.4 |
$105,025,983 |
3.6 |
$1,018 |
5.0 |
| 2006Q4 |
7,031 |
-1.5 |
$94,049,076 |
3.0 |
$1,029 |
4.6 |
| 2007Q1 |
6,762 |
-1.1 |
$92,791,719 |
0.7 |
$1,056 |
1.8 |
| 2007Q2 |
7,271 |
-0.5 |
$98,882,800 |
5.6 |
$1,046 |
6.1 |
| 2007Q3 |
7,935 |
0.0 |
$108,189,333 |
3.0 |
$1,049 |
3.0 |
| 2007Q4 |
7,053 |
0.3 |
$102,922,694 |
9.4 |
$1,122 |
9.1 |
| 2008Q1 |
6,835 |
1.1 |
$91,237,591 |
-1.7 |
$1,027 |
-2.7 |
| 2008Q2 |
7,567 |
4.1 |
$106,573,884 |
7.8 |
$1,083 |
3.6 |
| 2008Q3 |
8,116 |
2.3 |
$108,889,769 |
0.6 |
$1,032 |
-1.6 |
| 2008Q4 |
7,197 |
2.0 |
$111,253,138 |
8.1 |
$1,189 |
5.9 |
| 2009Q1 |
7,069 |
3.4 |
$96,713,510 |
6.0 |
$1,052 |
2.5 |
| 2009Q2 |
8,158 |
7.8 |
$112,642,675 |
5.7 |
$1,062 |
-2.0 |
| 2009Q3 |
8,431 |
3.9 |
$113,216,550 |
4.0 |
$1,033 |
0.1 |
| 2009Q4 |
7,398 |
2.8 |
$116,423,239 |
4.6 |
$1,211 |
1.8 |
| 2010Q1 |
7,370 |
4.2 |
$97,559,636 |
0.9 |
$1,018 |
-3.2 |
| 2010Q2 |
8,775 |
7.6 |
$120,502,377 |
7.0 |
$1,056 |
-0.5 |
| 2010Q3 |
8,735 |
3.6 |
$111,571,795 |
-1.5 |
$983 |
-4.9 |
| 2010Q4 |
7,429 |
0.4 |
$116,609,905 |
0.2 |
$1,207 |
-0.3 |
| 2011Q1 |
7,212 |
-2.1 |
$98,387,438 |
0.8 |
$1,049 |
3.0 |
| 2011Q2 |
7,830 |
-10.8 |
$118,973,532 |
-1.3 |
$1,169 |
10.7 |
| 2011Q3 |
8,360 |
-4.3 |
$119,879,493 |
7.4 |
$1,103 |
12.3 |
| 2011Q4 |
7,309 |
-1.6 |
$111,013,739 |
-4.8 |
$1,168 |
-3.2 |
| 2012Q1 |
7,021 |
-2.7 |
$105,396,622 |
7.1 |
$1,155 |
10.0 |
| 2012Q2 |
7,669 |
-2.0 |
$110,024,493 |
-7.5 |
$1,104 |
-5.6 |
| 2012Q3 |
8,124 |
-2.8 |
$120,392,249 |
0.4 |
$1,140 |
3.3 |
| 2012Q4 |
7,274 |
-0.5 |
$108,899,760 |
-1.9 |
$1,152 |
-1.4 |
| 2013Q1 |
6,981 |
-0.6 |
$104,670,713 |
-0.7 |
$1,153 |
-0.1 |
| 2013Q2 |
7,522 |
-1.9 |
$108,619,546 |
-1.3 |
$1,111 |
0.7 |
| 2013Q3 |
7,979 |
-1.8 |
$119,355,143 |
-0.9 |
$1,151 |
0.9 |
| 2013Q4 |
7,129 |
-2.0 |
$99,289,364 |
-8.8 |
$1,071 |
-7.0 |
| 2014Q1 |
6,938 |
-0.6 |
$107,982,895 |
3.2 |
$1,197 |
3.8 |
| 2014Q2 |
7,449 |
-1.0 |
$106,185,864 |
-2.2 |
$1,097 |
-1.3 |
| 2014Q3 |
7,884 |
-1.2 |
$126,068,564 |
5.6 |
$1,230 |
6.9 |
| 2014Q4 |
7,075 |
-0.8 |
$100,613,417 |
1.3 |
$1,094 |
2.1 |
| 2015Q1 |
6,807 |
-1.9 |
$113,872,312 |
5.5 |
$1,287 |
7.5 |
| 2015Q2 |
7,423 |
-0.4 |
$104,246,599 |
-1.8 |
$1,080 |
-1.5 |
| 2015Q3 |
7,965 |
1.0 |
$132,132,967 |
4.8 |
$1,276 |
3.7 |
| 2015Q4 |
7,185 |
1.6 |
$107,319,802 |
6.7 |
$1,149 |
5.0 |
| 2016Q1 |
6,980 |
2.5 |
$110,568,781 |
-2.9 |
$1,219 |
-5.3 |
| 2016Q2 |
7,614 |
2.6 |
$107,408,001 |
3.0 |
$1,085 |
0.4 |
| 2016Q3 |
8,120 |
1.9 |
$138,857,997 |
5.1 |
$1,315 |
3.1 |
| 2016Q4 |
7,301 |
1.6 |
$115,912,769 |
8.0 |
$1,221 |
6.3 |
| 2017Q1 |
7,057 |
1.1 |
$114,885,376 |
3.9 |
$1,252 |
2.8 |
| 2017Q2 |
7,571 |
-0.6 |
$119,308,900 |
11.1 |
$1,212 |
11.7 |
| 2017Q3 |
8,189 |
0.8 |
$134,978,365 |
-2.8 |
$1,268 |
-3.6 |
| 2017Q4 |
7,269 |
-0.4 |
$119,709,144 |
3.3 |
$1,267 |
3.7 |
| 2018Q1 |
6,990 |
-0.9 |
$116,859,078 |
1.7 |
$1,286 |
2.7 |
| 2018Q2 |
7,596 |
0.3 |
$123,666,423 |
3.7 |
$1,252 |
3.3 |
| 2018Q3 |
8,164 |
-0.3 |
$137,277,333 |
1.7 |
$1,293 |
2.0 |
| 2018Q4 |
7,328 |
0.8 |
$132,921,532 |
11.0 |
$1,395 |
10.1 |
| 2019Q1 |
7,082 |
1.3 |
$116,739,345 |
-0.1 |
$1,268 |
-1.4 |
| 2019Q2 |
7,702 |
1.4 |
$127,483,365 |
3.1 |
$1,273 |
1.7 |
| 2019Q3 |
8,107 |
-0.7 |
$138,305,330 |
0.7 |
$1,312 |
1.5 |
| 2019Q4 |
7,334 |
0.1 |
$135,031,514 |
1.6 |
$1,416 |
1.5 |
| 2020Q1 |
7,172 |
1.3 |
$118,670,113 |
1.7 |
$1,273 |
0.4 |
| 2020Q2 |
7,772 |
0.9 |
$141,879,496 |
11.3 |
$1,404 |
10.3 |
| 2020Q3 |
8,576 |
5.8 |
$137,461,571 |
-0.6 |
$1,233 |
-6.0 |
| 2020Q4 |
7,618 |
3.9 |
$149,611,290 |
10.8 |
$1,511 |
6.7 |
| 2021Q1 |
7,231 |
0.8 |
$122,678,886 |
3.4 |
$1,305 |
2.5 |
| 2021Q2 |
7,834 |
0.8 |
$147,709,609 |
4.1 |
$1,450 |
3.3 |
| 2021Q3 |
8,157 |
-4.9 |
$140,978,616 |
2.6 |
$1,329 |
7.8 |
| 2021Q4 |
7,394 |
-2.9 |
$149,396,260 |
-0.1 |
$1,554 |
2.9 |
| 2022Q1 |
7,117 |
-1.6 |
$125,830,554 |
2.6 |
$1,360 |
4.2 |
| 2022Q2 |
7,657 |
-2.3 |
$156,079,861 |
5.7 |
$1,568 |
8.1 |
| 2022Q3 |
8,064 |
-1.1 |
$158,092,723 |
12.1 |
$1,508 |
13.4 |
| 2022Q4 |
7,420 |
0.4 |
$148,128,424 |
-0.8 |
$1,536 |
-1.2 |
| 2023Q1 |
7,312 |
2.7 |
$150,220,251 |
19.4 |
$1,580 |
16.2 |
| 2023Q2 |
7,959 |
3.9 |
$159,802,942 |
2.4 |
$1,544 |
-1.5 |
| 2023Q3 |
8,402 |
4.2 |
$174,628,529 |
10.5 |
$1,599 |
6.0 |
| 2023Q4 |
7,811 |
5.3 |
$168,190,772 |
13.5 |
$1,656 |
7.9 |
| 2024Q1 |
7,727 |
5.7 |
$169,000,207 |
12.5 |
$1,682 |
6.5 |
| 2024Q2 |
8,259 |
3.8 |
$177,437,104 |
11.0 |
$1,653 |
7.0 |
| 2024Q3 |
8,531 |
1.5 |
$197,760,176 |
13.2 |
$1,783 |
11.5 |
| 2024Q4 |
7,909 |
1.2 |
$176,858,113 |
5.2 |
$1,720 |
3.9 |
| 2025Q1 |
7,610 |
-1.5 |
$172,891,975 |
2.3 |
$1,748 |
3.9 |
| 2025Q2 |
7,958 |
-3.6 |
$173,119,439 |
-2.4 |
$1,673 |
1.3 |
| 2025Q3b |
8,221 |
-3.6 |
$208,209,822 |
5.3 |
$1,948 |
9.3 |
|
|
|
|
|
|
|
|
|
|
|
|
|
|
| aPreliminary. |
|
|
|
|
|
|
| Source: Quarterly Census of Employment and Wages. |
|
|
|
|
| Prepared by M. Moore, Research & Planning, WY DWS, 4/3/26. |
|
|
|
|
Figure: Average Monthly Employment in Federal Government in Wyoming, 2001Q1-2025Q3
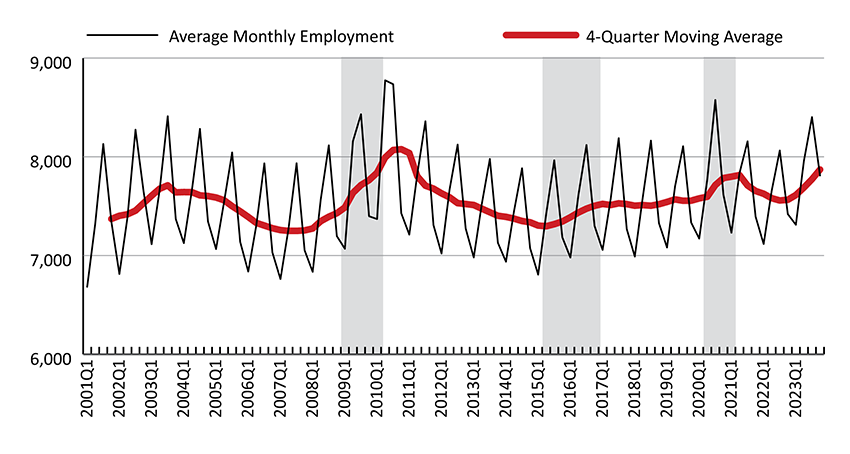
Figure: Over-the-Year Percent Change in Average Monthly Employment and Total Wages in Federal Government in Wyoming, 2002Q1-2025Q3
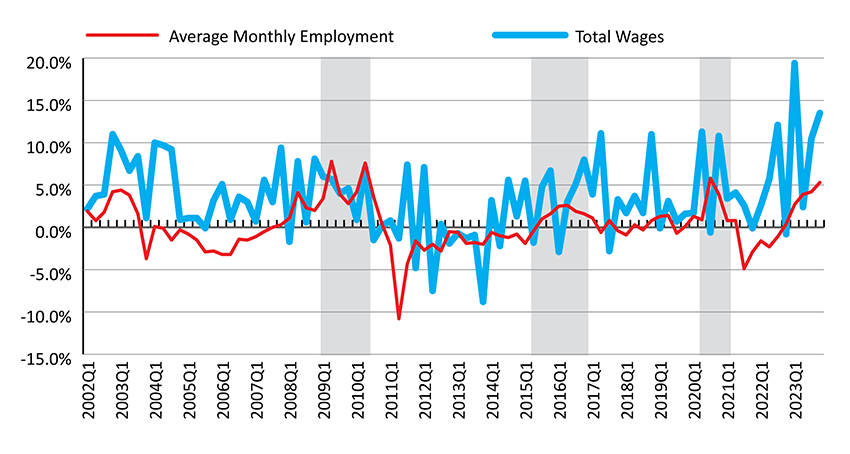
Shaded areas indicate periods of economic downturn: 2009Q1-2010Q1, 2015Q2-2016Q4, and 2020Q2-2021Q1.
Source: Quarterly Census of Employment and Wages.
Prepared by M. Moore, Research & Planning, WY DWS, 4/3/26.
 Hire Wyo