Wyoming Quarterly Census of Employment and Wages (QCEW), Second Quarter 2022 (2022Q2)
Download Microsoft Excel Spreadsheet
2022Q2 News Release
Other Services, Except Public Administration (NAICS 81)
| Table 49: Wyoming Covered Employment, Total Wages, & Average Weekly Wages in Other Services, Except Public Administration (NAICS 81), Second Quarter 2021 & 2022a |
|
|
|
|
|
|
|
|
|
|
|
|
|
|
|
|
Average Monthly Employment |
Total Wages |
Average Weekly Wage |
|
|
|
|
Change |
|
|
Change |
|
|
Change |
| NAICSb Code |
Ownership and Industry |
2022Q2 |
2021Q2 |
N |
% |
2022Q2 |
2021Q2 |
$ |
% |
2022Q2 |
2021Q2 |
$ |
% |
| 81 |
Other Services, Except Public Administration - Private |
7,069 |
6,975 |
94 |
1.3 |
$79,866,366 |
$70,539,709 |
$9,326,657 |
13.2 |
$869 |
$778 |
$91 |
11.7 |
| 811 |
Repair & Maintenance |
3,447 |
3,268 |
179 |
5.5 |
$47,483,824 |
$40,563,548 |
$6,920,276 |
17.1 |
$1,060 |
$955 |
$105 |
11.0 |
| 8111 |
Automotive Repair & Maintenance |
2,281 |
2,216 |
65 |
2.9 |
$24,552,973 |
$22,456,081 |
$2,096,892 |
9.3 |
$828 |
$780 |
$48 |
6.2 |
| 8112 |
Electronic & Precision Equipment Repair & Maintenance |
100 |
96 |
4 |
3.8 |
$1,941,566 |
$1,862,972 |
$78,594 |
4.2 |
$1,494 |
$1,488 |
$6 |
0.4 |
| 8113 |
Commercial Machinery Repair & Maintenance |
996 |
883 |
113 |
12.8 |
$20,380,154 |
$15,646,772 |
$4,733,382 |
30.3 |
$1,574 |
$1,364 |
$210 |
15.4 |
| 8114 |
Household Goods Repair & Maintenance |
69 |
73 |
-3 |
-4.6 |
$609,131 |
$597,723 |
$11,408 |
1.9 |
$676 |
$633 |
$43 |
6.8 |
| 812 |
Personal & Laundry Services |
1,526 |
1,567 |
-41 |
-2.6 |
$11,410,931 |
$10,893,192 |
$517,739 |
4.8 |
$575 |
$535 |
$41 |
7.6 |
| 8121 |
Personal Care Services |
538 |
583 |
-45 |
-7.7 |
$3,930,512 |
$4,128,983 |
-$198,471 |
-4.8 |
$562 |
$544 |
$17 |
3.2 |
| 8122 |
Death Care Services |
239 |
234 |
5 |
2.1 |
$1,920,008 |
$1,630,170 |
$289,838 |
17.8 |
$617 |
$535 |
$82 |
15.3 |
| 8123 |
Drycleaning & Laundry Services |
377 |
397 |
-20 |
-5.0 |
$3,240,712 |
$3,179,709 |
$61,003 |
1.9 |
$662 |
$617 |
$45 |
7.3 |
| 8129 |
Other Personal Services |
371 |
353 |
19 |
5.3 |
$2,319,699 |
$1,954,330 |
$365,369 |
18.7 |
$481 |
$426 |
$54 |
12.7 |
| 813 |
Membership Associations & Organizations |
1,824 |
1,837 |
-12 |
-0.7 |
$18,200,754 |
$16,481,266 |
$1,719,488 |
10.4 |
$767 |
$690 |
$77 |
11.2 |
| 8131 |
Religious Organizations |
57 |
44 |
13 |
29.3 |
$475,411 |
$328,611 |
$146,800 |
44.7 |
$638 |
$570 |
$68 |
11.9 |
| 8132 |
Grantmaking & Giving Services |
176 |
156 |
21 |
13.3 |
$2,927,873 |
$2,309,932 |
$617,941 |
26.8 |
$1,277 |
$1,141 |
$136 |
11.9 |
| 8133 |
Social Advocacy Organizations |
436 |
430 |
5 |
1.2 |
$5,676,162 |
$5,172,253 |
$503,909 |
9.7 |
$1,002 |
$925 |
$78 |
8.4 |
| 8134 |
Civic & Social Organizations |
637 |
670 |
-33 |
-5.0 |
$2,676,936 |
$2,617,823 |
$59,113 |
2.3 |
$323 |
$301 |
$23 |
7.6 |
| 8139 |
Professional & Similar Organizations |
518 |
536 |
-18 |
-3.4 |
$6,444,372 |
$6,052,647 |
$391,725 |
6.5 |
$956 |
$868 |
$88 |
10.2 |
| 814 |
Private Households |
272 |
304 |
-32 |
-10.4 |
$2,770,857 |
$2,601,703 |
$169,154 |
6.5 |
$784 |
$659 |
$125 |
18.9 |
| 8141 |
Private Households |
272 |
304 |
-32 |
-10.4 |
$2,770,857 |
$2,601,703 |
$169,154 |
6.5 |
$784 |
$659 |
$125 |
18.9 |
|
|
|
|
|
|
|
|
|
|
|
|
|
|
| 81 |
Other Services, Except Public Administration - Local Government |
381 |
378 |
2 |
0.6 |
$3,053,089 |
$2,772,078 |
$281,011 |
10.1 |
$617 |
$564 |
$53 |
9.5 |
| 811 |
Repair & Maintenance |
278 |
283 |
-5 |
-1.7 |
$2,171,038 |
$1,933,882 |
$237,156 |
12.3 |
$601 |
$526 |
$74 |
14.1 |
| 8111 |
Automotive Repair & Maintenance |
278 |
283 |
-5 |
-1.7 |
$2,171,038 |
$1,933,882 |
$237,156 |
12.3 |
$601 |
$526 |
$74 |
14.1 |
| 8122 |
Death Care Services |
77 |
71 |
6 |
9.0 |
$540,296 |
$546,674 |
-$6,378 |
-1.2 |
$540 |
$595 |
-$55 |
-9.3 |
|
|
|
|
|
|
|
|
|
|
|
|
|
|
| aPreliminary. |
|
|
|
|
|
|
|
|
|
|
|
|
| bNorth American Industry Classification System. |
|
|
|
|
|
|
|
|
|
|
|
|
| Source: Quarterly Census of Employment and Wages, developed through a cooperative program between Research & Planning and the U.S. Bureau of Labor Statistics. |
|
|
|
|
|
| Extract Date: October 2022. |
|
|
|
|
|
|
|
|
|
|
|
|
| Prepared by M. Moore, Research & Planning, WY DWS, 10/17/22. |
|
|
|
|
|
|
|
|
|
|
|
|
Figure: Average Monthly Employment in Private Other Services, Except Public Administration (NAICSa 81) by County, 2022Q2b
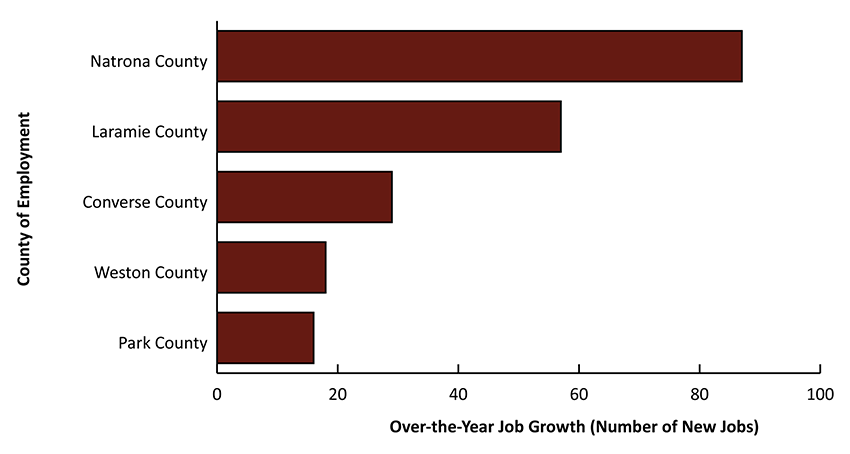
aNorth American Industry Classification System.
bAll industries are private ownership unless otherwise noted.
Source: Quarterly Census of Employment and Wages.
Prepared by M. Moore, Research & Planning, WY DWS, 10/18/2022.


 Wyoming at Work