| Table 28: Wyoming Covered Employment, Total Wages, & Average Weekly Wage by Industry (NAICS) for Nonclassified* County - Second Quarter 2022a |
|
|
|
|
|
|
|
|
|
|
|
|
|
|
|
|
Average Monthly Employment |
Total Wages |
Average Weekly Wage |
|
|
|
Change |
|
Change |
|
Change |
| NAICSb Code |
Ownership and Industry |
2022Q2 |
2021Q2 |
N |
% |
2022Q2 |
2021Q2 |
$ |
% |
2022Q2 |
2021Q2 |
$ |
% |
| 0 |
Ownership - Total |
3,979 |
3,515 |
464 |
13.2 |
$78,222,664 |
$57,719,415 |
$20,503,249 |
35.5 |
$1,512 |
$1,263 |
$249 |
19.7 |
| 0 |
Ownership - Private |
3,727 |
3,325 |
402 |
12.1 |
$72,482,206 |
$53,537,095 |
$18,945,111 |
35.4 |
$1,496 |
$1,239 |
$258 |
20.8 |
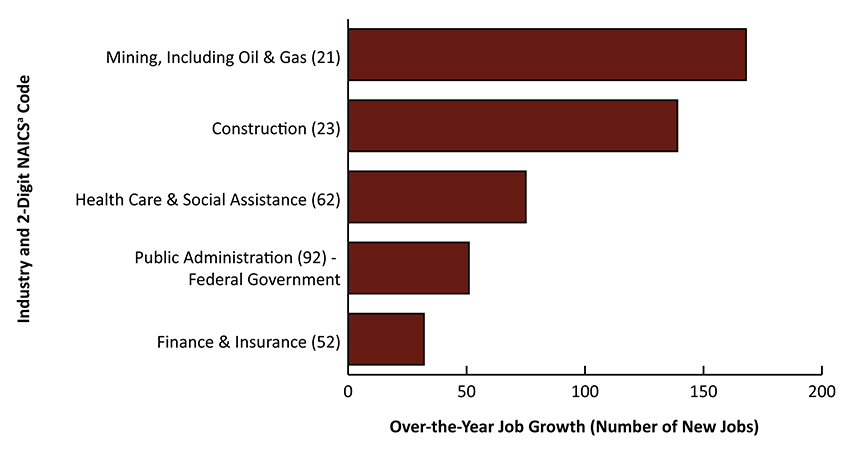
| 21 |
Mining, Including Oil & Gas |
347 |
179 |
168 |
93.5 |
$7,395,440 |
$4,013,984 |
$3,381,456 |
84.2 |
$1,639 |
$1,722 |
-$82 |
-4.8 |
| 213 |
Support Activities For Mining |
318 |
150 |
168 |
112.2 |
$6,594,303 |
$3,330,523 |
$3,263,780 |
98.0 |
$1,597 |
$1,712 |
-$115 |
-6.7 |
| 23 |
Construction |
893 |
753 |
139 |
18.5 |
$19,776,387 |
$12,853,284 |
$6,923,103 |
53.9 |
$1,704 |
$1,312 |
$392 |
29.8 |
| 236 |
Construction of Buildings |
59 |
56 |
2 |
4.2 |
$1,334,297 |
$1,362,703 |
-$28,406 |
-2.1 |
$1,749 |
$1,861 |
-$111 |
-6.0 |
| 237 |
Heavy & Civil Engineering Construction |
412 |
409 |
3 |
0.8 |
$9,913,598 |
$7,318,940 |
$2,594,658 |
35.5 |
$1,849 |
$1,377 |
$473 |
34.4 |
| 238 |
Specialty Trade Contractors |
422 |
288 |
134 |
46.4 |
$8,528,492 |
$4,171,641 |
$4,356,851 |
104.4 |
$1,556 |
$1,114 |
$442 |
39.6 |
| 42 |
Wholesale Trade |
422 |
445 |
-24 |
-5.3 |
$8,186,380 |
$7,350,779 |
$835,601 |
11.4 |
$1,493 |
$1,270 |
$224 |
17.6 |
| 423 |
Merchant Wholesalers, Durable Goods |
83 |
N/A |
N/A |
N/A |
$2,186,537 |
N/A |
N/A |
N/A |
$2,018 |
N/A |
N/A |
N/A |
| 424 |
Merchant Wholesalers, Nondurable Goods |
323 |
332 |
-9 |
-2.7 |
$5,511,716 |
$4,735,675 |
$776,041 |
16.4 |
$1,314 |
$1,098 |
$216 |
19.6 |
| 425 |
Electronic Markets & Agents & Brokers |
16 |
N/A |
N/A |
N/A |
$488,127 |
N/A |
N/A |
N/A |
$2,396 |
N/A |
N/A |
N/A |
| 44-45 |
Retail Trade |
107 |
100 |
7 |
6.7 |
$2,597,011 |
$1,670,285 |
$926,726 |
55.5 |
$1,873 |
$1,285 |
$588 |
45.8 |
| 445 |
Food & Beverage Retailers |
6 |
N/A |
N/A |
N/A |
$32,970 |
N/A |
N/A |
N/A |
$423 |
N/A |
N/A |
N/A |
| 449 |
Furniture, Home Furnishings, Electronics, & Appliance Retailers |
52 |
N/A |
N/A |
N/A |
$1,236,622 |
N/A |
N/A |
N/A |
$1,829 |
N/A |
N/A |
N/A |
| 459 |
Sporting Goods, Hobby, Musical Instrument, Book, & Miscellaneous Retailers |
10 |
N/A |
N/A |
N/A |
$127,883 |
N/A |
N/A |
N/A |
$1,017 |
N/A |
N/A |
N/A |
| 48-49 |
Transportation & Warehousing |
148 |
182 |
-34 |
-18.5 |
$2,353,101 |
$2,613,609 |
-$260,508 |
-10.0 |
$1,223 |
$1,107 |
$116 |
10.5 |
| 484 |
Truck Transportation |
97 |
109 |
-12 |
-11.0 |
$1,667,413 |
$1,544,030 |
$123,383 |
8.0 |
$1,322 |
$1,090 |
$233 |
21.4 |
| 485 |
Transit & Ground Passenger Transportation |
4 |
4 |
0 |
0.0 |
$40,480 |
$35,940 |
$4,540 |
12.6 |
$778 |
$691 |
$87 |
12.6 |
| 488 |
Support Activities For Transportation |
27 |
47 |
-20 |
-43.0 |
$470,536 |
$871,321 |
-$400,785 |
-46.0 |
$1,341 |
$1,416 |
-$76 |
-5.3 |
| 492 |
Couriers & Messengers |
17 |
N/A |
N/A |
N/A |
$108,738 |
N/A |
N/A |
N/A |
$492 |
N/A |
N/A |
N/A |
| 51 |
Information |
11 |
17 |
-6 |
-33.4 |
$184,510 |
$483,550 |
-$299,040 |
-61.8 |
$1,253 |
$2,188 |
-$935 |
-42.7 |
| 517 |
Telecommunications |
6 |
10 |
-4 |
-36.7 |
$95,896 |
$187,229 |
-$91,333 |
-48.8 |
$1,165 |
$1,440 |
-$275 |
-19.1 |
| 52 |
Finance & Insurance |
120 |
89 |
32 |
35.7 |
$2,888,829 |
$2,488,423 |
$400,406 |
16.1 |
$1,847 |
$2,159 |
-$312 |
-14.5 |
| 524 |
Insurance Carriers & Related Activities |
79 |
47 |
32 |
67.6 |
$1,322,479 |
$966,461 |
$356,018 |
36.8 |
$1,282 |
$1,571 |
-$288 |
-18.4 |
| 53 |
Real Estate & Rental & Leasing |
31 |
29 |
2 |
8.1 |
$305,218 |
$208,344 |
$96,874 |
46.5 |
$757 |
$559 |
$198 |
35.5 |
| 531 |
Real Estate |
26 |
N/A |
N/A |
N/A |
$269,639 |
N/A |
N/A |
N/A |
$808 |
N/A |
N/A |
N/A |
| 532 |
Rental & Leasing Services |
5 |
N/A |
N/A |
N/A |
$35,579 |
N/A |
N/A |
N/A |
$513 |
N/A |
N/A |
N/A |
| 54 |
Professional & Technical Services |
313 |
288 |
25 |
8.7 |
$5,567,759 |
$4,604,410 |
$963,349 |
20.9 |
$1,367 |
$1,228 |
$138 |
11.3 |
| 541 |
Professional, Scientific, & Technical Services |
313 |
288 |
25 |
8.7 |
$5,567,759 |
$4,604,410 |
$963,349 |
20.9 |
$1,367 |
$1,228 |
$138 |
11.3 |
| 55 |
Management of Companies & Enterprises |
69 |
64 |
6 |
8.9 |
$1,535,070 |
$2,042,948 |
-$507,878 |
-24.9 |
$1,703 |
$2,468 |
-$765 |
-31.0 |
| 551 |
Management of Companies & Enterprises |
69 |
64 |
6 |
8.9 |
$1,535,070 |
$2,042,948 |
-$507,878 |
-24.9 |
$1,703 |
$2,468 |
-$765 |
-31.0 |
| 56 |
Administrative & Waste Services |
887 |
894 |
-7 |
-0.7 |
$14,941,363 |
$10,950,260 |
$3,991,103 |
36.4 |
$1,296 |
$943 |
$353 |
37.5 |
| 561 |
Administrative & Support Services |
882 |
N/A |
N/A |
N/A |
$14,891,898 |
N/A |
N/A |
N/A |
$1,298 |
N/A |
N/A |
N/A |
| 562 |
Waste Management & Remediation Services |
5 |
N/A |
N/A |
N/A |
$49,465 |
N/A |
N/A |
N/A |
$815 |
N/A |
N/A |
N/A |
| 61 |
Educational Services |
58 |
51 |
7 |
13.0 |
$769,396 |
$615,909 |
$153,487 |
24.9 |
$1,020 |
$923 |
$97 |
10.6 |
| 611 |
Educational Services |
58 |
51 |
7 |
13.0 |
$769,396 |
$615,909 |
$153,487 |
24.9 |
$1,020 |
$923 |
$97 |
10.6 |
| 62 |
Health Care & Social Assistance |
164 |
89 |
75 |
83.9 |
$2,555,185 |
$1,035,757 |
$1,519,428 |
146.7 |
$1,201 |
$895 |
$306 |
34.1 |
| 621 |
Ambulatory Health Care Services |
148 |
78 |
70 |
88.9 |
$2,275,963 |
$868,716 |
$1,407,247 |
162.0 |
$1,183 |
$853 |
$330 |
38.7 |
| 72 |
Accommodation & Food Services |
5 |
N/A |
N/A |
N/A |
$114,953 |
N/A |
N/A |
N/A |
$1,659 |
N/A |
N/A |
N/A |
| 722 |
Food Services & Drinking Places |
5 |
N/A |
N/A |
N/A |
$114,953 |
N/A |
N/A |
N/A |
$1,659 |
N/A |
N/A |
N/A |
| 81 |
Other Services, Except Public Administration |
143 |
138 |
5 |
3.6 |
$3,162,793 |
$2,515,227 |
$647,566 |
25.7 |
$1,697 |
$1,399 |
$299 |
21.4 |
| 811 |
Repair & Maintenance |
94 |
85 |
10 |
11.4 |
$2,683,447 |
$2,026,826 |
$656,621 |
32.4 |
$2,188 |
$1,841 |
$347 |
18.8 |
| 812 |
Personal & Laundry Services |
8 |
N/A |
N/A |
N/A |
$8,436 |
N/A |
N/A |
N/A |
$85 |
N/A |
N/A |
N/A |
| 813 |
Membership Associations & Organizations |
41 |
N/A |
N/A |
N/A |
$470,910 |
N/A |
N/A |
N/A |
$876 |
N/A |
N/A |
N/A |
|
|
|
|
|
|
|
|
|
|
|
|
|
|
| 0 |
Ownership - Federal Government |
228 |
179 |
49 |
27.6 |
$5,425,631 |
$4,054,292 |
$1,371,339 |
33.8 |
$1,831 |
$1,746 |
$85 |
4.9 |
| 92 |
Public Administration |
221 |
170 |
51 |
30.1 |
$5,230,871 |
$3,835,695 |
$1,395,176 |
36.4 |
$1,823 |
$1,739 |
$84 |
4.9 |
| 922 |
Justice, Public Order, & Safety Activities |
7 |
9 |
-2 |
-22.2 |
$184,288 |
$228,365 |
-$44,077 |
-19.3 |
$2,025 |
$1,952 |
$73 |
3.8 |
| 923 |
Administration of Human Resource Programs |
156 |
113 |
42 |
37.4 |
$3,744,435 |
$2,598,404 |
$1,146,031 |
44.1 |
$1,850 |
$1,764 |
$87 |
4.9 |
| 924 |
Administration of Environmental Programs |
19 |
13 |
6 |
42.5 |
$497,496 |
$343,793 |
$153,703 |
44.7 |
$2,014 |
$1,984 |
$30 |
1.5 |
| 926 |
Administration of Economic Programs |
29 |
23 |
6 |
27.5 |
$483,468 |
$402,595 |
$80,873 |
20.1 |
$1,268 |
$1,346 |
-$78 |
-5.8 |
|
|
|
|
|
|
|
|
|
|
|
|
|
|
| *The employer may be located statewide or in more than one county. |
|
|
|
|
|
|
|
|
|
|
| aPreliminary. |
|
|
|
|
|
|
|
|
|
|
|
|
| bNorth American Industry Classification System. |
|
|
|
|
|
|
|
|
|
|
|
|
| Source: Quarterly Census of Employment and Wages, developed through a cooperative program between Research & Planning and the U.S. Bureau of Labor Statistics. |
|
|
|
| Extract Date: October 2022. |
|
|
|
|
|
|
|
|
|
|
|
|
| Prepared by M. Moore, Research & Planning, WY DWS, 10/17/22. |
|
|
|
|
|
|
|
|
|
|
|


 Wyoming at Work