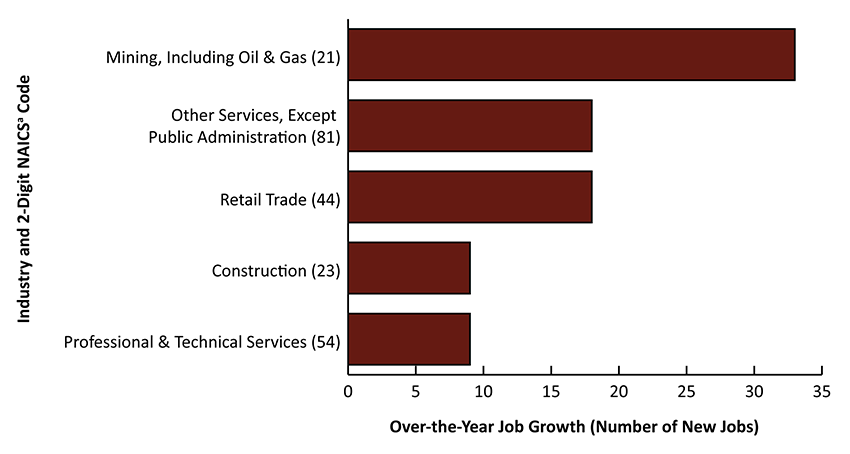
| Table 27: Wyoming Covered Employment, Total Wages, & Average Weekly Wage by Industry (NAICS) for Weston County - Second Quarter 2022a |
|
|
|
|
|
|
|
|
|
|
|
|
|
|
|
|
Average Monthly Employment |
Total Wages |
Average Weekly Wage |
|
|
|
Change |
|
Change |
|
Change |
| NAICSb Code |
Ownership and Industry |
2022Q2 |
2021Q2 |
N |
% |
2022Q2 |
2021Q2 |
$ |
% |
2022Q2 |
2021Q2 |
$ |
% |
| 0 |
Ownership - Total |
2,393 |
2,321 |
71 |
3.1 |
$28,852,400 |
$25,555,171 |
$3,297,229 |
12.9 |
$928 |
$847 |
$81 |
9.5 |
| 0 |
Ownership - Private |
1,563 |
1,521 |
42 |
2.8 |
$18,198,221 |
$15,463,079 |
$2,735,142 |
17.7 |
$895 |
$782 |
$113 |
14.5 |
| 11 |
Agriculture, Forestry, Fishing & Hunting |
45 |
53 |
-8 |
-15.2 |
$221,410 |
$422,965 |
-$201,555 |
-47.7 |
$381 |
$618 |
-$236 |
-38.3 |
| 112 |
Animal Production & Aquaculture |
36 |
41 |
-5 |
-11.4 |
$177,192 |
$360,854 |
-$183,662 |
-50.9 |
$375 |
$677 |
-$302 |
-44.6 |
| 21 |
Mining, Including Oil & Gas |
205 |
172 |
33 |
19.2 |
$3,149,367 |
$2,376,491 |
$772,876 |
32.5 |
$1,184 |
$1,065 |
$119 |
11.2 |
| 213 |
Support Activities For Mining |
193 |
160 |
33 |
20.9 |
$2,907,771 |
$2,192,994 |
$714,777 |
32.6 |
$1,159 |
$1,057 |
$102 |
9.7 |
| 22 |
Utilities |
8 |
7 |
1 |
19.9 |
$177,815 |
$148,642 |
$29,173 |
19.6 |
$1,710 |
$1,714 |
-$4 |
-0.3 |
| 221 |
Utilities |
8 |
7 |
1 |
19.9 |
$177,815 |
$148,642 |
$29,173 |
19.6 |
$1,710 |
$1,714 |
-$4 |
-0.3 |
| 23 |
Construction |
147 |
137 |
9 |
6.8 |
$2,317,726 |
$1,702,397 |
$615,329 |
36.1 |
$1,216 |
$954 |
$262 |
27.5 |
| 238 |
Specialty Trade Contractors |
80 |
74 |
6 |
7.6 |
$1,218,273 |
$995,729 |
$222,544 |
22.3 |
$1,171 |
$1,030 |
$141 |
13.7 |
| 42 |
Wholesale Trade |
17 |
17 |
0 |
0.0 |
$219,362 |
$260,638 |
-$41,276 |
-15.8 |
$993 |
$1,179 |
-$187 |
-15.8 |
| 423 |
Merchant Wholesalers, Durable Goods |
9 |
9 |
0 |
3.7 |
$135,744 |
$110,205 |
$25,539 |
23.2 |
$1,119 |
$942 |
$177 |
18.8 |
| 424 |
Merchant Wholesalers, Nondurable Goods |
8 |
8 |
0 |
-4.1 |
$83,618 |
$150,433 |
-$66,815 |
-44.4 |
$839 |
$1,446 |
-$608 |
-42.0 |
| 44-45 |
Retail Trade |
324 |
306 |
18 |
5.8 |
$1,974,695 |
$1,823,305 |
$151,390 |
8.3 |
$469 |
$458 |
$11 |
2.4 |
| 441 |
Motor Vehicle & Parts Dealers |
29 |
27 |
2 |
7.5 |
$428,475 |
$389,917 |
$38,558 |
9.9 |
$1,150 |
$1,125 |
$25 |
2.2 |
| 444 |
Building Material & Garden Equipment & Supplies Dealers |
46 |
43 |
2 |
5.4 |
$252,388 |
$238,162 |
$14,226 |
6.0 |
$425 |
$423 |
$2 |
0.5 |
| 445 |
Food & Beverage Retailers |
104 |
102 |
1 |
1.3 |
$495,758 |
$491,973 |
$3,785 |
0.8 |
$368 |
$370 |
-$2 |
-0.5 |
| 457 |
Gasoline Stations & Fuel Dealers |
117 |
N/A |
N/A |
N/A |
$631,965 |
N/A |
N/A |
N/A |
$415 |
N/A |
N/A |
N/A |
| 48-49 |
Transportation & Warehousing |
106 |
99 |
7 |
7.1 |
$1,395,526 |
$1,129,044 |
$266,482 |
23.6 |
$1,013 |
$877 |
$135 |
15.4 |
| 484 |
Truck Transportation |
86 |
79 |
7 |
8.8 |
$1,184,818 |
$946,246 |
$238,572 |
25.2 |
$1,056 |
$918 |
$138 |
15.1 |
| 51 |
Information |
25 |
23 |
2 |
8.8 |
$208,035 |
$168,263 |
$39,772 |
23.6 |
$649 |
$571 |
$78 |
13.6 |
| 52 |
Finance & Insurance |
60 |
60 |
0 |
0.5 |
$962,600 |
$928,783 |
$33,817 |
3.6 |
$1,227 |
$1,191 |
$37 |
3.1 |
| 522 |
Credit Intermediation & Related Activities |
44 |
44 |
0 |
-0.7 |
$574,568 |
$544,583 |
$29,985 |
5.5 |
$1,004 |
$945 |
$60 |
6.3 |
| 53 |
Real Estate & Rental & Leasing |
5 |
6 |
-2 |
-26.2 |
$27,384 |
$50,367 |
-$22,983 |
-45.6 |
$451 |
$612 |
-$161 |
-26.3 |
| 531 |
Real Estate |
5 |
6 |
-2 |
-26.2 |
$27,384 |
$50,367 |
-$22,983 |
-45.6 |
$451 |
$612 |
-$161 |
-26.3 |
| 54 |
Professional & Technical Services |
38 |
29 |
9 |
32.2 |
$435,916 |
$319,574 |
$116,342 |
36.4 |
$875 |
$848 |
$27 |
3.2 |
| 541 |
Professional, Scientific, & Technical Services |
38 |
29 |
9 |
32.2 |
$435,916 |
$319,574 |
$116,342 |
36.4 |
$875 |
$848 |
$27 |
3.2 |
| 56 |
Administrative & Waste Services |
15 |
13 |
2 |
15.0 |
$138,466 |
$133,887 |
$4,579 |
3.4 |
$695 |
$773 |
-$78 |
-10.1 |
| 62 |
Health Care & Social Assistance |
159 |
191 |
-31 |
-16.4 |
$1,205,415 |
$1,533,326 |
-$327,911 |
-21.4 |
$582 |
$619 |
-$37 |
-5.9 |
| 624 |
Social Assistance |
83 |
87 |
-4 |
-5.0 |
$457,722 |
$445,442 |
$12,280 |
2.8 |
$426 |
$394 |
$32 |
8.1 |
| 71 |
Arts, Entertainment, & Recreation |
13 |
N/A |
N/A |
N/A |
$39,294 |
N/A |
N/A |
N/A |
$233 |
N/A |
N/A |
N/A |
| 713 |
Amusements, Gambling, & Recreation |
13 |
N/A |
N/A |
N/A |
$39,294 |
N/A |
N/A |
N/A |
$233 |
N/A |
N/A |
N/A |
| 72 |
Accommodation & Food Services |
178 |
197 |
-19 |
-9.6 |
$614,715 |
$638,671 |
-$23,956 |
-3.8 |
$266 |
$249 |
$16 |
6.5 |
| 721 |
Accommodation |
56 |
57 |
-1 |
-1.7 |
$233,077 |
$204,491 |
$28,586 |
14.0 |
$318 |
$274 |
$44 |
16.0 |
| 722 |
Food Services & Drinking Places |
122 |
140 |
-18 |
-12.9 |
$381,638 |
$434,180 |
-$52,542 |
-12.1 |
$241 |
$239 |
$2 |
0.9 |
| 81 |
Other Services, Except Public Administration |
43 |
25 |
18 |
72.0 |
$540,276 |
$188,838 |
$351,438 |
186.1 |
$967 |
$581 |
$385 |
66.3 |
| 811 |
Repair & Maintenance |
39 |
19 |
20 |
101.8 |
$507,732 |
$160,281 |
$347,451 |
216.8 |
$1,001 |
$638 |
$364 |
57.0 |
| 813 |
Membership Associations & Organizations |
4 |
6 |
-2 |
-29.5 |
$32,544 |
$28,557 |
$3,987 |
14.0 |
$626 |
$387 |
$238 |
61.5 |
|
|
|
|
|
|
|
|
|
|
|
|
|
|
| 0 |
Ownership - Federal Government |
48 |
53 |
-5 |
-10.0 |
$863,573 |
$875,911 |
-$12,338 |
-1.4 |
$1,384 |
$1,263 |
$121 |
9.5 |
| 48-49 |
Transportation & Warehousing |
11 |
14 |
-3 |
-19.1 |
$166,942 |
$172,749 |
-$5,807 |
-3.4 |
$1,133 |
$949 |
$184 |
19.4 |
| 491 |
Postal Service |
11 |
14 |
-3 |
-19.1 |
$166,942 |
$172,749 |
-$5,807 |
-3.4 |
$1,133 |
$949 |
$184 |
19.4 |
| 92 |
Public Administration |
37 |
39 |
-3 |
-6.8 |
$696,631 |
$703,162 |
-$6,531 |
-0.9 |
$1,461 |
$1,375 |
$86 |
6.3 |
| 924 |
Administration of Environmental Programs |
30 |
36 |
-5 |
-15.0 |
$660,806 |
$657,188 |
$3,618 |
0.6 |
$1,676 |
$1,417 |
$259 |
18.3 |
|
|
|
|
|
|
|
|
|
|
|
|
|
|
| 0 |
Ownership - State Government |
118 |
128 |
-9 |
-7.3 |
$1,570,756 |
$1,669,424 |
-$98,668 |
-5.9 |
$1,021 |
$1,006 |
$15 |
1.5 |
| 92 |
Public Administration |
116 |
126 |
-9 |
-7.4 |
$1,539,972 |
$1,638,507 |
-$98,535 |
-6.0 |
$1,018 |
$1,003 |
$15 |
1.5 |
| 923 |
Administration of Human Resource Programs |
11 |
10 |
1 |
6.7 |
$118,750 |
$111,976 |
$6,774 |
6.0 |
$856 |
$861 |
-$5 |
-0.6 |
|
|
|
|
|
|
|
|
|
|
|
|
|
|
| 0 |
Ownership - Local Government |
663 |
619 |
44 |
7.1 |
$8,219,850 |
$7,546,757 |
$673,093 |
8.9 |
$954 |
$937 |
$16 |
1.7 |
| 61 |
Educational Services |
292 |
295 |
-3 |
-1.0 |
$3,782,854 |
$3,843,787 |
-$60,933 |
-1.6 |
$997 |
$1,002 |
-$6 |
-0.6 |
| 611 |
Educational Services |
292 |
295 |
-3 |
-1.0 |
$3,782,854 |
$3,843,787 |
-$60,933 |
-1.6 |
$997 |
$1,002 |
-$6 |
-0.6 |
| 92 |
Public Administration |
122 |
119 |
3 |
2.5 |
$1,172,781 |
$1,120,543 |
$52,238 |
4.7 |
$739 |
$724 |
$15 |
2.1 |
| 921 |
Executive, Legislative & General Government |
115 |
111 |
3 |
3.0 |
$1,101,082 |
$1,059,543 |
$41,539 |
3.9 |
$739 |
$732 |
$7 |
0.9 |
|
|
|
|
|
|
|
|
|
|
|
|
|
|
| N/A = not available due to NAICS code changes for 2022 or confidentiality. |
|
|
|
|
|
|
|
|
|
|
| aPreliminary. |
|
|
|
|
|
|
|
|
|
|
|
|
| bNorth American Industry Classification System. |
|
|
|
|
|
|
|
|
|
|
|
|
| Source: Quarterly Census of Employment and Wages, developed through a cooperative program between Research & Planning and the U.S. Bureau of Labor Statistics. |
|
|
|
| Extract Date: October 2022. |
|
|
|
|
|
|
|
|
|
|
|
|
| Prepared by M. Moore, Research & Planning, WY DWS, 10/17/22. |
|
|
|
|
|
|
|
|
|
|
|


 Wyoming at Work