| Table 24: Wyoming Covered Employment, Total Wages, & Average Weekly Wage by Industry (NAICS) for Teton County - Second Quarter 2022a |
|
|
|
|
|
|
|
|
|
|
|
|
|
|
|
|
Average Monthly Employment |
Total Wages |
Average Weekly Wage |
|
|
|
Change |
|
Change |
|
Change |
| NAICSb Code |
Ownership and Industry |
2022Q2 |
2021Q2 |
N |
% |
2022Q2 |
2021Q2 |
$ |
% |
2022Q2 |
2021Q2 |
$ |
% |
| 0 |
Ownership - Total |
21,873 |
20,715 |
1,158 |
5.6 |
$378,472,448 |
$334,955,080 |
$43,517,368 |
13.0 |
$1,331 |
$1,244 |
$87 |
7.0 |
| 0 |
Ownership - Private |
19,208 |
18,070 |
1,138 |
6.3 |
$333,018,056 |
$292,605,962 |
$40,412,094 |
13.8 |
$1,334 |
$1,246 |
$88 |
7.1 |
| 11 |
Agriculture, Forestry, Fishing & Hunting |
89 |
81 |
8 |
10.3 |
$802,427 |
$684,160 |
$118,267 |
17.3 |
$694 |
$652 |
$41 |
6.3 |
| 112 |
Animal Production & Aquaculture |
45 |
44 |
1 |
3.0 |
$417,456 |
$403,042 |
$14,414 |
3.6 |
$708 |
$705 |
$4 |
0.5 |
| 115 |
Agriculture & Forestry Support Activities |
5 |
6 |
-1 |
-11.8 |
$32,506 |
$53,620 |
-$21,114 |
-39.4 |
$500 |
$727 |
-$227 |
-31.3 |
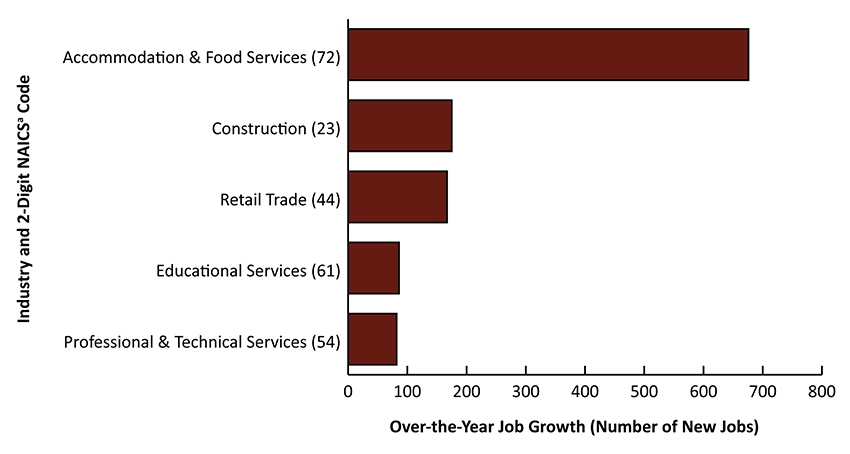
| 23 |
Construction |
2,613 |
2,438 |
175 |
7.2 |
$41,806,644 |
$36,567,200 |
$5,239,444 |
14.3 |
$1,231 |
$1,154 |
$77 |
6.7 |
| 236 |
Construction of Buildings |
1,097 |
1,010 |
87 |
8.6 |
$19,627,199 |
$16,473,069 |
$3,154,130 |
19.1 |
$1,376 |
$1,255 |
$122 |
9.7 |
| 237 |
Heavy & Civil Engineering Construction |
167 |
182 |
-15 |
-8.3 |
$2,698,281 |
$2,947,533 |
-$249,252 |
-8.5 |
$1,245 |
$1,248 |
-$3 |
-0.2 |
| 238 |
Specialty Trade Contractors |
1,350 |
1,246 |
103 |
8.3 |
$19,481,164 |
$17,146,598 |
$2,334,566 |
13.6 |
$1,110 |
$1,058 |
$52 |
4.9 |
| 31-33 |
Manufacturing |
203 |
225 |
-21 |
-9.5 |
$2,522,452 |
$2,498,833 |
$23,619 |
0.9 |
$954 |
$856 |
$99 |
11.5 |
| 311 |
Food Manufacturing |
91 |
109 |
-17 |
-16.0 |
$926,162 |
$922,865 |
$3,297 |
0.4 |
$780 |
$653 |
$127 |
19.4 |
| 312 |
Beverage & Tobacco Product Manufacturing |
36 |
39 |
-3 |
-7.7 |
$360,421 |
$386,312 |
-$25,891 |
-6.7 |
$770 |
$762 |
$8 |
1.1 |
| 332 |
Fabricated Metal Product Manufacturing |
10 |
13 |
-3 |
-25.6 |
$161,771 |
$170,902 |
-$9,131 |
-5.3 |
$1,287 |
$1,011 |
$276 |
27.3 |
| 337 |
Furniture & Related Product Manufacturing |
10 |
13 |
-3 |
-20.5 |
$102,805 |
$111,470 |
-$8,665 |
-7.8 |
$766 |
$660 |
$106 |
16.1 |
| 42 |
Wholesale Trade |
183 |
181 |
1 |
0.7 |
$3,842,895 |
$4,104,838 |
-$261,943 |
-6.4 |
$1,618 |
$1,741 |
-$123 |
-7.1 |
| 424 |
Merchant Wholesalers, Nondurable Goods |
90 |
87 |
3 |
3.5 |
$1,937,878 |
$1,684,487 |
$253,391 |
15.0 |
$1,662 |
$1,495 |
$167 |
11.2 |
| 44-45 |
Retail Trade |
2,095 |
1,928 |
167 |
8.6 |
$25,629,647 |
$24,523,600 |
$1,106,047 |
4.5 |
$941 |
$978 |
-$37 |
-3.8 |
| 441 |
Motor Vehicle & Parts Dealers |
143 |
157 |
-14 |
-9.1 |
$2,645,369 |
$2,844,304 |
-$198,935 |
-7.0 |
$1,423 |
$1,391 |
$32 |
2.3 |
| 444 |
Building Material & Garden Equipment & Supplies Dealers |
152 |
147 |
4 |
2.9 |
$2,437,362 |
$2,285,969 |
$151,393 |
6.6 |
$1,236 |
$1,194 |
$43 |
3.6 |
| 445 |
Food & Beverage Retailers |
565 |
561 |
4 |
0.7 |
$6,700,456 |
$5,614,561 |
$1,085,895 |
19.3 |
$913 |
$770 |
$143 |
18.6 |
| 449 |
Furniture, Home Furnishings, Electronics, & Appliance Retailers |
125 |
N/A |
N/A |
N/A |
$1,763,041 |
N/A |
N/A |
N/A |
$1,085 |
N/A |
N/A |
N/A |
| 455 |
General Merchandise Retailers |
237 |
N/A |
N/A |
N/A |
$2,529,985 |
N/A |
N/A |
N/A |
$820 |
N/A |
N/A |
N/A |
| 456 |
Health & Personal Care Retailers |
24 |
N/A |
N/A |
N/A |
$293,346 |
N/A |
N/A |
N/A |
$953 |
N/A |
N/A |
N/A |
| 457 |
Gasoline Stations & Fuel Dealers |
90 |
N/A |
N/A |
N/A |
$936,464 |
N/A |
N/A |
N/A |
$800 |
N/A |
N/A |
N/A |
| 458 |
Clothing, Clothing Accessories, Shoe, & Jewelry Retailers |
253 |
N/A |
N/A |
N/A |
$2,983,085 |
N/A |
N/A |
N/A |
$907 |
N/A |
N/A |
N/A |
| 459 |
Sporting Goods, Hobby, Musical Instrument, Book, & Miscellaneous Retailers |
506 |
N/A |
N/A |
N/A |
$5,340,539 |
N/A |
N/A |
N/A |
$811 |
N/A |
N/A |
N/A |
| 48-49 |
Transportation & Warehousing |
329 |
430 |
-101 |
-23.4 |
$4,458,250 |
$4,811,549 |
-$353,299 |
-7.3 |
$1,042 |
$861 |
$181 |
21.0 |
| 484 |
Truck Transportation |
58 |
57 |
1 |
1.7 |
$730,480 |
$641,326 |
$89,154 |
13.9 |
$963 |
$861 |
$103 |
11.9 |
| 485 |
Transit & Ground Passenger Transportation |
27 |
31 |
-4 |
-13.0 |
$252,861 |
$200,328 |
$52,533 |
26.2 |
$729 |
$502 |
$227 |
45.2 |
| 487 |
Scenic & Sightseeing Transportation |
27 |
32 |
-4 |
-13.7 |
$190,536 |
$247,212 |
-$56,676 |
-22.9 |
$536 |
$600 |
-$64 |
-10.7 |
| 488 |
Support Activities For Transportation |
92 |
169 |
-78 |
-45.9 |
$1,494,999 |
$1,973,776 |
-$478,777 |
-24.3 |
$1,254 |
$897 |
$358 |
39.9 |
| 492 |
Couriers & Messengers |
83 |
81 |
1 |
1.6 |
$1,194,955 |
$1,089,730 |
$105,225 |
9.7 |
$1,112 |
$1,031 |
$81 |
7.9 |
| 51 |
Information |
221 |
200 |
21 |
10.5 |
$8,615,336 |
$4,169,452 |
$4,445,884 |
106.6 |
$2,994 |
$1,601 |
$1,393 |
87.0 |
| 512 |
Motion Picture & Sound Recording Industries |
56 |
55 |
1 |
2.4 |
$684,817 |
$555,932 |
$128,885 |
23.2 |
$941 |
$782 |
$158 |
20.3 |
| 513 |
Publishing Industries |
93 |
18 |
75 |
418.5 |
$2,627,923 |
$454,201 |
$2,173,722 |
478.6 |
$2,166 |
$1,941 |
$225 |
11.6 |
| 516 |
Broadcasting & Content Providers |
23 |
21 |
1 |
6.3 |
$2,590,423 |
$977,307 |
$1,613,116 |
165.1 |
$8,790 |
$3,524 |
$5,265 |
149.4 |
| 518 |
Computing Infrastructure Providers, Data Processing, Web Hosting, & Related Services |
18 |
N/A |
N/A |
N/A |
$1,644,129 |
N/A |
N/A |
N/A |
$7,026 |
N/A |
N/A |
N/A |
| 52 |
Finance & Insurance |
581 |
569 |
12 |
2.0 |
$31,988,261 |
$35,147,541 |
-$3,159,280 |
-9.0 |
$4,235 |
$4,749 |
-$514 |
-10.8 |
| 522 |
Credit Intermediation & Related Activities |
272 |
292 |
-21 |
-7.1 |
$13,014,737 |
$21,108,362 |
-$8,093,625 |
-38.3 |
$3,685 |
$5,554 |
-$1,869 |
-33.7 |
| 523 |
Securities, Commodity Contracts, & Other Financial Investments & Related Activities |
192 |
157 |
35 |
22.5 |
$13,976,835 |
$10,304,541 |
$3,672,294 |
35.6 |
$5,590 |
$5,049 |
$541 |
10.7 |
| 524 |
Insurance Carriers & Related Activities |
85 |
90 |
-5 |
-5.9 |
$3,831,173 |
$2,132,225 |
$1,698,948 |
79.7 |
$3,467 |
$1,816 |
$1,651 |
90.9 |
| 525 |
Funds, Trusts, & Other Financial Vehicles |
32 |
30 |
2 |
7.9 |
$1,165,516 |
$1,602,413 |
-$436,897 |
-27.3 |
$2,802 |
$4,154 |
-$1,353 |
-32.6 |
| 53 |
Real Estate & Rental & Leasing |
781 |
749 |
33 |
4.4 |
$13,666,821 |
$11,415,108 |
$2,251,713 |
19.7 |
$1,346 |
$1,173 |
$173 |
14.7 |
| 531 |
Real Estate |
561 |
550 |
12 |
2.1 |
$10,916,640 |
$9,199,627 |
$1,717,013 |
18.7 |
$1,496 |
$1,287 |
$209 |
16.2 |
| 532 |
Rental & Leasing Services |
220 |
199 |
21 |
10.6 |
$2,750,181 |
$2,215,481 |
$534,700 |
24.1 |
$962 |
$856 |
$105 |
12.3 |
| 54 |
Professional & Technical Services |
1,287 |
1,205 |
82 |
6.8 |
$45,071,450 |
$38,094,123 |
$6,977,327 |
18.3 |
$2,695 |
$2,432 |
$263 |
10.8 |
| 541 |
Professional, Scientific, & Technical Services |
1,287 |
1,205 |
82 |
6.8 |
$45,071,450 |
$38,094,123 |
$6,977,327 |
18.3 |
$2,695 |
$2,432 |
$263 |
10.8 |
| 55 |
Management of Companies & Enterprises |
78 |
56 |
22 |
39.3 |
$37,033,390 |
$17,357,384 |
$19,676,006 |
113.4 |
$36,522 |
$23,843 |
$12,680 |
53.2 |
| 551 |
Management of Companies & Enterprises |
78 |
56 |
22 |
39.3 |
$37,033,390 |
$17,357,384 |
$19,676,006 |
113.4 |
$36,522 |
$23,843 |
$12,680 |
53.2 |
| 56 |
Administrative & Waste Services |
1,063 |
1,023 |
40 |
3.9 |
$14,377,138 |
$21,473,548 |
-$7,096,410 |
-33.0 |
$1,040 |
$1,614 |
-$574 |
-35.6 |
| 561 |
Administrative & Support Services |
990 |
953 |
37 |
3.9 |
$13,164,597 |
$20,432,149 |
-$7,267,552 |
-35.6 |
$1,023 |
$1,650 |
-$627 |
-38.0 |
| 562 |
Waste Management & Remediation Services |
74 |
71 |
3 |
4.2 |
$1,212,541 |
$1,041,399 |
$171,142 |
16.4 |
$1,266 |
$1,134 |
$133 |
11.7 |
| 61 |
Educational Services |
424 |
338 |
86 |
25.4 |
$4,967,453 |
$3,625,551 |
$1,341,902 |
37.0 |
$901 |
$825 |
$76 |
9.2 |
| 611 |
Educational Services |
424 |
338 |
86 |
25.4 |
$4,967,453 |
$3,625,551 |
$1,341,902 |
37.0 |
$901 |
$825 |
$76 |
9.2 |
| 62 |
Health Care & Social Assistance |
836 |
852 |
-16 |
-1.9 |
$13,126,866 |
$12,178,931 |
$947,935 |
7.8 |
$1,208 |
$1,100 |
$109 |
9.9 |
| 621 |
Ambulatory Health Care Services |
541 |
555 |
-13 |
-2.4 |
$9,917,960 |
$9,317,069 |
$600,891 |
6.4 |
$1,409 |
$1,292 |
$117 |
9.1 |
| 71 |
Arts, Entertainment, & Recreation |
843 |
876 |
-33 |
-3.8 |
$8,814,451 |
$8,313,315 |
$501,136 |
6.0 |
$804 |
$730 |
$74 |
10.2 |
| 711 |
Performing Arts & Spectator Sports |
137 |
156 |
-19 |
-12.0 |
$1,544,723 |
$1,443,878 |
$100,845 |
7.0 |
$867 |
$713 |
$154 |
21.6 |
| 712 |
Museums, Historical Sites, Zoos, & Parks |
48 |
46 |
2 |
4.3 |
$724,307 |
$645,826 |
$78,481 |
12.2 |
$1,153 |
$1,072 |
$81 |
7.5 |
| 713 |
Amusements, Gambling, & Recreation |
658 |
674 |
-16 |
-2.4 |
$6,545,421 |
$6,223,611 |
$321,810 |
5.2 |
$765 |
$710 |
$55 |
7.8 |
| 72 |
Accommodation & Food Services |
6,934 |
6,258 |
676 |
10.8 |
$65,813,965 |
$58,278,579 |
$7,535,386 |
12.9 |
$730 |
$716 |
$14 |
1.9 |
| 721 |
Accommodation |
4,804 |
4,311 |
493 |
11.4 |
$46,781,463 |
$42,002,915 |
$4,778,548 |
11.4 |
$749 |
$750 |
$0 |
-0.1 |
| 722 |
Food Services & Drinking Places |
2,130 |
1,948 |
182 |
9.4 |
$19,032,502 |
$16,275,664 |
$2,756,838 |
16.9 |
$687 |
$643 |
$45 |
6.9 |
| 81 |
Other Services, Except Public Administration |
595 |
610 |
-15 |
-2.5 |
$8,551,565 |
$7,802,071 |
$749,494 |
9.6 |
$1,106 |
$983 |
$122 |
12.4 |
| 811 |
Repair & Maintenance |
99 |
107 |
-8 |
-7.5 |
$1,370,375 |
$1,397,701 |
-$27,326 |
-2.0 |
$1,065 |
$1,005 |
$60 |
6.0 |
| 812 |
Personal & Laundry Services |
164 |
185 |
-21 |
-11.5 |
$1,745,922 |
$1,692,955 |
$52,967 |
3.1 |
$821 |
$704 |
$117 |
16.6 |
| 813 |
Membership Associations & Organizations |
202 |
203 |
-2 |
-0.8 |
$3,635,539 |
$3,217,056 |
$418,483 |
13.0 |
$1,387 |
$1,217 |
$170 |
13.9 |
| 814 |
Private Households |
131 |
115 |
16 |
13.6 |
$1,799,729 |
$1,494,359 |
$305,370 |
20.4 |
$1,059 |
$1,000 |
$60 |
6.0 |
| 99 |
Unclassified |
8 |
7 |
1 |
9.6 |
$417,662 |
$221,771 |
$195,891 |
88.3 |
$4,189 |
$2,437 |
$1,752 |
71.9 |
|
|
|
|
|
|
|
|
|
|
|
|
|
|
| 0 |
Ownership - Federal Government |
420 |
425 |
-5 |
-1.1 |
$7,661,730 |
$7,327,828 |
$333,902 |
4.6 |
$1,402 |
$1,326 |
$76 |
5.7 |
| 48-49 |
Transportation & Warehousing |
20 |
18 |
1 |
7.3 |
$361,523 |
$343,219 |
$18,304 |
5.3 |
$1,414 |
$1,440 |
-$27 |
-1.8 |
| 491 |
Postal Service |
20 |
18 |
1 |
7.3 |
$361,523 |
$343,219 |
$18,304 |
5.3 |
$1,414 |
$1,440 |
-$27 |
-1.8 |
| 92 |
Public Administration |
129 |
130 |
-1 |
-1.0 |
$2,700,628 |
$2,384,580 |
$316,048 |
13.3 |
$1,610 |
$1,407 |
$203 |
14.4 |
| 924 |
Administration of Environmental Programs |
128 |
127 |
0 |
0.3 |
$2,664,419 |
$2,301,144 |
$363,275 |
15.8 |
$1,605 |
$1,390 |
$215 |
15.5 |
|
|
|
|
|
|
|
|
|
|
|
|
|
|
| 0 |
Ownership - State Government |
90 |
95 |
-6 |
-5.9 |
$1,661,845 |
$1,774,792 |
-$112,947 |
-6.4 |
$1,426 |
$1,432 |
-$6 |
-0.5 |
| 92 |
Public Administration |
87 |
92 |
-6 |
-6.1 |
$1,525,529 |
$1,637,888 |
-$112,359 |
-6.9 |
$1,354 |
$1,365 |
-$11 |
-0.8 |
| 922 |
Justice, Public Order, & Safety Activities |
12 |
14 |
-2 |
-11.9 |
$268,815 |
$273,889 |
-$5,074 |
-1.9 |
$1,677 |
$1,505 |
$172 |
11.4 |
| 923 |
Administration of Human Resource Programs |
20 |
20 |
0 |
0.0 |
$332,064 |
$342,414 |
-$10,350 |
-3.0 |
$1,256 |
$1,296 |
-$39 |
-3.0 |
|
|
|
|
|
|
|
|
|
|
|
|
|
|
| 0 |
Ownership - Local Government |
2,155 |
2,125 |
30 |
1.4 |
$36,130,817 |
$33,246,498 |
$2,884,319 |
8.7 |
$1,289 |
$1,203 |
$86 |
7.1 |
| 92 |
Public Administration |
600 |
605 |
-5 |
-0.8 |
$10,024,767 |
$8,959,001 |
$1,065,766 |
11.9 |
$1,285 |
$1,139 |
$145 |
12.8 |
|
|
|
|
|
|
|
|
|
|
|
|
|
|
| N/A = not available due to NAICS code changes for 2022 or confidentiality. |
|
|
|
|
|
|
|
|
|
|
| aPreliminary. |
|
|
|
|
|
|
|
|
|
|
|
|
| bNorth American Industry Classification System. |
|
|
|
|
|
|
|
|
|
|
|
|
| Source: Quarterly Census of Employment and Wages, developed through a cooperative program between Research & Planning and the U.S. Bureau of Labor Statistics. |
|
|
|
| Extract Date: October 2022. |
|
|
|
|
|
|
|
|
|
|
|
|
| Prepared by M. Moore, Research & Planning, WY DWS, 10/17/22. |
|
|
|
|
|
|
|
|
|
|
|


 Wyoming at Work