| Table 23: Wyoming Covered Employment, Total Wages, & Average Weekly Wage by Industry (NAICS) for Sweetwater County - Second Quarter 2022a |
|
|
|
|
|
|
|
|
|
|
|
|
|
|
|
|
Average Monthly Employment |
Total Wages |
Average Weekly Wage |
|
|
|
Change |
|
Change |
|
Change |
| NAICSb Code |
Ownership and Industry |
2022Q2 |
2021Q2 |
N |
% |
2022Q2 |
2021Q2 |
$ |
% |
2022Q2 |
2021Q2 |
$ |
% |
| 0 |
Ownership - Total |
20,176 |
19,930 |
246 |
1.2 |
$315,435,891 |
$299,042,748 |
$16,393,143 |
5.5 |
$1,203 |
$1,154 |
$48 |
4.2 |
| 0 |
Ownership - Private |
16,053 |
15,638 |
414 |
2.6 |
$260,304,903 |
$237,245,107 |
$23,059,796 |
9.7 |
$1,247 |
$1,167 |
$80 |
6.9 |
| 11 |
Agriculture, Forestry, Fishing & Hunting |
9 |
11 |
-2 |
-12.6 |
$49,530 |
$73,396 |
-$23,866 |
-32.5 |
$408 |
$529 |
-$121 |
-22.8 |
| 21 |
Mining, Including Oil & Gas |
3,151 |
3,268 |
-117 |
-3.6 |
$92,304,775 |
$88,914,582 |
$3,390,193 |
3.8 |
$2,254 |
$2,093 |
$161 |
7.7 |
| 211 |
Oil & Gas Extraction |
386 |
392 |
-6 |
-1.4 |
$12,085,836 |
$11,294,081 |
$791,755 |
7.0 |
$2,408 |
$2,218 |
$190 |
8.6 |
| 212 |
Mining |
2,060 |
2,142 |
-82 |
-3.8 |
$66,075,396 |
$64,194,580 |
$1,880,816 |
2.9 |
$2,467 |
$2,305 |
$162 |
7.0 |
| 213 |
Support Activities For Mining |
705 |
734 |
-30 |
-4.0 |
$14,143,543 |
$13,425,921 |
$717,622 |
5.3 |
$1,544 |
$1,406 |
$138 |
9.8 |
| 22 |
Utilities |
390 |
424 |
-34 |
-8.1 |
$10,745,511 |
$11,100,518 |
-$355,007 |
-3.2 |
$2,119 |
$2,012 |
$107 |
5.3 |
| 221 |
Utilities |
390 |
424 |
-34 |
-8.1 |
$10,745,511 |
$11,100,518 |
-$355,007 |
-3.2 |
$2,119 |
$2,012 |
$107 |
5.3 |
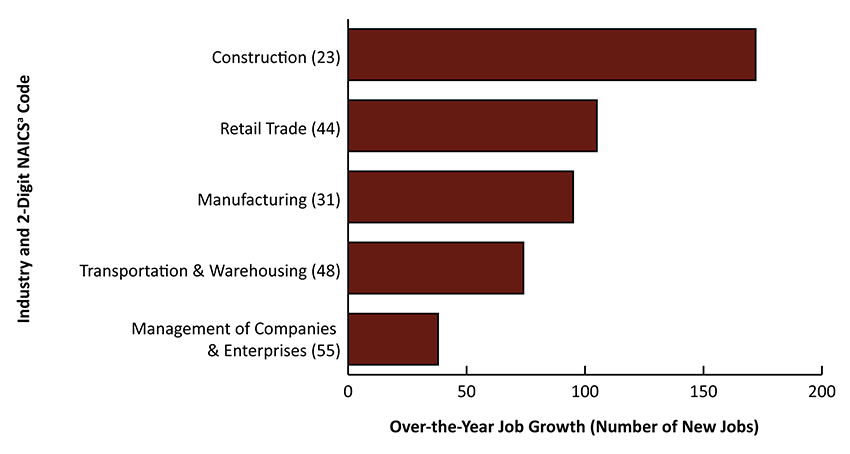
| 23 |
Construction |
1,463 |
1,291 |
172 |
13.4 |
$25,124,012 |
$18,541,965 |
$6,582,047 |
35.5 |
$1,321 |
$1,105 |
$216 |
19.5 |
| 236 |
Construction of Buildings |
120 |
110 |
10 |
8.8 |
$1,846,387 |
$1,413,023 |
$433,364 |
30.7 |
$1,184 |
$985 |
$198 |
20.1 |
| 237 |
Heavy & Civil Engineering Construction |
602 |
448 |
154 |
34.3 |
$12,395,271 |
$7,292,641 |
$5,102,630 |
70.0 |
$1,583 |
$1,251 |
$332 |
26.5 |
| 238 |
Specialty Trade Contractors |
741 |
732 |
9 |
1.2 |
$10,882,354 |
$9,836,301 |
$1,046,053 |
10.6 |
$1,130 |
$1,034 |
$97 |
9.3 |
| 31-33 |
Manufacturing |
1,320 |
1,226 |
95 |
7.7 |
$37,144,634 |
$32,350,135 |
$4,794,499 |
14.8 |
$2,164 |
$2,030 |
$134 |
6.6 |
| 311 |
Food Manufacturing |
14 |
16 |
-2 |
-14.6 |
$85,186 |
$102,072 |
-$16,886 |
-16.5 |
$479 |
$491 |
-$11 |
-2.3 |
| 323 |
Printing & Related Support Activities |
7 |
9 |
-2 |
-25.9 |
$29,172 |
$35,524 |
-$6,352 |
-17.9 |
$336 |
$304 |
$33 |
10.8 |
| 325 |
Chemical Manufacturing |
1,149 |
1,044 |
105 |
10.1 |
$34,779,062 |
$29,881,957 |
$4,897,105 |
16.4 |
$2,329 |
$2,202 |
$127 |
5.7 |
| 332 |
Fabricated Metal Product Manufacturing |
4 |
5 |
-1 |
-21.4 |
$37,928 |
$45,528 |
-$7,600 |
-16.7 |
$795 |
$750 |
$45 |
6.0 |
| 339 |
Miscellaneous Manufacturing |
14 |
14 |
-1 |
-4.6 |
$175,057 |
$186,810 |
-$11,753 |
-6.3 |
$985 |
$1,003 |
-$18 |
-1.8 |
| 42 |
Wholesale Trade |
581 |
572 |
9 |
1.6 |
$9,092,473 |
$8,590,583 |
$501,890 |
5.8 |
$1,204 |
$1,155 |
$49 |
4.2 |
| 423 |
Merchant Wholesalers, Durable Goods |
346 |
366 |
-21 |
-5.6 |
$5,799,700 |
$5,788,365 |
$11,335 |
0.2 |
$1,291 |
$1,215 |
$75 |
6.2 |
| 424 |
Merchant Wholesalers, Nondurable Goods |
232 |
N/A |
N/A |
N/A |
$3,230,031 |
N/A |
N/A |
N/A |
$1,069 |
N/A |
N/A |
N/A |
| 425 |
Electronic Markets & Agents & Brokers |
3 |
N/A |
N/A |
N/A |
$62,742 |
N/A |
N/A |
N/A |
$1,609 |
N/A |
N/A |
N/A |
| 44-45 |
Retail Trade |
2,297 |
2,192 |
105 |
4.8 |
$18,993,632 |
$17,688,775 |
$1,304,857 |
7.4 |
$636 |
$621 |
$15 |
2.5 |
| 441 |
Motor Vehicle & Parts Dealers |
412 |
371 |
41 |
11.0 |
$5,812,909 |
$4,992,638 |
$820,271 |
16.4 |
$1,085 |
$1,034 |
$51 |
4.9 |
| 444 |
Building Material & Garden Equipment & Supplies Dealers |
306 |
309 |
-3 |
-0.9 |
$2,162,577 |
$2,110,757 |
$51,820 |
2.5 |
$543 |
$525 |
$18 |
3.3 |
| 445 |
Food & Beverage Retailers |
345 |
330 |
14 |
4.3 |
$2,711,200 |
$2,622,905 |
$88,295 |
3.4 |
$605 |
$611 |
-$6 |
-0.9 |
| 449 |
Furniture, Home Furnishings, Electronics, & Appliance Retailers |
59 |
N/A |
N/A |
N/A |
$533,265 |
N/A |
N/A |
N/A |
$691 |
N/A |
N/A |
N/A |
| 457 |
Gasoline Stations & Fuel Dealers |
386 |
N/A |
N/A |
N/A |
$2,966,988 |
N/A |
N/A |
N/A |
$591 |
N/A |
N/A |
N/A |
| 458 |
Clothing, Clothing Accessories, Shoe, & Jewelry Retailers |
105 |
N/A |
N/A |
N/A |
$430,076 |
N/A |
N/A |
N/A |
$314 |
N/A |
N/A |
N/A |
| 459 |
Sporting Goods, Hobby, Musical Instrument, Book, & Miscellaneous Retailers |
232 |
N/A |
N/A |
N/A |
$1,110,476 |
N/A |
N/A |
N/A |
$368 |
N/A |
N/A |
N/A |
| 48-49 |
Transportation & Warehousing |
927 |
853 |
74 |
8.6 |
$14,957,492 |
$12,926,457 |
$2,031,035 |
15.7 |
$1,241 |
$1,165 |
$76 |
6.5 |
| 484 |
Truck Transportation |
466 |
454 |
12 |
2.7 |
$7,626,040 |
$7,042,512 |
$583,528 |
8.3 |
$1,259 |
$1,194 |
$65 |
5.4 |
| 486 |
Pipeline Transportation |
108 |
98 |
10 |
10.5 |
$2,735,594 |
$2,265,932 |
$469,662 |
20.7 |
$1,942 |
$1,779 |
$164 |
9.2 |
| 488 |
Support Activities For Transportation |
150 |
127 |
23 |
17.9 |
$2,423,313 |
$1,841,075 |
$582,238 |
31.6 |
$1,245 |
$1,115 |
$130 |
11.7 |
| 492 |
Couriers & Messengers |
120 |
106 |
14 |
12.9 |
$1,337,733 |
$1,172,592 |
$165,141 |
14.1 |
$860 |
$851 |
$9 |
1.1 |
| 51 |
Information |
127 |
109 |
18 |
16.6 |
$1,346,776 |
$1,228,126 |
$118,650 |
9.7 |
$818 |
$869 |
-$51 |
-5.9 |
| 513 |
Publishing Industries |
26 |
N/A |
N/A |
N/A |
$346,314 |
N/A |
N/A |
N/A |
$1,025 |
N/A |
N/A |
N/A |
| 517 |
Telecommunications |
44 |
42 |
2 |
5.5 |
$625,157 |
$624,404 |
$753 |
0.1 |
$1,085 |
$1,144 |
-$59 |
-5.1 |
| 518 |
Computing Infrastructure Providers, Data Processing, Web Hosting, & Related Services |
4 |
N/A |
N/A |
N/A |
$109,355 |
N/A |
N/A |
N/A |
$2,292 |
N/A |
N/A |
N/A |
| 52 |
Finance & Insurance |
325 |
344 |
-19 |
-5.5 |
$5,122,053 |
$5,281,647 |
-$159,594 |
-3.0 |
$1,212 |
$1,181 |
$31 |
2.6 |
| 522 |
Credit Intermediation & Related Activities |
222 |
245 |
-23 |
-9.4 |
$3,221,310 |
$3,452,835 |
-$231,525 |
-6.7 |
$1,115 |
$1,083 |
$32 |
2.9 |
| 524 |
Insurance Carriers & Related Activities |
82 |
77 |
5 |
6.1 |
$1,049,899 |
$1,015,251 |
$34,648 |
3.4 |
$989 |
$1,014 |
-$25 |
-2.5 |
| 53 |
Real Estate & Rental & Leasing |
227 |
210 |
16 |
7.8 |
$2,435,154 |
$2,214,393 |
$220,761 |
10.0 |
$826 |
$810 |
$17 |
2.0 |
| 531 |
Real Estate |
130 |
123 |
7 |
5.7 |
$1,040,079 |
$1,003,198 |
$36,881 |
3.7 |
$617 |
$629 |
-$12 |
-1.9 |
| 532 |
Rental & Leasing Services |
97 |
88 |
9 |
10.6 |
$1,395,075 |
$1,211,195 |
$183,880 |
15.2 |
$1,106 |
$1,063 |
$44 |
4.1 |
| 54 |
Professional & Technical Services |
437 |
420 |
17 |
4.1 |
$6,799,049 |
$6,192,485 |
$606,564 |
9.8 |
$1,198 |
$1,135 |
$63 |
5.5 |
| 541 |
Professional, Scientific, & Technical Services |
437 |
420 |
17 |
4.1 |
$6,799,049 |
$6,192,485 |
$606,564 |
9.8 |
$1,198 |
$1,135 |
$63 |
5.5 |
| 55 |
Management of Companies & Enterprises |
111 |
73 |
38 |
51.8 |
$2,524,737 |
$1,459,708 |
$1,065,029 |
73.0 |
$1,744 |
$1,531 |
$213 |
13.9 |
| 551 |
Management of Companies & Enterprises |
111 |
73 |
38 |
51.8 |
$2,524,737 |
$1,459,708 |
$1,065,029 |
73.0 |
$1,744 |
$1,531 |
$213 |
13.9 |
| 56 |
Administrative & Waste Services |
570 |
551 |
19 |
3.4 |
$6,920,725 |
$4,622,625 |
$2,298,100 |
49.7 |
$935 |
$645 |
$289 |
44.8 |
| 561 |
Administrative & Support Services |
519 |
501 |
19 |
3.7 |
$6,252,016 |
$3,952,501 |
$2,299,515 |
58.2 |
$926 |
$607 |
$319 |
52.5 |
| 562 |
Waste Management & Remediation Services |
50 |
50 |
0 |
0.0 |
$668,709 |
$670,124 |
-$1,415 |
-0.2 |
$1,022 |
$1,024 |
-$2 |
-0.2 |
| 61 |
Educational Services |
37 |
38 |
-1 |
-1.8 |
$201,571 |
$163,831 |
$37,740 |
23.0 |
$415 |
$332 |
$84 |
25.2 |
| 611 |
Educational Services |
37 |
38 |
-1 |
-1.8 |
$201,571 |
$163,831 |
$37,740 |
23.0 |
$415 |
$332 |
$84 |
25.2 |
| 62 |
Health Care & Social Assistance |
1,296 |
1,265 |
31 |
2.5 |
$12,256,909 |
$11,377,306 |
$879,603 |
7.7 |
$727 |
$692 |
$36 |
5.2 |
| 621 |
Ambulatory Health Care Services |
605 |
574 |
31 |
5.5 |
$6,786,701 |
$6,270,691 |
$516,010 |
8.2 |
$863 |
$841 |
$22 |
2.6 |
| 624 |
Social Assistance |
435 |
432 |
3 |
0.8 |
$2,984,136 |
$2,681,022 |
$303,114 |
11.3 |
$528 |
$478 |
$50 |
10.5 |
| 71 |
Arts, Entertainment, & Recreation |
162 |
149 |
13 |
8.5 |
$663,257 |
$598,414 |
$64,843 |
10.8 |
$316 |
$309 |
$7 |
2.1 |
| 72 |
Accommodation & Food Services |
2,199 |
2,188 |
11 |
0.5 |
$9,867,718 |
$9,668,080 |
$199,638 |
2.1 |
$345 |
$340 |
$5 |
1.5 |
| 721 |
Accommodation |
571 |
562 |
9 |
1.6 |
$3,173,909 |
$2,930,938 |
$242,971 |
8.3 |
$428 |
$401 |
$26 |
6.6 |
| 722 |
Food Services & Drinking Places |
1,628 |
1,626 |
2 |
0.1 |
$6,693,809 |
$6,737,142 |
-$43,333 |
-0.6 |
$316 |
$319 |
-$3 |
-0.8 |
| 81 |
Other Services, Except Public Administration |
422 |
453 |
-31 |
-6.9 |
$3,697,738 |
$4,188,312 |
-$490,574 |
-11.7 |
$674 |
$711 |
-$37 |
-5.2 |
| 811 |
Repair & Maintenance |
237 |
267 |
-30 |
-11.2 |
$2,777,794 |
$3,319,546 |
-$541,752 |
-16.3 |
$900 |
$955 |
-$55 |
-5.7 |
| 812 |
Personal & Laundry Services |
99 |
93 |
6 |
6.4 |
$542,107 |
$507,748 |
$34,359 |
6.8 |
$420 |
$418 |
$1 |
0.3 |
| 813 |
Membership Associations & Organizations |
78 |
86 |
-8 |
-9.3 |
$336,323 |
$328,397 |
$7,926 |
2.4 |
$332 |
$294 |
$38 |
12.9 |
| 814 |
Private Households |
7 |
7 |
1 |
9.9 |
$41,514 |
$32,621 |
$8,893 |
27.3 |
$436 |
$376 |
$59 |
15.8 |
|
|
|
|
|
|
|
|
|
|
|
|
|
|
| 0 |
Ownership - Federal Government |
207 |
220 |
-13 |
-5.9 |
$3,751,180 |
$3,799,024 |
-$47,844 |
-1.3 |
$1,392 |
$1,326 |
$65 |
4.9 |
| 48 |
Transportation & Warehousing |
73 |
77 |
-4 |
-5.2 |
$1,144,184 |
$1,139,752 |
$4,432 |
0.4 |
$1,200 |
$1,134 |
$66 |
5.9 |
| 491 |
Postal Service |
73 |
77 |
-4 |
-5.2 |
$1,144,184 |
$1,139,752 |
$4,432 |
0.4 |
$1,200 |
$1,134 |
$66 |
5.9 |
| 92 |
Public Administration |
127 |
134 |
-7 |
-5.2 |
$2,432,586 |
$2,463,704 |
-$31,118 |
-1.3 |
$1,473 |
$1,414 |
$59 |
4.2 |
| 926 |
Administration of Economic Programs |
23 |
27 |
-4 |
-15.8 |
$352,735 |
$405,160 |
-$52,425 |
-12.9 |
$1,180 |
$1,140 |
$39 |
3.5 |
| 0 |
Ownership - State Government |
238 |
244 |
-6 |
-2.3 |
$3,223,402 |
$3,128,380 |
$95,022 |
3.0 |
$1,040 |
$986 |
$54 |
5.5 |
| 92 |
Public Administration |
229 |
235 |
-6 |
-2.6 |
$3,103,487 |
$3,023,958 |
$79,529 |
2.6 |
$1,042 |
$990 |
$53 |
5.3 |
| 922 |
Justice, Public Order, & Safety Activities |
41 |
38 |
3 |
8.8 |
$668,640 |
$584,742 |
$83,898 |
14.3 |
$1,244 |
$1,184 |
$61 |
5.1 |
| 923 |
Administration of Human Resource Programs |
61 |
63 |
-2 |
-2.7 |
$727,795 |
$744,212 |
-$16,417 |
-2.2 |
$918 |
$913 |
$4 |
0.5 |
| 926 |
Administration of Economic Programs |
96 |
106 |
-10 |
-9.7 |
$1,343,126 |
$1,332,504 |
$10,622 |
0.8 |
$1,080 |
$967 |
$113 |
11.7 |
|
|
|
|
|
|
|
|
|
|
|
|
|
|
| 0 |
Ownership - Local Government |
3,677 |
3,827 |
-150 |
-3.9 |
$48,156,406 |
$54,870,237 |
-$6,713,831 |
-12.2 |
$1,007 |
$1,103 |
-$95 |
-8.7 |
| 51 |
Information |
59 |
56 |
3 |
5.3 |
$357,774 |
$398,472 |
-$40,698 |
-10.2 |
$464 |
$544 |
-$80 |
-14.8 |
| 519 |
Other Information Services |
59 |
56 |
3 |
5.3 |
$357,774 |
$398,472 |
-$40,698 |
-10.2 |
$464 |
$544 |
-$80 |
-14.8 |
| 56 |
Administrative & Waste Services |
40 |
33 |
6 |
19.0 |
$415,849 |
$355,071 |
$60,778 |
17.1 |
$806 |
$819 |
-$13 |
-1.6 |
| 61 |
Educational Services |
1,882 |
1,996 |
-114 |
-5.7 |
$23,745,412 |
$27,094,860 |
-$3,349,448 |
-12.4 |
$971 |
$1,044 |
-$73 |
-7.0 |
| 611 |
Educational Services |
1,882 |
1,996 |
-114 |
-5.7 |
$23,745,412 |
$27,094,860 |
-$3,349,448 |
-12.4 |
$971 |
$1,044 |
-$73 |
-7.0 |
| 62 |
Health Care & Social Assistance |
733 |
747 |
-14 |
-1.9 |
$11,975,497 |
$15,585,355 |
-$3,609,858 |
-23.2 |
$1,256 |
$1,604 |
-$348 |
-21.7 |
| 621 |
Ambulatory Health Care Services |
162 |
166 |
-4 |
-2.6 |
$1,918,007 |
$2,003,780 |
-$85,773 |
-4.3 |
$911 |
$927 |
-$16 |
-1.7 |
| 92 |
Public Administration |
872 |
901 |
-29 |
-3.3 |
$10,857,663 |
$10,656,599 |
$201,064 |
1.9 |
$958 |
$909 |
$48 |
5.3 |
| 921 |
Executive, Legislative & General Government |
746 |
769 |
-23 |
-3.0 |
$9,488,386 |
$9,222,879 |
$265,507 |
2.9 |
$978 |
$922 |
$56 |
6.1 |
| 922 |
Justice, Public Order, & Safety Activities |
65 |
65 |
0 |
0.5 |
$563,224 |
$542,213 |
$21,011 |
3.9 |
$667 |
$645 |
$22 |
3.3 |
|
|
|
|
|
|
|
|
|
|
|
|
|
|
| N/A = not available due to NAICS code changes for 2022 or confidentiality. |
|
|
|
|
|
|
|
|
|
|
| aPreliminary. |
|
|
|
|
|
|
|
|
|
|
|
|
| bNorth American Industry Classification System. |
|
|
|
|
|
|
|
|
|
|
|
|
| Source: Quarterly Census of Employment and Wages, developed through a cooperative program between Research & Planning and the U.S. Bureau of Labor Statistics. |
|
|
|
| Extract Date: October 2022. |
|
|
|
|
|
|
|
|
|
|
|
|
| Prepared by M. Moore, Research & Planning, WY DWS, 10/17/22. |
|
|
|
|
|
|
|
|
|
|
|


 Wyoming at Work