| Table 12: Wyoming Covered Employment, Total Wages, & Average Weekly Wage by Industry (NAICS) for Goshen County - Second Quarter 2022a |
|
|
|
|
|
|
|
|
|
|
|
|
|
|
|
|
Average Monthly Employment |
Total Wages |
Average Weekly Wage |
|
|
|
Change |
|
Change |
|
Change |
| NAICSb Code |
Ownership and Industry |
2022Q2 |
2021Q2 |
N |
% |
2022Q2 |
2021Q2 |
$ |
% |
2022Q2 |
2021Q2 |
$ |
% |
| 0 |
Ownership - Total |
4,127 |
4,102 |
25 |
0.6 |
$44,869,302 |
$42,313,595 |
$2,555,707 |
6.0 |
$836 |
$793 |
$43 |
5.4 |
| 0 |
Ownership - Private |
2,822 |
2,763 |
59 |
2.1 |
$28,959,342 |
$26,915,347 |
$2,043,995 |
7.6 |
$789 |
$749 |
$40 |
5.4 |
| 11 |
Agriculture, Forestry, Fishing & Hunting |
152 |
152 |
0 |
0.0 |
$1,397,473 |
$1,389,958 |
$7,515 |
0.5 |
$707 |
$703 |
$4 |
0.5 |
| 111 |
Crop Production |
31 |
30 |
1 |
3.3 |
$312,910 |
$265,420 |
$47,490 |
17.9 |
$768 |
$673 |
$95 |
14.1 |
| 112 |
Animal Production & Aquaculture |
102 |
103 |
-1 |
-0.7 |
$888,153 |
$927,468 |
-$39,315 |
-4.2 |
$668 |
$693 |
-$25 |
-3.6 |
| 115 |
Agriculture & Forestry Support Activities |
18 |
19 |
0 |
-1.8 |
$196,410 |
$197,070 |
-$660 |
-0.3 |
$824 |
$812 |
$12 |
1.5 |
| 22 |
Utilities |
34 |
37 |
-3 |
-8.1 |
$632,015 |
$644,790 |
-$12,775 |
-2.0 |
$1,430 |
$1,341 |
$89 |
6.7 |
| 221 |
Utilities |
34 |
37 |
-3 |
-8.1 |
$632,015 |
$644,790 |
-$12,775 |
-2.0 |
$1,430 |
$1,341 |
$89 |
6.7 |
| 23 |
Construction |
205 |
203 |
2 |
1.0 |
$2,232,101 |
$2,105,781 |
$126,320 |
6.0 |
$838 |
$798 |
$40 |
5.0 |
| 236 |
Construction of Buildings |
17 |
N/A |
N/A |
N/A |
$130,283 |
N/A |
N/A |
N/A |
$590 |
N/A |
N/A |
N/A |
| 237 |
Heavy & Civil Engineering Construction |
74 |
N/A |
N/A |
N/A |
$1,017,567 |
N/A |
N/A |
N/A |
$1,058 |
N/A |
N/A |
N/A |
| 238 |
Specialty Trade Contractors |
114 |
88 |
26 |
30.0 |
$1,084,251 |
$693,494 |
$390,757 |
56.3 |
$732 |
$608 |
$123 |
20.2 |
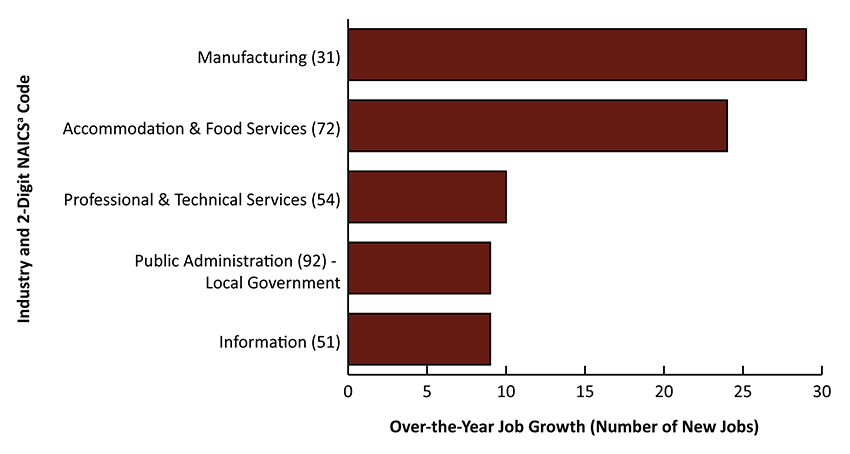
| 31-33 |
Manufacturing |
151 |
123 |
29 |
23.4 |
$1,550,950 |
$1,214,044 |
$336,906 |
27.8 |
$788 |
$761 |
$27 |
3.6 |
| 311 |
Food Manufacturing |
85 |
70 |
15 |
21.5 |
$797,687 |
$562,915 |
$234,772 |
41.7 |
$725 |
$622 |
$103 |
16.6 |
| 42 |
Wholesale Trade |
177 |
171 |
7 |
3.9 |
$2,192,583 |
$1,854,238 |
$338,345 |
18.2 |
$951 |
$836 |
$115 |
13.8 |
| 424 |
Merchant Wholesalers, Nondurable Goods |
116 |
115 |
1 |
0.9 |
$1,183,807 |
$1,126,157 |
$57,650 |
5.1 |
$787 |
$755 |
$32 |
4.2 |
| 44-45 |
Retail Trade |
361 |
367 |
-6 |
-1.6 |
$2,734,989 |
$2,615,934 |
$119,055 |
4.6 |
$583 |
$548 |
$34 |
6.3 |
| 441 |
Motor Vehicle & Parts Dealers |
51 |
48 |
3 |
7.0 |
$587,745 |
$570,175 |
$17,570 |
3.1 |
$886 |
$920 |
-$34 |
-3.6 |
| 444 |
Building Material & Garden Equipment & Supplies Dealers |
57 |
51 |
7 |
13.1 |
$460,199 |
$392,748 |
$67,451 |
17.2 |
$617 |
$596 |
$21 |
3.6 |
| 445 |
Food & Beverage Retailers |
93 |
99 |
-6 |
-6.4 |
$459,285 |
$461,468 |
-$2,183 |
-0.5 |
$381 |
$359 |
$23 |
6.3 |
| 449 |
Furniture, Home Furnishings, Electronics, & Appliance Retailers |
20 |
N/A |
N/A |
N/A |
$186,916 |
N/A |
N/A |
N/A |
$731 |
N/A |
N/A |
N/A |
| 456 |
Health & Personal Care Retailers |
20 |
N/A |
N/A |
N/A |
$227,298 |
N/A |
N/A |
N/A |
$874 |
N/A |
N/A |
N/A |
| 457 |
Gasoline Stations & Fuel Dealers |
72 |
N/A |
N/A |
N/A |
$609,420 |
N/A |
N/A |
N/A |
$651 |
N/A |
N/A |
N/A |
| 459 |
Sporting Goods, Hobby, Musical Instrument, Book, & Miscellaneous Retailers |
21 |
N/A |
N/A |
N/A |
$107,421 |
N/A |
N/A |
N/A |
$393 |
N/A |
N/A |
N/A |
| 48-49 |
Transportation & Warehousing |
49 |
46 |
3 |
7.3 |
$617,687 |
$516,548 |
$101,139 |
19.6 |
$970 |
$870 |
$100 |
11.5 |
| 484 |
Truck Transportation |
39 |
35 |
4 |
12.5 |
$427,299 |
$333,837 |
$93,462 |
28.0 |
$843 |
$741 |
$102 |
13.8 |
| 51 |
Information |
33 |
24 |
9 |
39.4 |
$417,967 |
$290,135 |
$127,832 |
44.1 |
$974 |
$943 |
$31 |
3.3 |
| 517 |
Telecommunications |
6 |
N/A |
N/A |
N/A |
$114,673 |
N/A |
N/A |
N/A |
$1,470 |
N/A |
N/A |
N/A |
| 52 |
Finance & Insurance |
127 |
128 |
-1 |
-0.5 |
$1,946,550 |
$1,914,835 |
$31,715 |
1.7 |
$1,176 |
$1,151 |
$25 |
2.2 |
| 522 |
Credit Intermediation & Related Activities |
81 |
84 |
-3 |
-3.9 |
$1,098,547 |
$1,133,412 |
-$34,865 |
-3.1 |
$1,043 |
$1,034 |
$9 |
0.9 |
| 524 |
Insurance Carriers & Related Activities |
40 |
N/A |
N/A |
N/A |
$557,786 |
N/A |
N/A |
N/A |
$1,064 |
N/A |
N/A |
N/A |
| 53 |
Real Estate & Rental & Leasing |
47 |
45 |
2 |
4.4 |
$506,176 |
$530,148 |
-$23,972 |
-4.5 |
$828 |
$906 |
-$78 |
-8.6 |
| 54 |
Professional & Technical Services |
104 |
94 |
10 |
10.3 |
$1,365,424 |
$1,328,676 |
$36,748 |
2.8 |
$1,010 |
$1,083 |
-$74 |
-6.8 |
| 541 |
Professional, Scientific, & Technical Services |
104 |
94 |
10 |
10.3 |
$1,365,424 |
$1,328,676 |
$36,748 |
2.8 |
$1,010 |
$1,083 |
-$74 |
-6.8 |
| 56 |
Administrative & Waste Services |
99 |
104 |
-5 |
-4.8 |
$757,308 |
$760,294 |
-$2,986 |
-0.4 |
$588 |
$562 |
$26 |
4.6 |
| 61 |
Educational Services |
29 |
29 |
0 |
0.0 |
$124,860 |
$85,741 |
$39,119 |
45.6 |
$327 |
$225 |
$103 |
45.6 |
| 611 |
Educational Services |
29 |
29 |
0 |
0.0 |
$124,860 |
$85,741 |
$39,119 |
45.6 |
$327 |
$225 |
$103 |
45.6 |
| 62 |
Health Care & Social Assistance |
763 |
780 |
-17 |
-2.1 |
$9,499,928 |
$8,838,266 |
$661,662 |
7.5 |
$957 |
$872 |
$86 |
9.8 |
| 621 |
Ambulatory Health Care Services |
173 |
153 |
19 |
12.6 |
$3,359,976 |
$2,844,523 |
$515,453 |
18.1 |
$1,497 |
$1,427 |
$70 |
4.9 |
| 623 |
Nursing & Residential Care Facilities |
278 |
306 |
-29 |
-9.4 |
$2,537,691 |
$2,553,436 |
-$15,745 |
-0.6 |
$703 |
$641 |
$62 |
9.6 |
| 71 |
Arts, Entertainment, & Recreation |
17 |
16 |
0 |
2.1 |
$44,595 |
$41,328 |
$3,267 |
7.9 |
$206 |
$195 |
$11 |
5.7 |
| 713 |
Amusements, Gambling, & Recreation |
17 |
16 |
0 |
2.1 |
$44,595 |
$41,328 |
$3,267 |
7.9 |
$206 |
$195 |
$11 |
5.7 |
| 72 |
Accommodation & Food Services |
372 |
348 |
24 |
7.0 |
$1,400,674 |
$1,321,138 |
$79,536 |
6.0 |
$290 |
$292 |
-$3 |
-0.9 |
| 721 |
Accommodation |
54 |
40 |
14 |
36.1 |
$174,746 |
$147,235 |
$27,511 |
18.7 |
$249 |
$285 |
-$37 |
-12.8 |
| 722 |
Food Services & Drinking Places |
318 |
308 |
10 |
3.2 |
$1,225,928 |
$1,173,903 |
$52,025 |
4.4 |
$297 |
$293 |
$3 |
1.1 |
| 81 |
Other Services, Except Public Administration |
80 |
77 |
3 |
3.5 |
$620,075 |
$607,465 |
$12,610 |
2.1 |
$599 |
$607 |
-$8 |
-1.3 |
| 811 |
Repair & Maintenance |
40 |
41 |
-1 |
-3.2 |
$431,187 |
$414,094 |
$17,093 |
4.1 |
$829 |
$771 |
$58 |
7.6 |
| 812 |
Personal & Laundry Services |
21 |
21 |
0 |
-1.6 |
$116,946 |
$130,758 |
-$13,812 |
-10.6 |
$435 |
$479 |
-$44 |
-9.1 |
|
|
|
|
|
|
|
|
|
|
|
|
|
|
| 0 |
Ownership - Federal Government |
63 |
67 |
-5 |
-6.9 |
$859,402 |
$900,739 |
-$41,337 |
-4.6 |
$1,055 |
$1,029 |
$26 |
2.5 |
| 48-49 |
Transportation & Warehousing |
30 |
29 |
1 |
2.3 |
$381,106 |
$379,219 |
$1,887 |
0.5 |
$988 |
$1,006 |
-$18 |
-1.8 |
| 491 |
Postal Service |
30 |
29 |
1 |
2.3 |
$381,106 |
$379,219 |
$1,887 |
0.5 |
$988 |
$1,006 |
-$18 |
-1.8 |
| 92 |
Public Administration |
14 |
15 |
0 |
-2.3 |
$209,863 |
$203,760 |
$6,103 |
3.0 |
$1,127 |
$1,068 |
$58 |
5.4 |
|
|
|
|
|
|
|
|
|
|
|
|
|
|
| 0 |
Ownership - State Government |
356 |
394 |
-38 |
-9.6 |
$4,860,024 |
$4,985,217 |
-$125,193 |
-2.5 |
$1,049 |
$973 |
$76 |
7.8 |
| 92 |
Public Administration |
342 |
379 |
-37 |
-9.8 |
$4,618,446 |
$4,742,597 |
-$124,151 |
-2.6 |
$1,039 |
$963 |
$76 |
7.9 |
| 921 |
Executive, Legislative & General Government |
5 |
6 |
-1 |
-16.7 |
$67,852 |
$76,861 |
-$9,009 |
-11.7 |
$1,044 |
$985 |
$58 |
5.9 |
| 922 |
Justice, Public Order, & Safety Activities |
271 |
300 |
-29 |
-9.7 |
$3,747,365 |
$3,824,257 |
-$76,892 |
-2.0 |
$1,065 |
$982 |
$83 |
8.5 |
| 923 |
Administration of Human Resource Programs |
19 |
25 |
-6 |
-22.7 |
$231,644 |
$286,286 |
-$54,642 |
-19.1 |
$922 |
$881 |
$41 |
4.6 |
| 926 |
Administration of Economic Programs |
35 |
36 |
0 |
-1.0 |
$424,036 |
$394,217 |
$29,819 |
7.6 |
$923 |
$850 |
$73 |
8.6 |
|
|
|
|
|
|
|
|
|
|
|
|
|
|
| 0 |
Ownership - Local Government |
886 |
877 |
9 |
1.0 |
$10,190,534 |
$9,512,292 |
$678,242 |
7.1 |
$884 |
$834 |
$50 |
6.0 |
| 92 |
Public Administration |
254 |
245 |
9 |
3.8 |
$2,261,147 |
$2,167,702 |
$93,445 |
4.3 |
$684 |
$681 |
$3 |
0.5 |
| 921 |
Executive, Legislative & General Government |
242 |
237 |
6 |
2.4 |
$2,161,878 |
$2,091,849 |
$70,029 |
3.3 |
$686 |
$680 |
$6 |
0.9 |
|
|
|
|
|
|
|
|
|
|
|
|
|
|
| N/A = not available due to NAICS code changes for 2022 or confidentiality. |
|
|
|
|
|
|
|
|
|
|
| aPreliminary. |
|
|
|
|
|
|
|
|
|
|
|
|
| bNorth American Industry Classification System. |
|
|
|
|
|
|
|
|
|
|
|
|
| Source: Quarterly Census of Employment and Wages, developed through a cooperative program between Research & Planning and the U.S. Bureau of Labor Statistics. |
| Extract Date: October 2022. |
|
|
|
|
|
|
|
|
|
|
|
|
| Prepared by M. Moore, Research & Planning, WY DWS, 10/17/22. |
|
|
|
|
|
|
|
|
|
|
|


 Wyoming at Work