| Table 10: Wyoming Covered Employment, Total Wages, & Average Weekly Wage by Industry (NAICS) for Crook County - Fourth Quarter 2021a |
|
|
|
|
|
|
|
|
|
|
|
|
|
|
|
|
Average Monthly Employment |
Total Wages |
Average Weekly Wage |
|
|
|
Change |
|
Change |
|
Change |
| NAICSb Code |
Ownership and Industry |
2021Q4 |
2020Q4 |
N |
% |
2021Q4 |
2020Q4 |
$ |
% |
2021Q4 |
2020Q4 |
$ |
% |
| 0 |
Ownership - Total |
2,494 |
2,496 |
-2 |
-0.1 |
$31,934,986 |
$31,794,252 |
$140,734 |
0.4 |
$985 |
$980 |
$5 |
0.5 |
| 0 |
Ownership - Private |
1,775 |
1,792 |
-17 |
-0.9 |
$23,768,699 |
$23,619,599 |
$149,100 |
0.6 |
$1,030 |
$1,014 |
$16 |
1.6 |
| 11 |
Agriculture, Forestry, Fishing And Hunting |
52 |
65 |
-13 |
-19.5 |
$501,440 |
$633,980 |
-$132,540 |
-20.9 |
$737 |
$750 |
-$13 |
-1.8 |
| 112 |
Animal Production And Aquaculture |
38 |
41 |
-3 |
-8.1 |
$345,876 |
$384,347 |
-$38,471 |
-10.0 |
$700 |
$715 |
-$15 |
-2.1 |
| 113 |
Forestry And Logging |
14 |
24 |
-9 |
-39.5 |
$155,564 |
$249,633 |
-$94,069 |
-37.7 |
$835 |
$811 |
$24 |
2.9 |
| 21 |
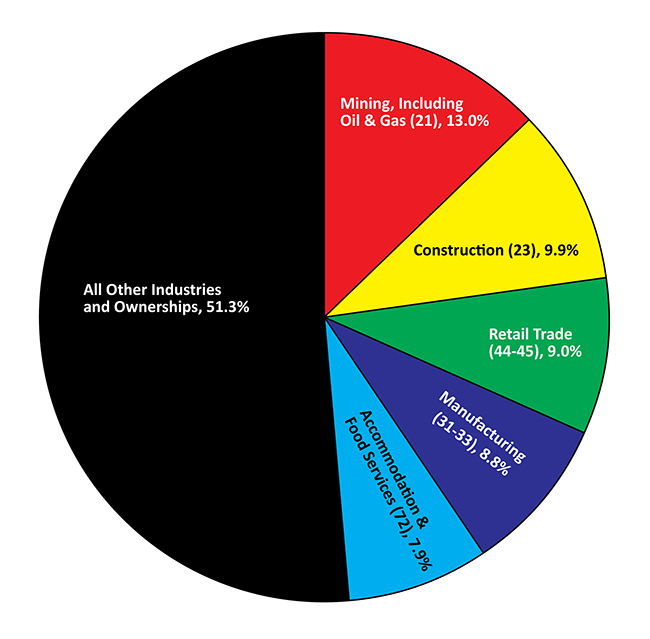
Mining, Quarrying, And Oil And Gas Extraction |
323 |
326 |
-3 |
-0.9 |
$5,724,476 |
$5,516,261 |
$208,215 |
3.8 |
$1,363 |
$1,302 |
$62 |
4.7 |
| 213 |
Support Activities For Mining |
180 |
177 |
3 |
1.5 |
$2,965,039 |
$2,781,021 |
$184,018 |
6.6 |
$1,267 |
$1,206 |
$61 |
5.0 |
| 23 |
Construction |
248 |
265 |
-17 |
-6.4 |
$2,983,083 |
$3,531,462 |
-$548,379 |
-15.5 |
$925 |
$1,025 |
-$100 |
-9.7 |
| 236 |
Construction Of Buildings |
66 |
68 |
-2 |
-3.0 |
$750,166 |
$781,690 |
-$31,524 |
-4.0 |
$879 |
$889 |
-$10 |
-1.1 |
| 237 |
Heavy And Civil Engineering Construction |
29 |
27 |
2 |
6.2 |
$386,578 |
$339,658 |
$46,920 |
13.8 |
$1,037 |
$968 |
$70 |
7.2 |
| 238 |
Specialty Trade Contractors |
154 |
170 |
-17 |
-9.8 |
$1,846,339 |
$2,410,114 |
-$563,775 |
-23.4 |
$924 |
$1,088 |
-$164 |
-15.1 |
| 31 |
Manufacturing |
219 |
224 |
-4 |
-1.9 |
$3,845,264 |
$3,751,962 |
$93,302 |
2.5 |
$1,349 |
$1,290 |
$58 |
4.5 |
| 332 |
Fabricated Metal Product Manufacturing |
15 |
9 |
6 |
60.8 |
$115,600 |
$90,976 |
$24,624 |
27.1 |
$593 |
$750 |
-$157 |
-21.0 |
| 42 |
Wholesale Trade |
71 |
71 |
0 |
-0.5 |
$954,093 |
$852,019 |
$102,074 |
12.0 |
$1,039 |
$923 |
$115 |
12.5 |
| 423 |
Merchant Wholesalers, Durable Goods |
56 |
61 |
-6 |
-9.2 |
$787,279 |
$767,436 |
$19,843 |
2.6 |
$1,088 |
$963 |
$125 |
13.0 |
| 424 |
Merchant Wholesalers, Nondurable Goods |
15 |
10 |
5 |
55.1 |
$166,814 |
$84,583 |
$82,231 |
97.2 |
$855 |
$673 |
$183 |
27.1 |
| 44 |
Retail Trade |
226 |
220 |
6 |
2.7 |
$1,809,486 |
$1,650,702 |
$158,784 |
9.6 |
$617 |
$578 |
$39 |
6.7 |
| 444 |
Building Material And Garden Supply Stores |
14 |
13 |
1 |
7.7 |
$51,918 |
$49,038 |
$2,880 |
5.9 |
$285 |
$290 |
-$5 |
-1.7 |
| 445 |
Food And Beverage Stores |
46 |
50 |
-4 |
-8.6 |
$230,752 |
$242,742 |
-$11,990 |
-4.9 |
$386 |
$371 |
$15 |
4.0 |
| 447 |
Gasoline Stations |
99 |
102 |
-4 |
-3.6 |
$562,369 |
$548,693 |
$13,676 |
2.5 |
$438 |
$412 |
$26 |
6.3 |
| 48 |
Transportation And Warehousing |
32 |
28 |
3 |
11.8 |
$472,098 |
$290,750 |
$181,348 |
62.4 |
$1,147 |
$789 |
$357 |
45.2 |
| 52 |
Finance And Insurance |
64 |
57 |
6 |
11.1 |
$1,035,536 |
$976,914 |
$58,622 |
6.0 |
$1,251 |
$1,311 |
-$60 |
-4.6 |
| 522 |
Credit Intermediation And Related Activities |
45 |
37 |
7 |
19.7 |
$777,832 |
$728,653 |
$49,179 |
6.7 |
$1,339 |
$1,501 |
-$162 |
-10.8 |
| 53 |
Real Estate And Rental And Leasing |
5 |
3 |
1 |
40.2 |
$57,451 |
$30,146 |
$27,305 |
90.6 |
$946 |
$696 |
$250 |
35.9 |
| 531 |
Real Estate |
5 |
3 |
1 |
40.2 |
$57,451 |
$30,146 |
$27,305 |
90.6 |
$946 |
$696 |
$250 |
35.9 |
| 54 |
Professional And Technical Services |
72 |
65 |
7 |
10.2 |
$1,485,757 |
$1,383,575 |
$102,182 |
7.4 |
$1,587 |
$1,629 |
-$42 |
-2.6 |
| 541 |
Professional And Technical Services |
72 |
65 |
7 |
10.2 |
$1,485,757 |
$1,383,575 |
$102,182 |
7.4 |
$1,587 |
$1,629 |
-$42 |
-2.6 |
| 56 |
Administrative And Waste Services |
22 |
30 |
-7 |
-24.7 |
$345,490 |
$467,926 |
-$122,436 |
-26.2 |
$1,190 |
$1,213 |
-$23 |
-1.9 |
| 62 |
Health Care And Social Assistance |
113 |
125 |
-12 |
-9.6 |
$1,422,831 |
$1,574,380 |
-$151,549 |
-9.6 |
$969 |
$969 |
$0 |
0.0 |
| 621 |
Ambulatory Health Care Services |
68 |
82 |
-14 |
-17.0 |
$1,123,171 |
$1,326,872 |
-$203,701 |
-15.4 |
$1,264 |
$1,240 |
$25 |
2.0 |
| 71 |
Arts, Entertainment, And Recreation |
45 |
37 |
8 |
21.4 |
$327,294 |
$261,757 |
$65,537 |
25.0 |
$555 |
$539 |
$16 |
3.0 |
| 72 |
Accommodation And Food Services |
198 |
189 |
9 |
4.6 |
$1,090,614 |
$944,750 |
$145,864 |
15.4 |
$424 |
$384 |
$40 |
10.4 |
| 721 |
Accommodation |
81 |
69 |
12 |
17.3 |
$570,876 |
$493,397 |
$77,479 |
15.7 |
$540 |
$547 |
-$7 |
-1.4 |
| 722 |
Food Services And Drinking Places |
117 |
120 |
-3 |
-2.8 |
$519,738 |
$451,353 |
$68,385 |
15.2 |
$343 |
$289 |
$53 |
18.4 |
| 81 |
Other Services, Except Public Administration |
23 |
25 |
-1 |
-5.4 |
$300,954 |
$285,284 |
$15,670 |
5.5 |
$992 |
$890 |
$103 |
11.6 |
| 811 |
Repair And Maintenance |
16 |
20 |
-3 |
-17.0 |
$207,148 |
$233,250 |
-$26,102 |
-11.2 |
$976 |
$912 |
$64 |
7.0 |
| 0 |
Ownership - Federal Government |
66 |
70 |
-3 |
-4.8 |
$1,035,905 |
$1,081,789 |
-$45,884 |
-4.2 |
$1,201 |
$1,194 |
$7 |
0.6 |
| 48 |
Transportation And Warehousing |
11 |
10 |
1 |
6.7 |
$148,474 |
$140,076 |
$8,398 |
6.0 |
$1,070 |
$1,078 |
-$7 |
-0.7 |
| 491 |
Postal Service |
11 |
10 |
1 |
6.7 |
$148,474 |
$140,076 |
$8,398 |
6.0 |
$1,070 |
$1,078 |
-$7 |
-0.7 |
| 71 |
Arts, Entertainment, And Recreation |
12 |
14 |
-1 |
-9.8 |
$227,644 |
$211,601 |
$16,043 |
7.6 |
$1,420 |
$1,191 |
$229 |
19.3 |
| 712 |
Museums, Historical Sites, Zoos, And Parks |
12 |
14 |
-1 |
-9.8 |
$227,644 |
$211,601 |
$16,043 |
7.6 |
$1,420 |
$1,191 |
$229 |
19.3 |
| 92 |
Public Administration |
43 |
46 |
-3 |
-5.8 |
$659,787 |
$730,112 |
-$70,325 |
-9.6 |
$1,171 |
$1,221 |
-$50 |
-4.1 |
| 924 |
Administration Of Environmental Programs |
40 |
39 |
1 |
3.4 |
$636,068 |
$675,869 |
-$39,801 |
-5.9 |
$1,223 |
$1,344 |
-$121 |
-9.0 |
| 926 |
Administration Of Economic Programs |
3 |
7 |
-4 |
-54.6 |
$23,719 |
$54,243 |
-$30,524 |
-56.3 |
$548 |
$569 |
-$21 |
-3.7 |
| 0 |
Ownership - State Government |
62 |
61 |
1 |
1.6 |
$773,389 |
$752,219 |
$21,170 |
2.8 |
$965 |
$954 |
$11 |
1.1 |
| 92 |
Public Administration |
60 |
59 |
1 |
1.7 |
$752,887 |
$732,352 |
$20,535 |
2.8 |
$971 |
$960 |
$10 |
1.1 |
| 922 |
Justice, Public Order, And Safety Activities |
3 |
3 |
0 |
0.0 |
$57,979 |
$58,046 |
-$67 |
-0.1 |
$1,487 |
$1,488 |
-$2 |
-0.1 |
| 924 |
Administration Of Environmental Programs |
3 |
3 |
0 |
12.4 |
$42,200 |
$46,444 |
-$4,244 |
-9.1 |
$1,082 |
$1,338 |
-$256 |
-19.1 |
| 926 |
Administration Of Economic Programs |
49 |
51 |
-1 |
-2.6 |
$600,338 |
$593,013 |
$7,325 |
1.2 |
$936 |
$900 |
$36 |
4.0 |
| 0 |
Ownership - Local Government |
591 |
574 |
17 |
3.0 |
$6,356,993 |
$6,340,645 |
$16,348 |
0.3 |
$827 |
$850 |
-$22 |
-2.6 |
| 92 |
Public Administration |
105 |
102 |
3 |
3.0 |
$1,073,104 |
$1,052,546 |
$20,558 |
2.0 |
$789 |
$796 |
-$8 |
-1.0 |
| 921 |
Executive, Legislative And General Government |
100 |
98 |
2 |
2.4 |
$1,033,902 |
$1,025,735 |
$8,167 |
0.8 |
$795 |
$808 |
-$13 |
-1.6 |
|
|
|
|
|
|
|
|
|
|
|
|
|
|
| aPreliminary. |
|
|
|
|
|
|
|
|
|
|
|
|
| bNorth American Industry Classification System. |
|
|
|
|
|
|
|
|
|
|
|
|
| Source: Quarterly Census of Employment and Wages, developed through a cooperative program between Research & Planning and the U.S. Bureau of Labor Statistics. |
| Extract Date: April 2022. |
|
|
|
|
|
|
|
|
|
|
|
|
| Prepared by M. Moore, Research & Planning, WY DWS, 4/15/22. |
|
|
|
|
|
|
|
|
|
|
|


 Wyoming at Work